Technical analysis is a systematic way of analyzing and studying financial markets to make informed trading decisions. Technical analysis has been in practice for centuries, however, it has become extremely popular in the 21st century. Nowadays, data science and tools have become more advanced. Today, it is the age of the internet and more people have access to data and advanced tools to make informed trading decisions.
- Technical analysis or TA is the study of the past movements of financial markets and securities including price and volume.
- Also it encompasses many tools useful for traders.
- It relies mostly on probabilities and risk management.
Technical analysis includes researching stock price charts and various indicators derived from (basic) prices in order to predict the development of the market.
What is technical analysis?
Study of past price action
Technical analysis or TA is the study of the past movements of financial markets and securities including price and volume. It works on the simple principle that history repeats itself. That means the financial markets have a tendency to move in repeated and consistent patterns. So, through study and analysis of the past price and volume movements, those patterns are identified and their future movements are predicted. This information is extremely useful that enables investors to make informed decisions.
Technical analysis is one of the two major analytical techniques to analyze financial markets. The second one is fundamental analysis. Fundamental analysis focuses on figuring out the true value of stocks. On the other hand, technical analysis focuses on identifying patterns on a chart to predict future price movements.
This graphic extrapolation method is applicable to all types of markets: indices, stocks, interest rates, commodities…, so it is not limited to the stock market (stock market); once the supply and demand meeting determines the price, the same tools and methods are possible to apply to any type of underlying asset.
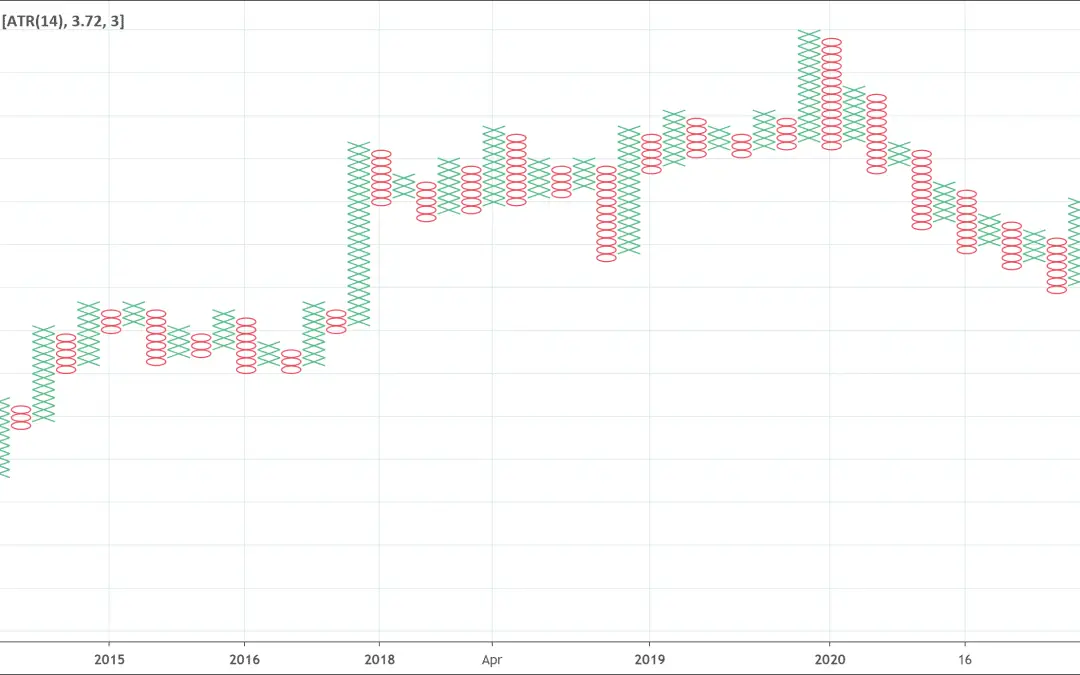
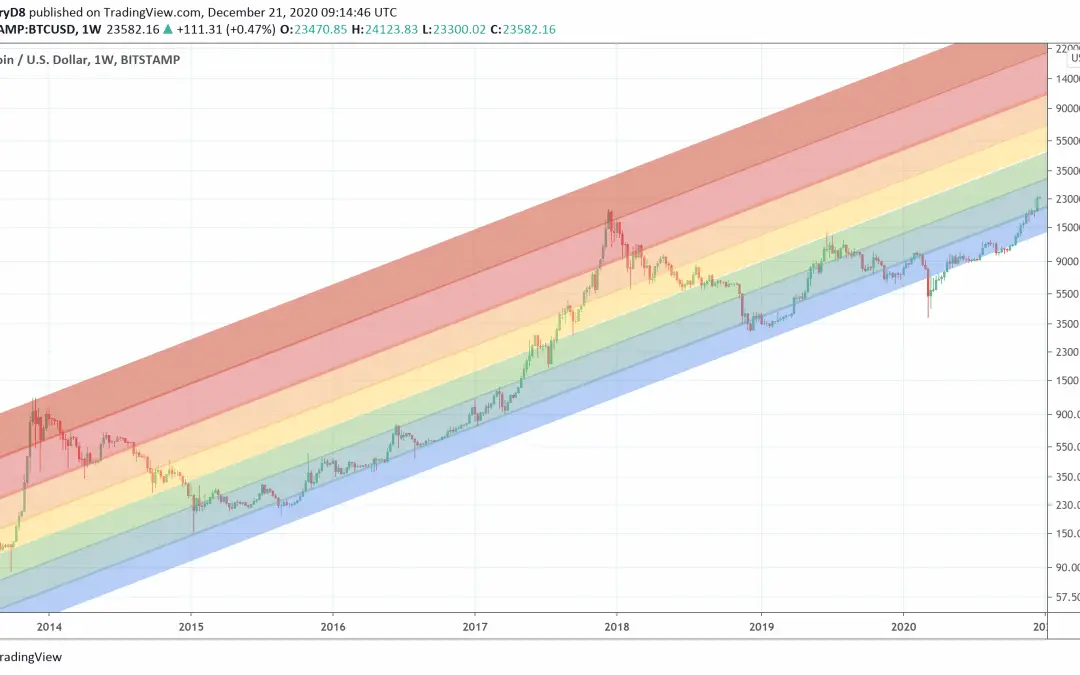
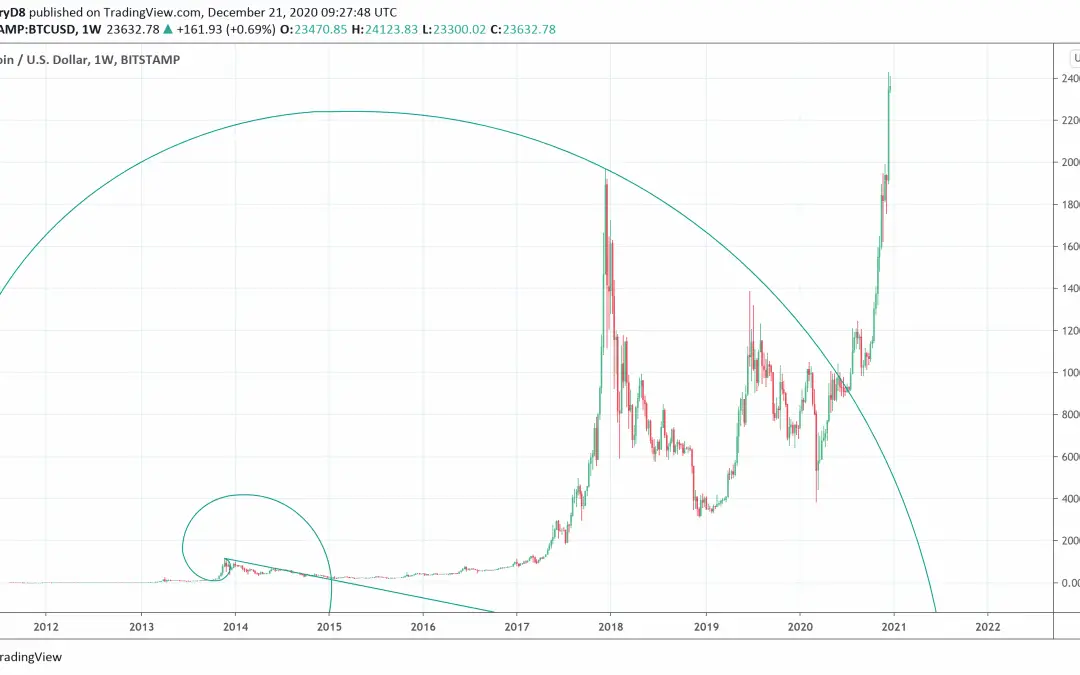
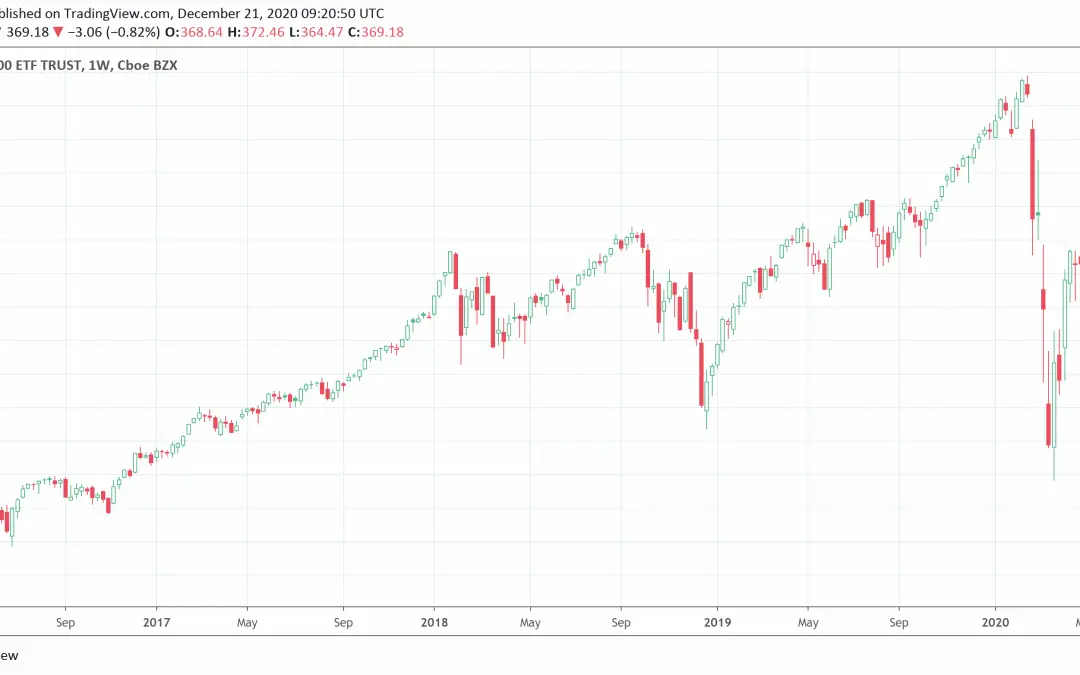
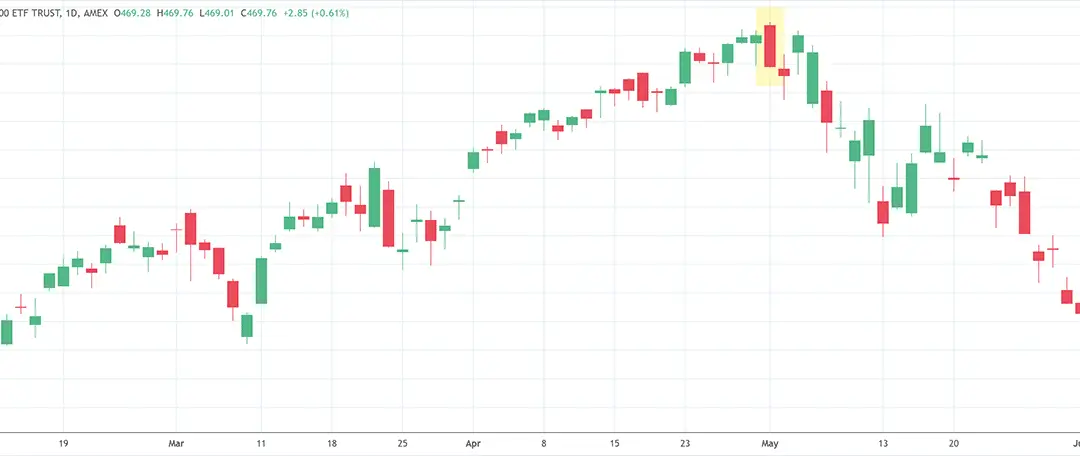
The main tool of the technical analyst is graphics, which can visualize and analyze the underlying assets.
Many tools to help traders
The biggest helping tool in technical analysis charts. Technical analysts are so much engrossed in charts that they are branded as chartists. They rely on charts because charts are the easiest and most convenient source to visualize past price and volume data. Technical analysts analyze charts to find patterns and trends that eventually help them in spotting some profitable trading opportunities.
The best way to chart your technical analysis is using the TradingView solution. It lets you chart all the patterns and indicators you’d like on every chart type. You can try it now for free!
The technical analysis presents a totally different picture of a company and demands a focus on price data and movements. You need to observe market trends and patterns to predict the market’s future movements. You may use the following technical indicators to conduct technical analysis.
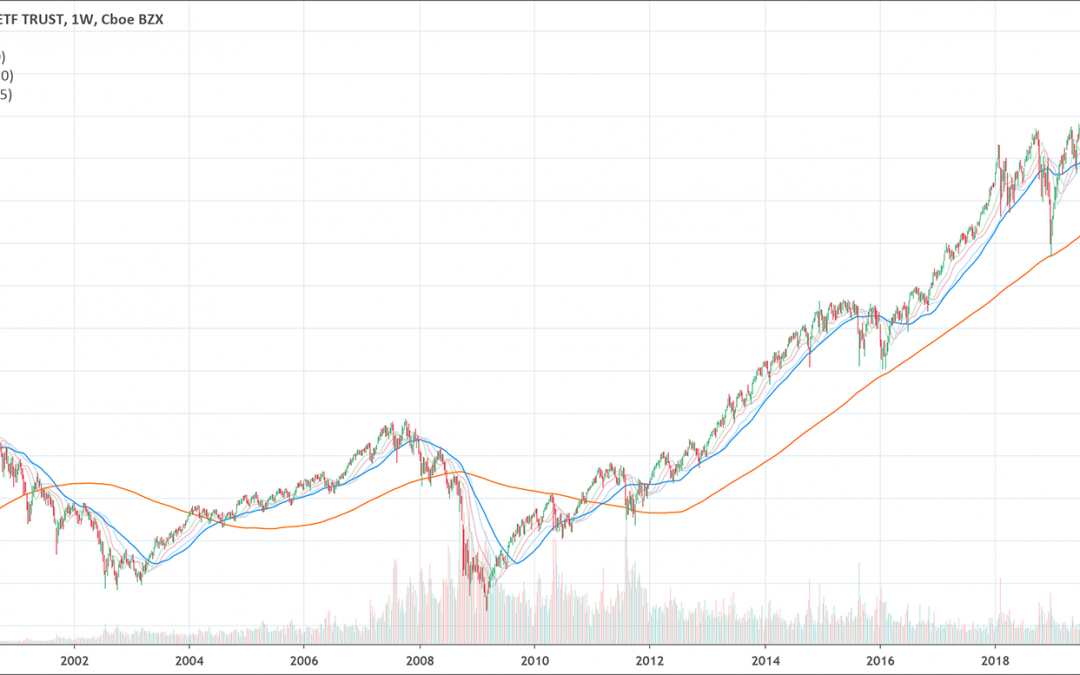
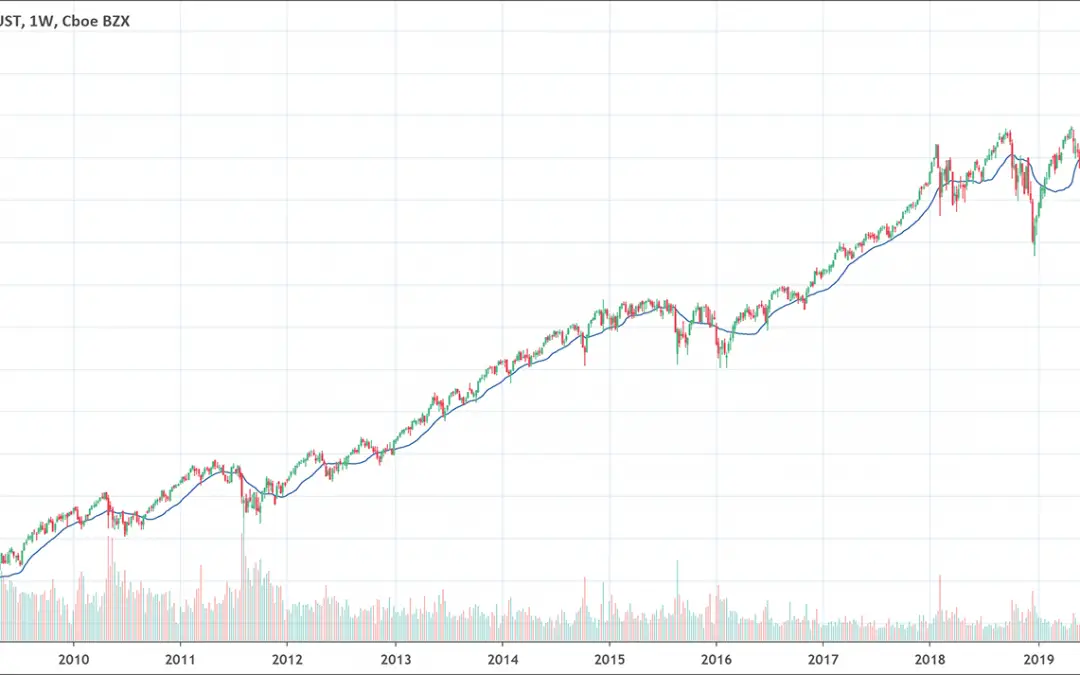
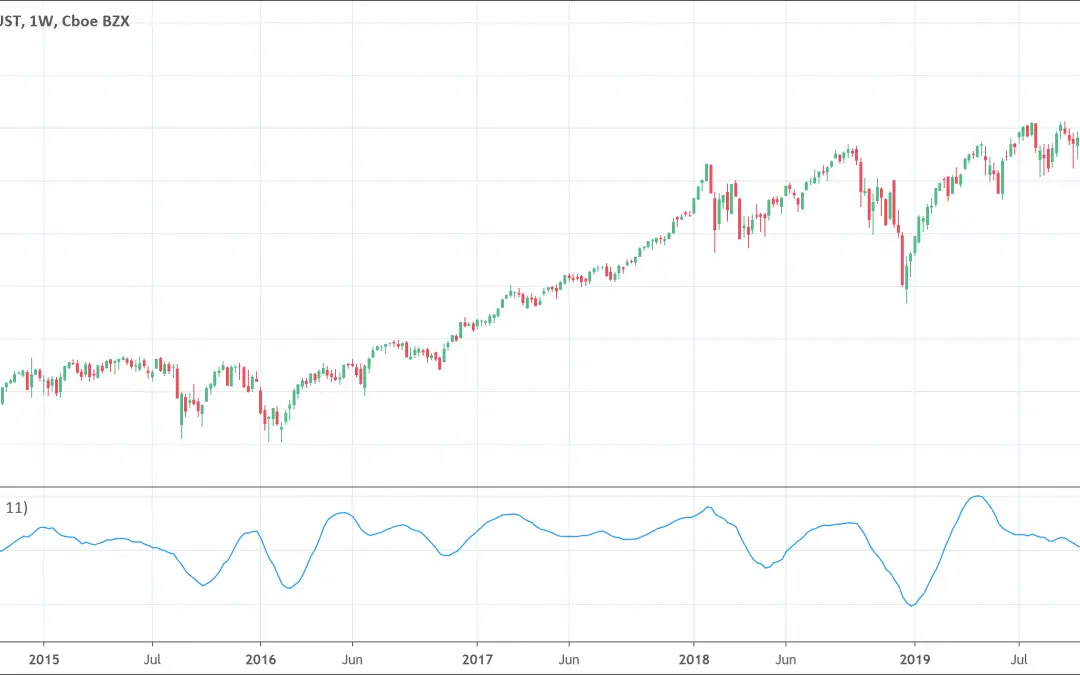
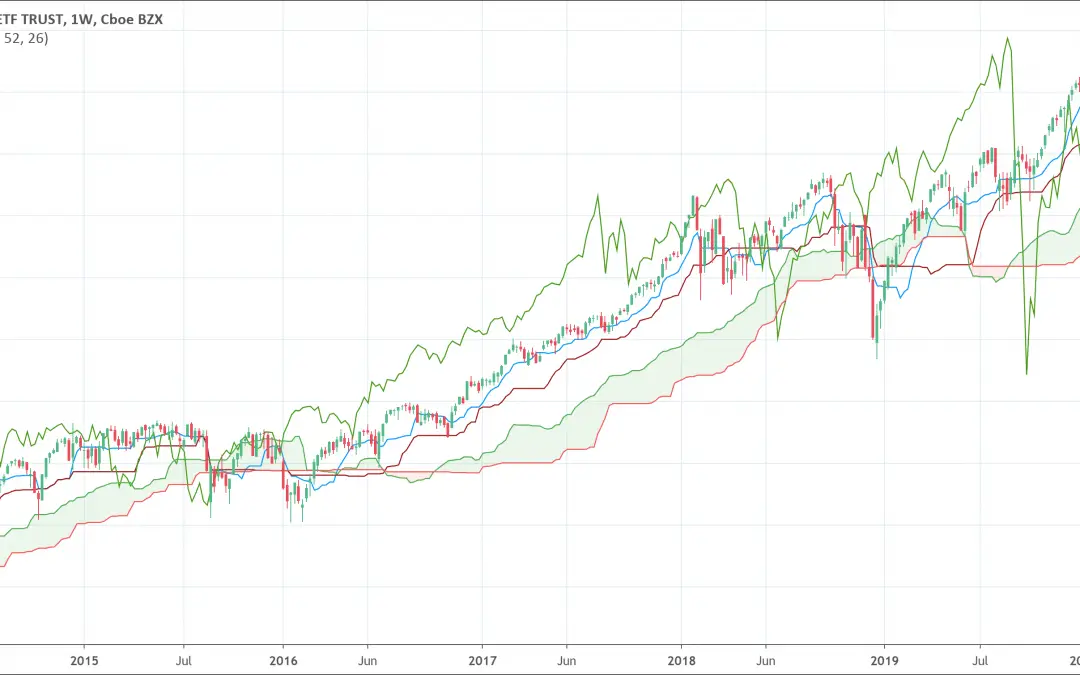
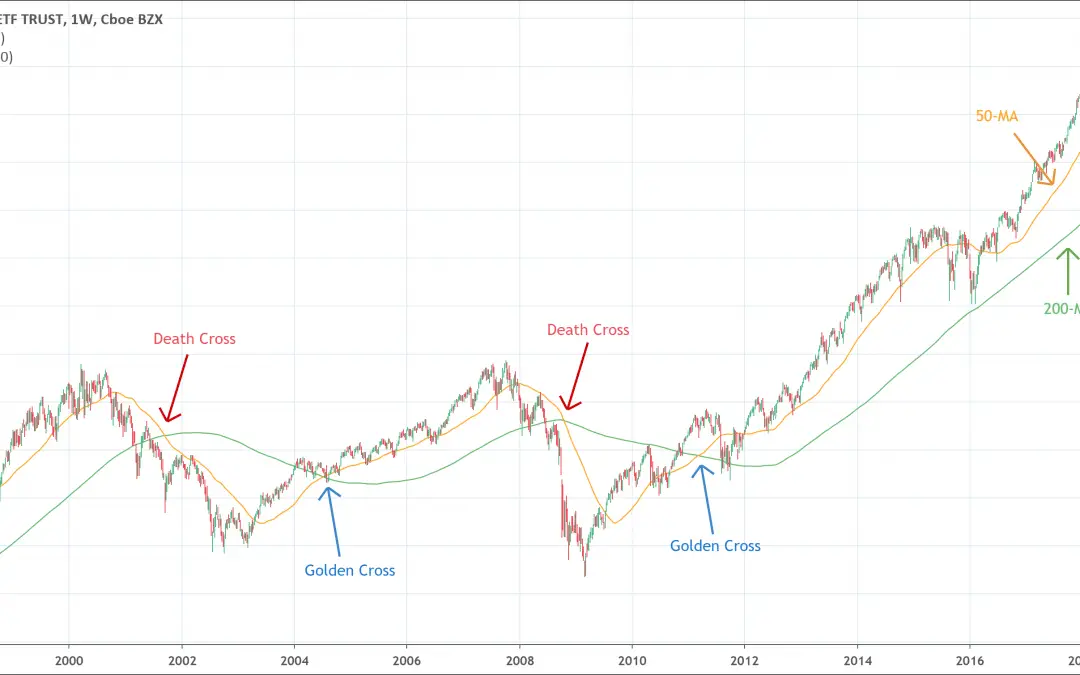
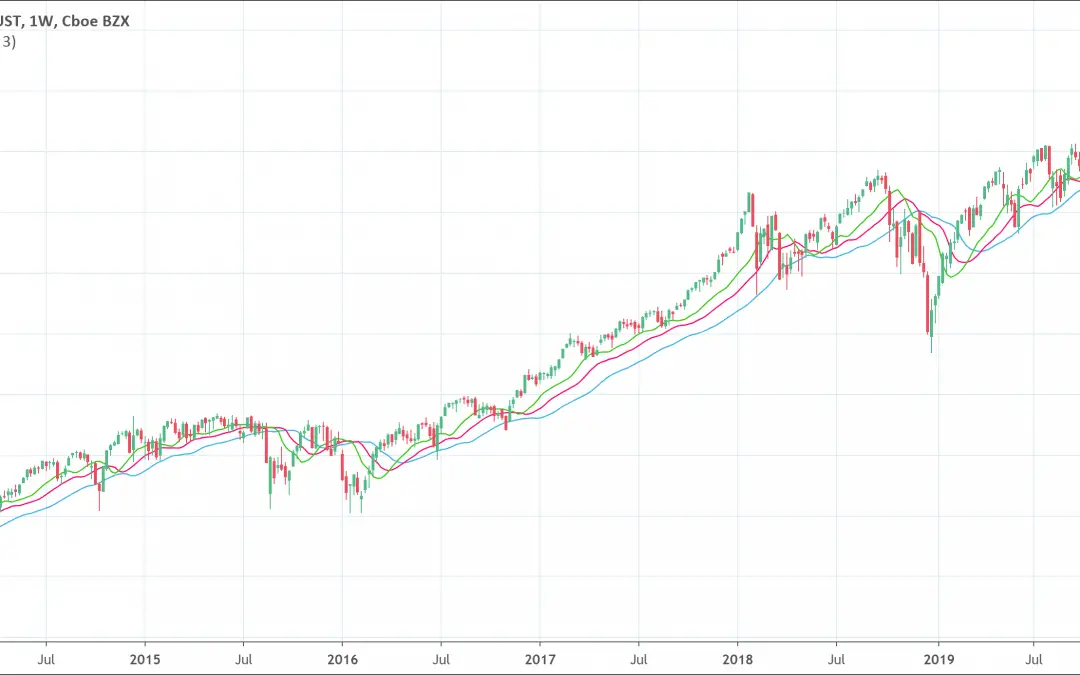
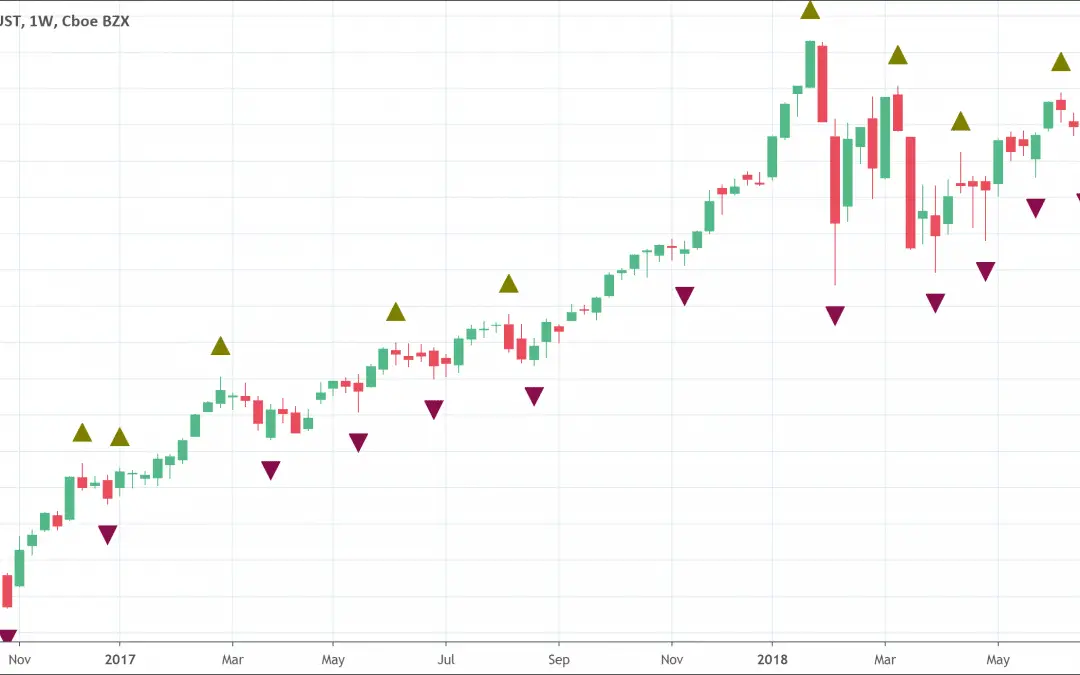
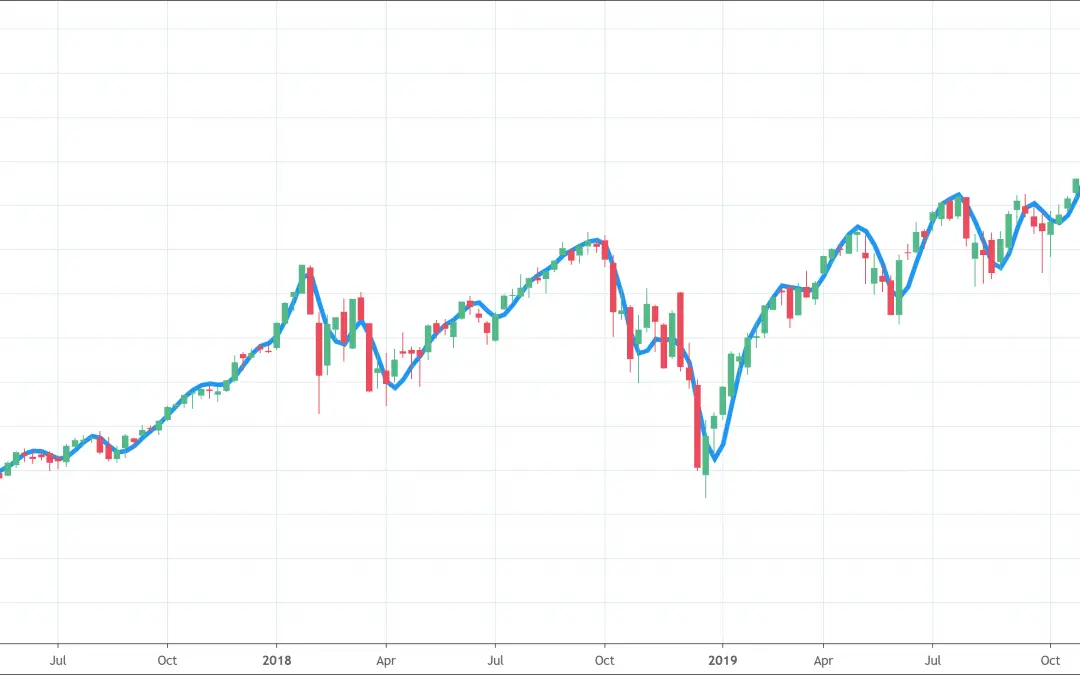
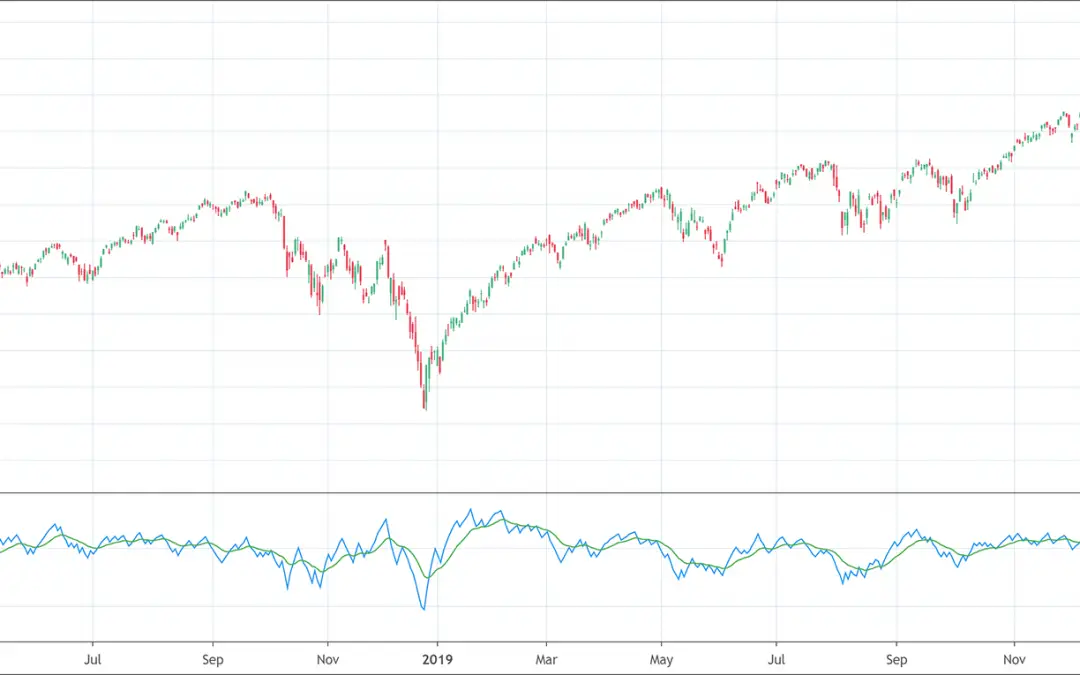
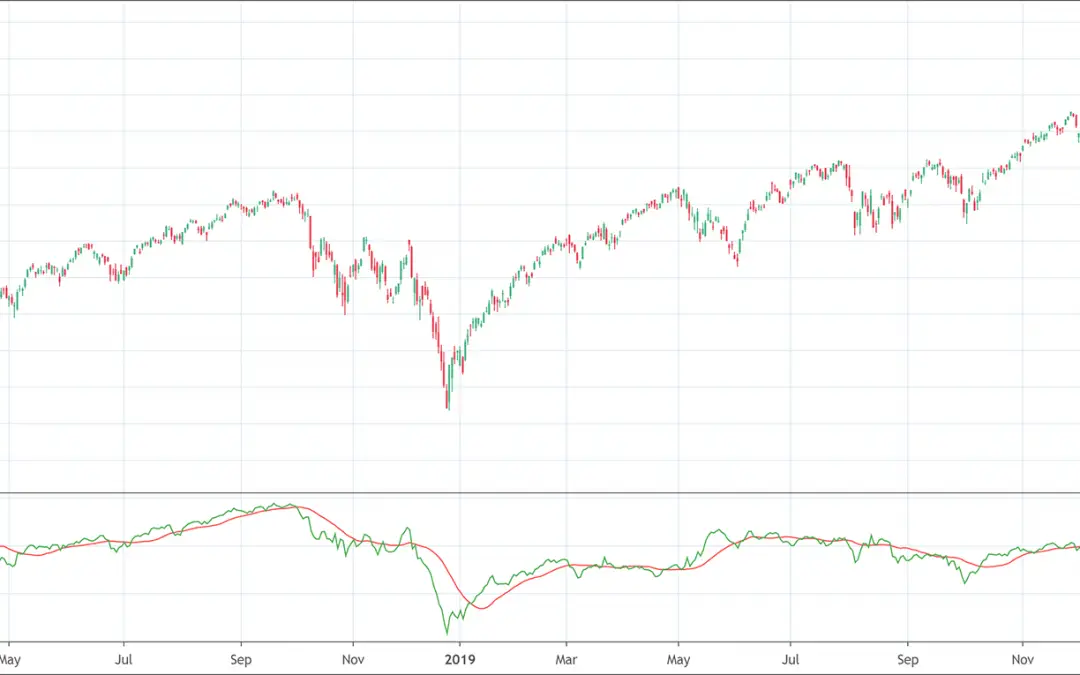
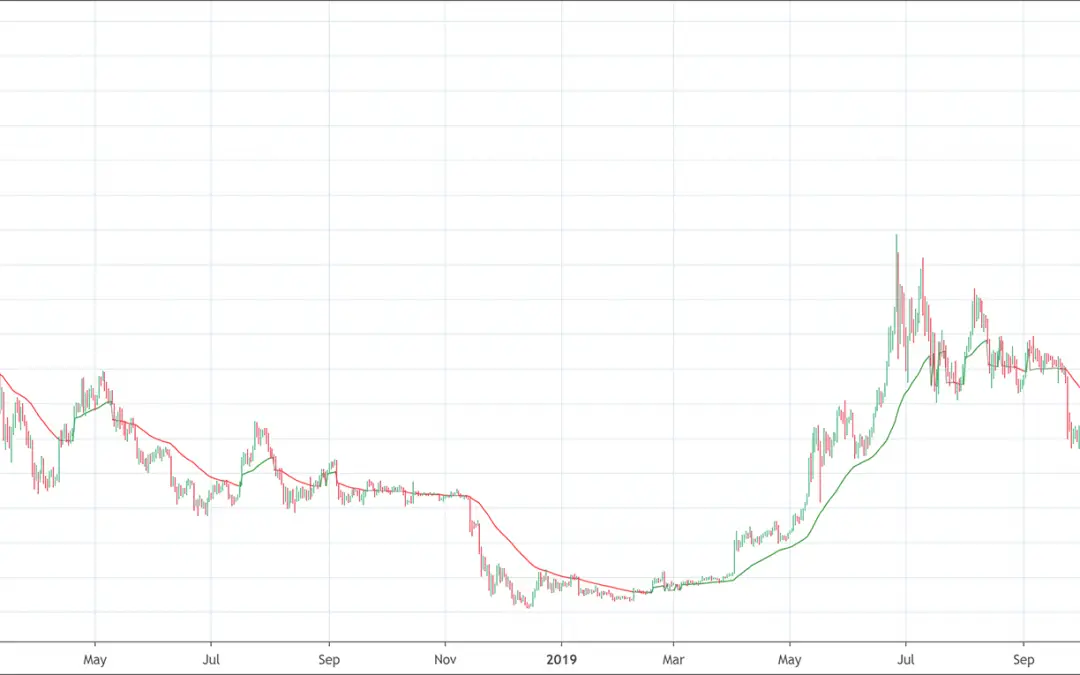
- Moving averages to determine the direction of the current market trend.
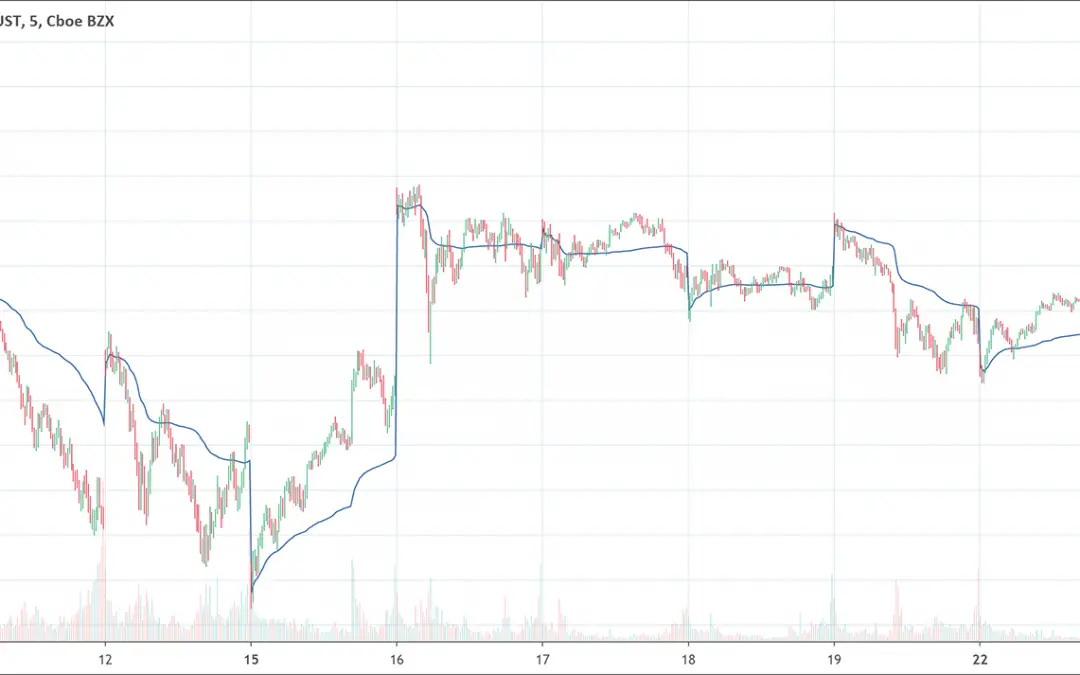
- Exponential moving averages to confirm crucial movements of the market and measure their authenticity.
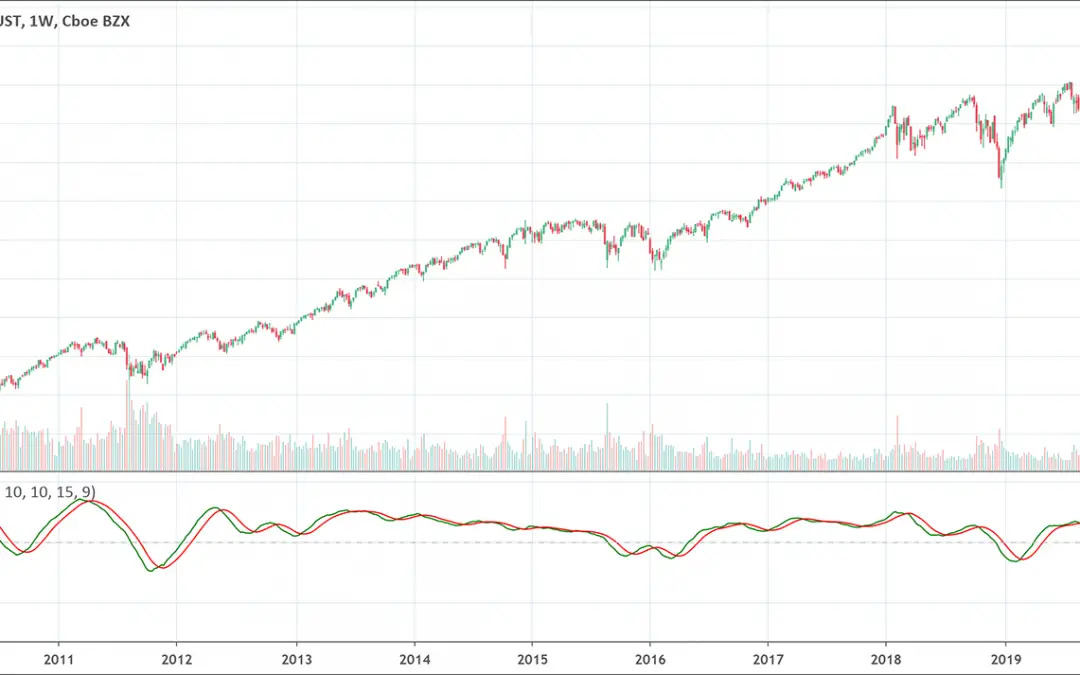
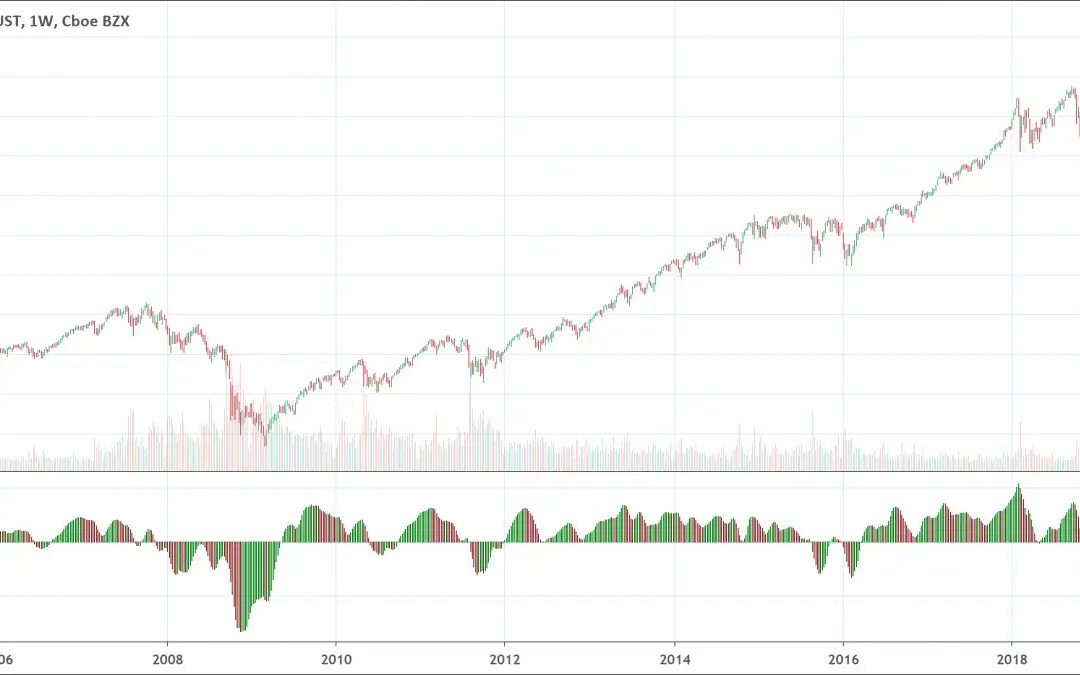
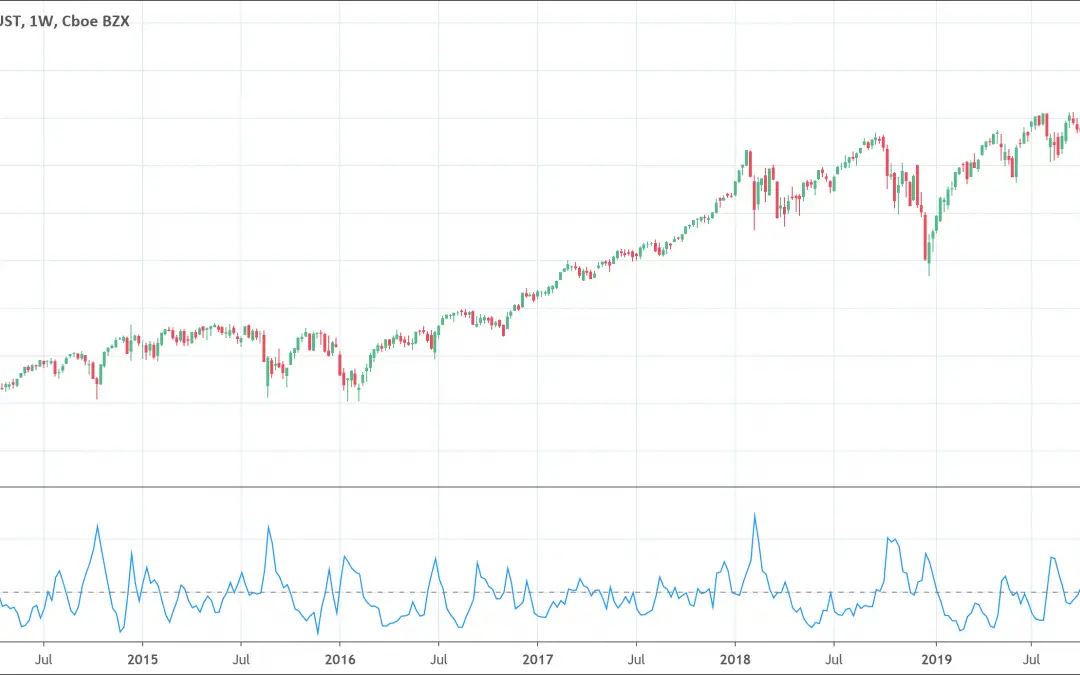
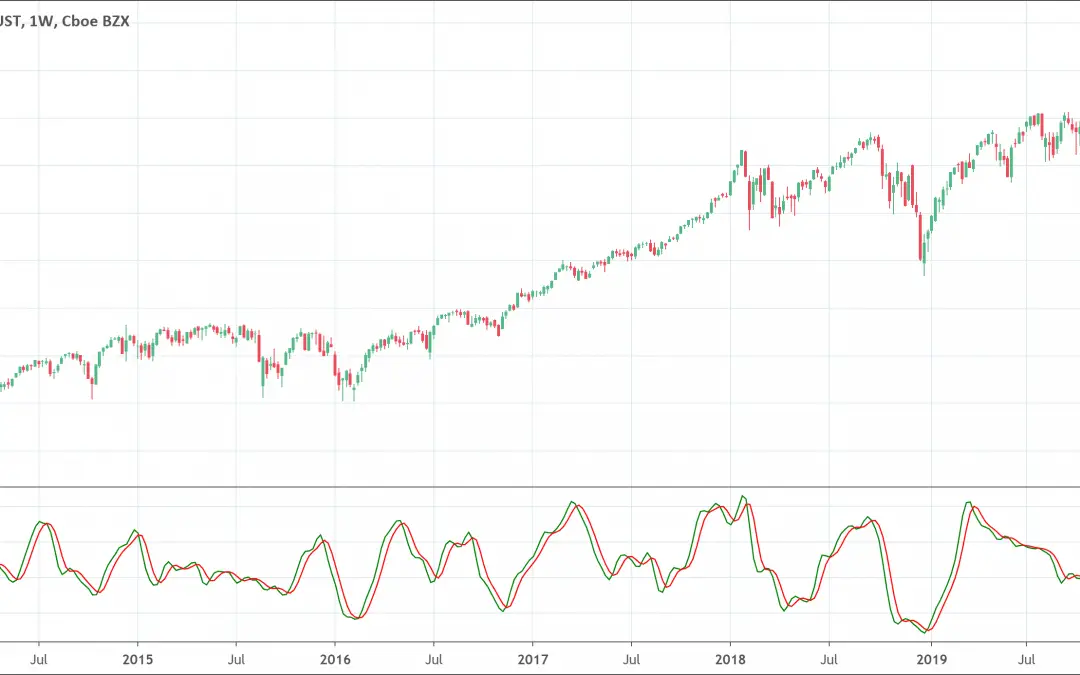
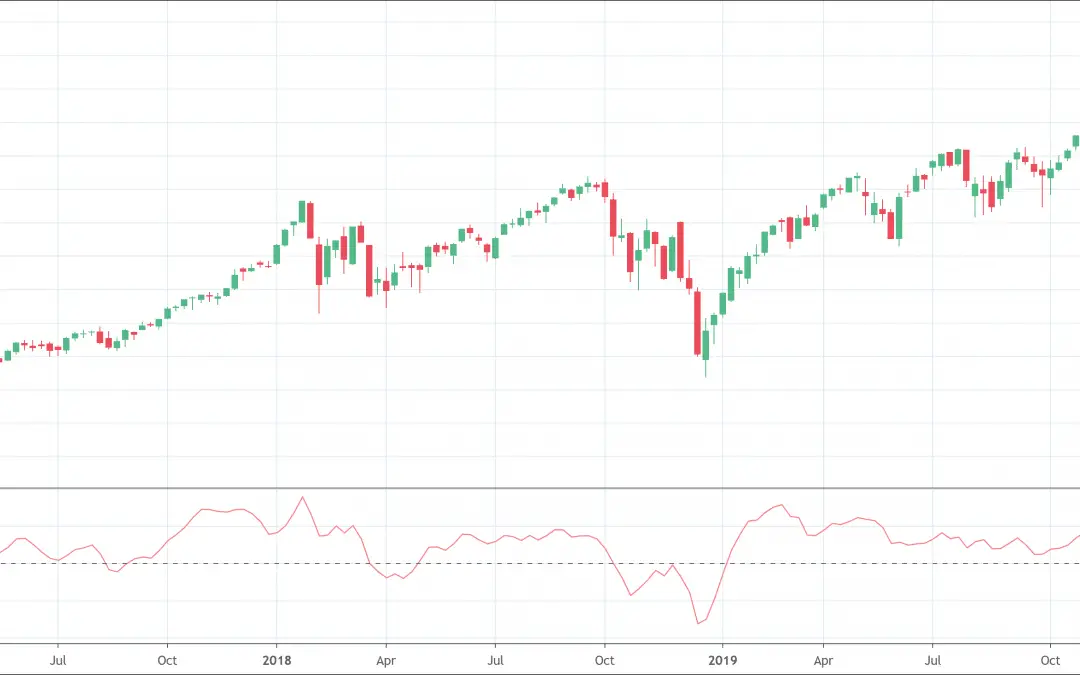
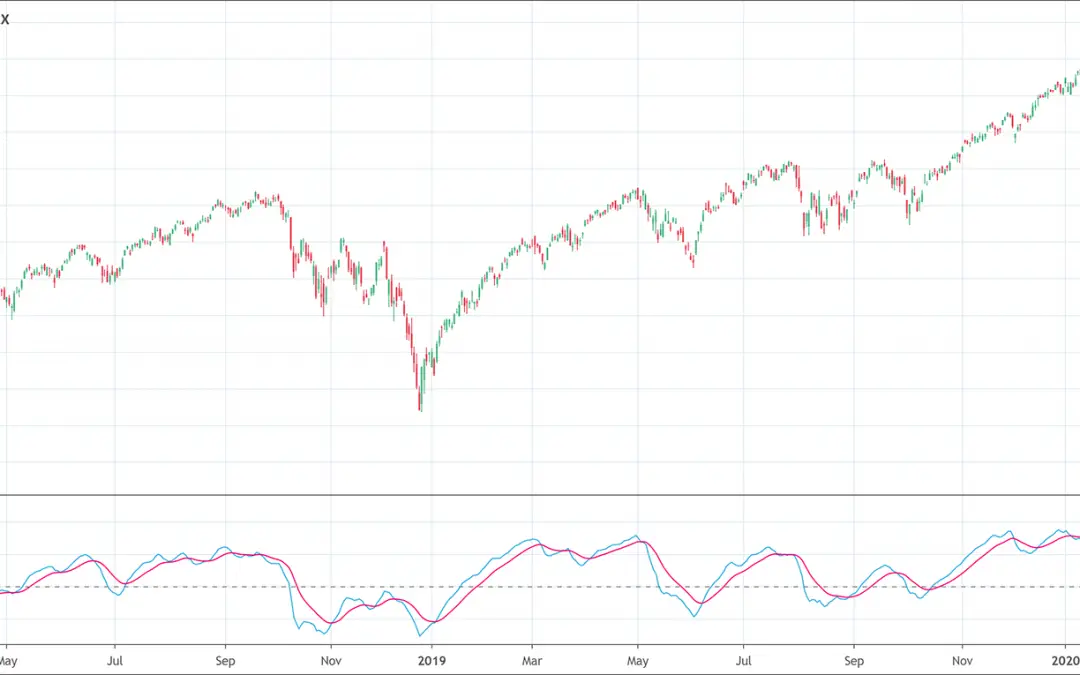
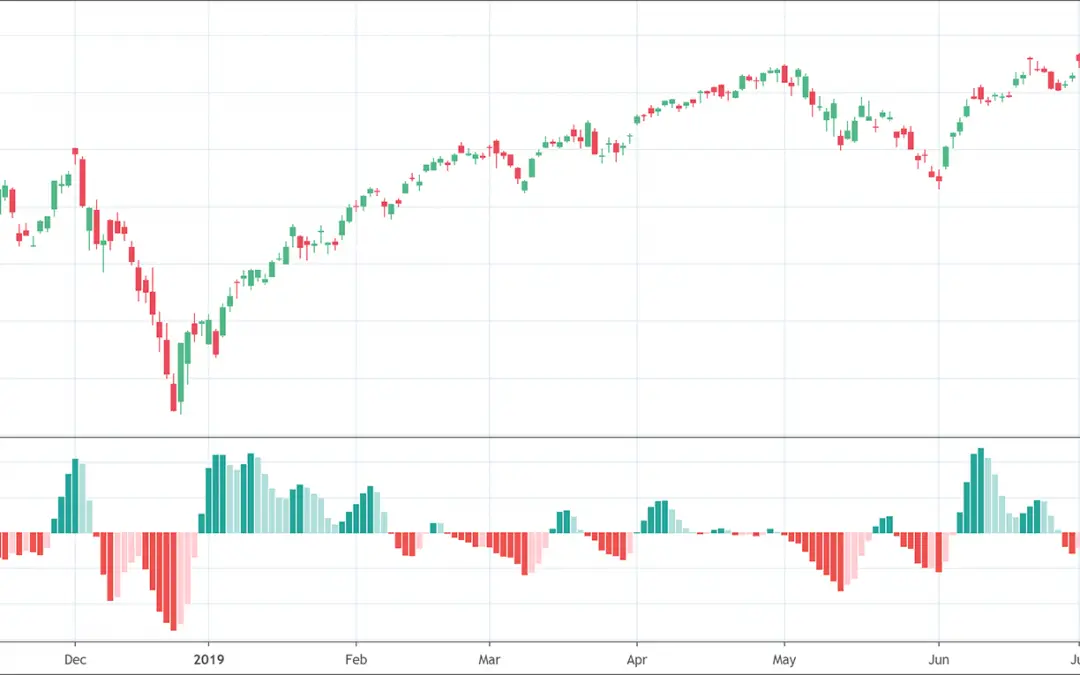
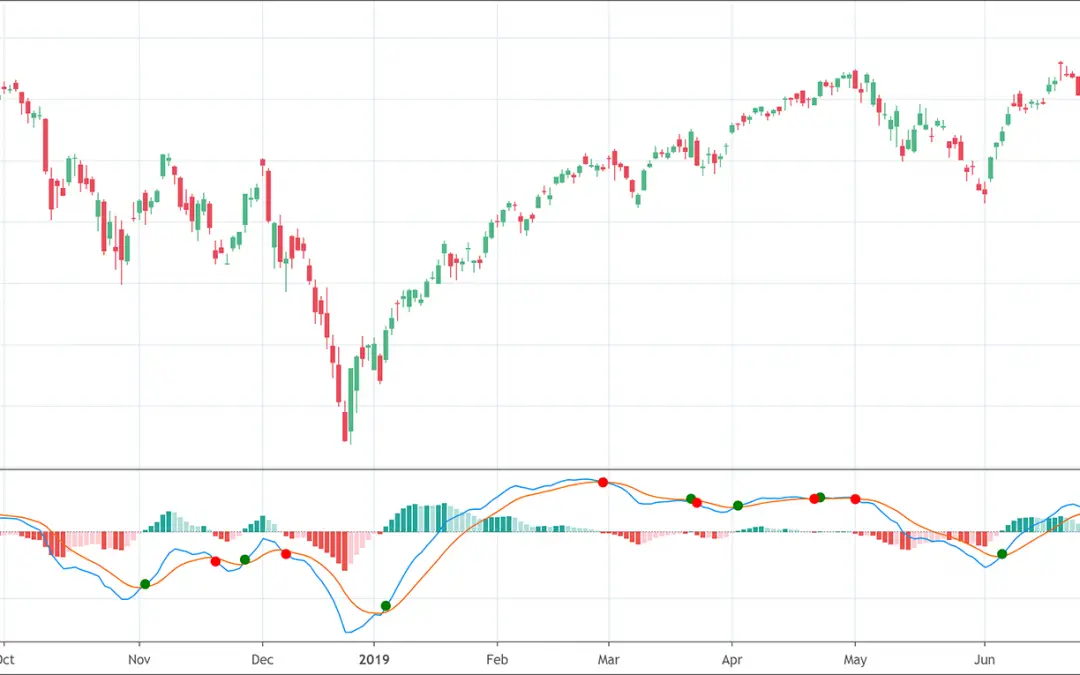
- Moving average convergence/divergence to detect fluctuations in momentum.
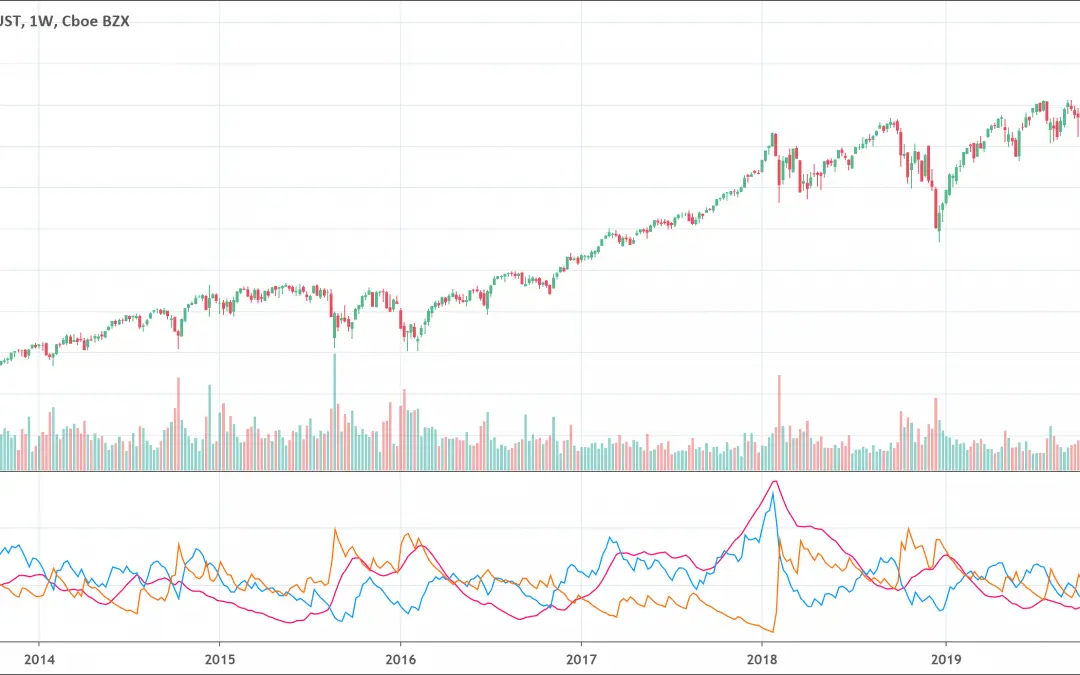
- Average directional index to gauge the strength of the current market trend.
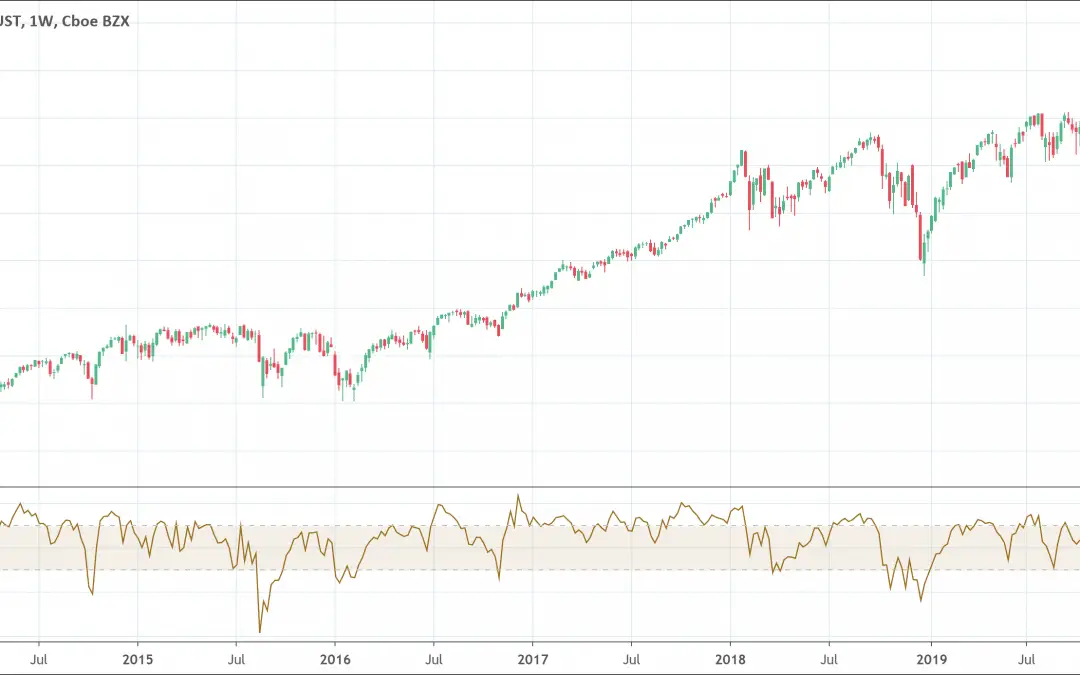
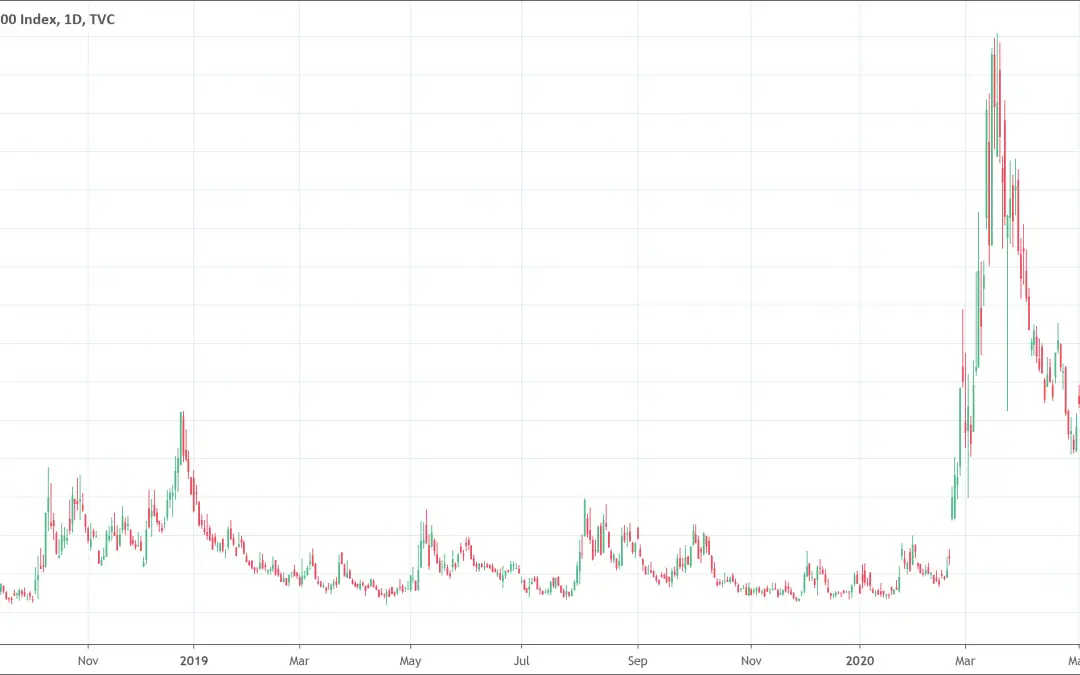
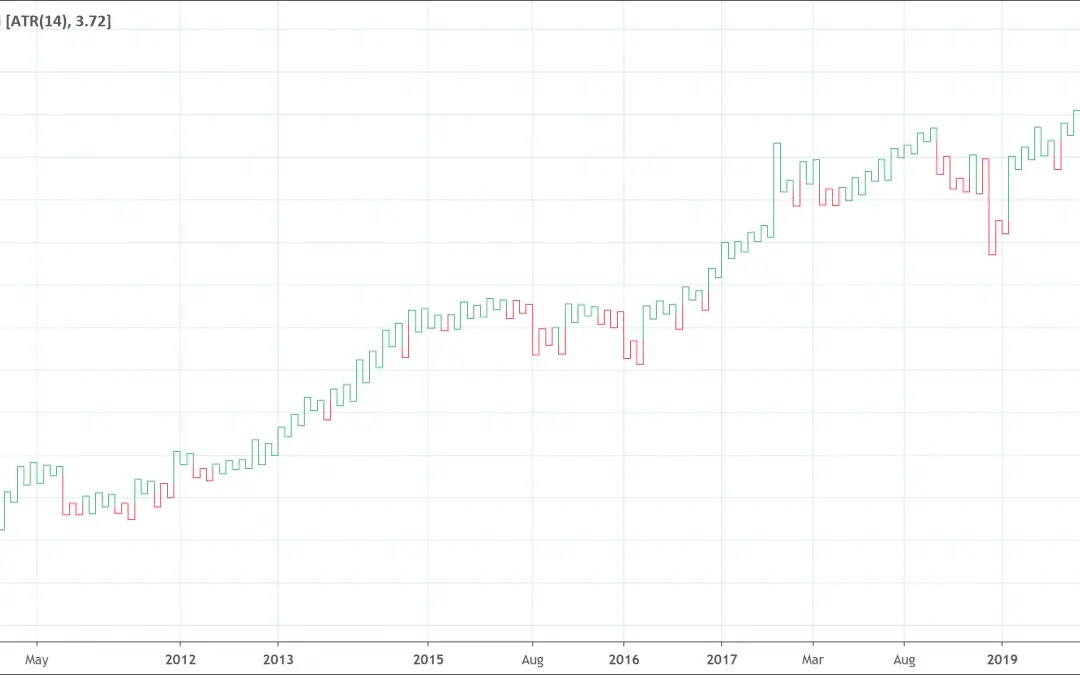
- Standard deviation to measure the magnitude of the price movement.
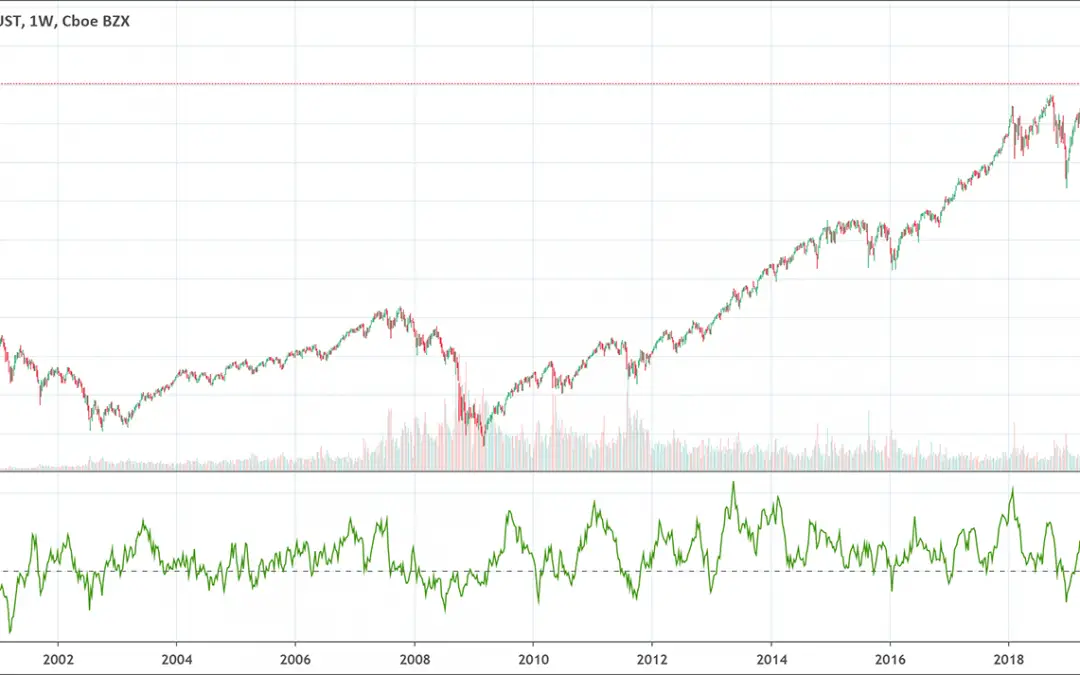
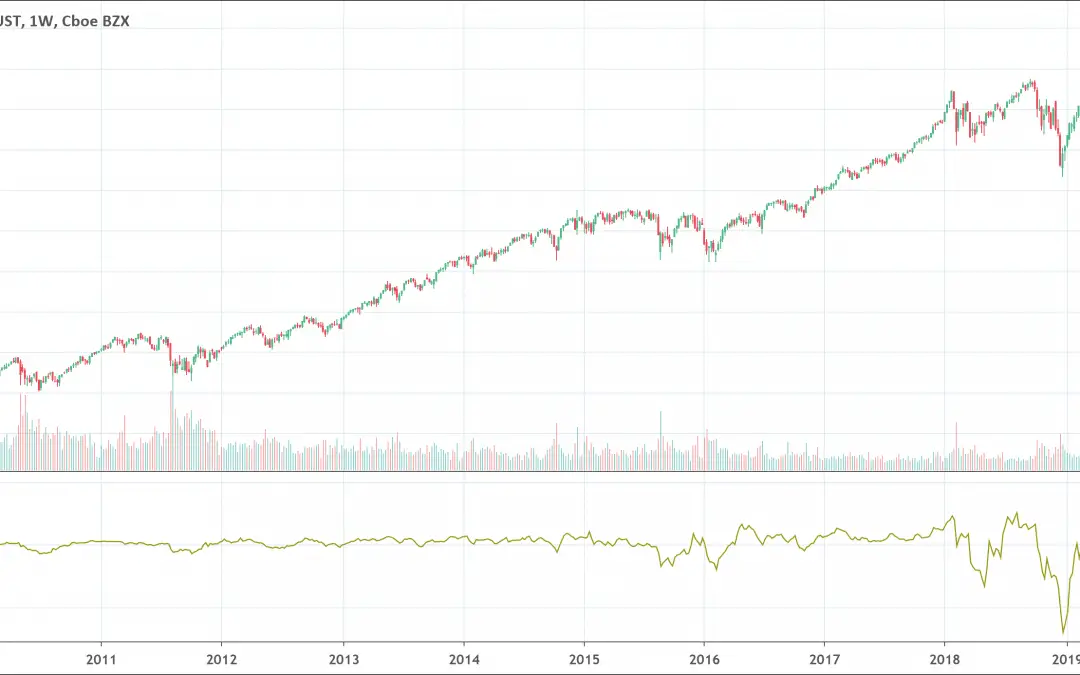
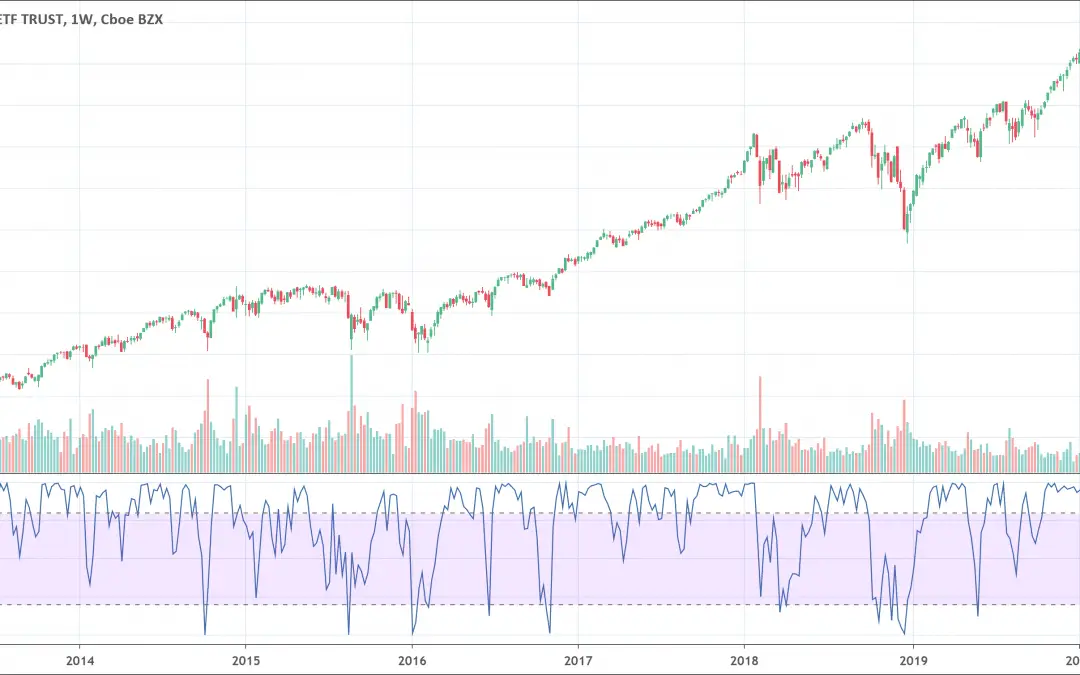
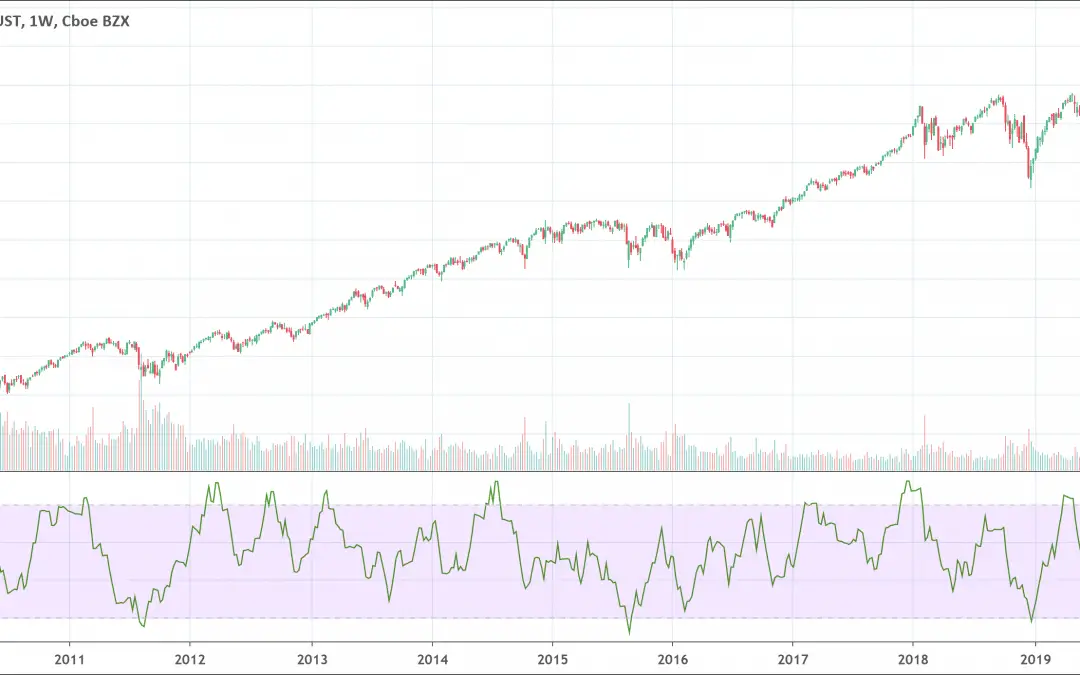
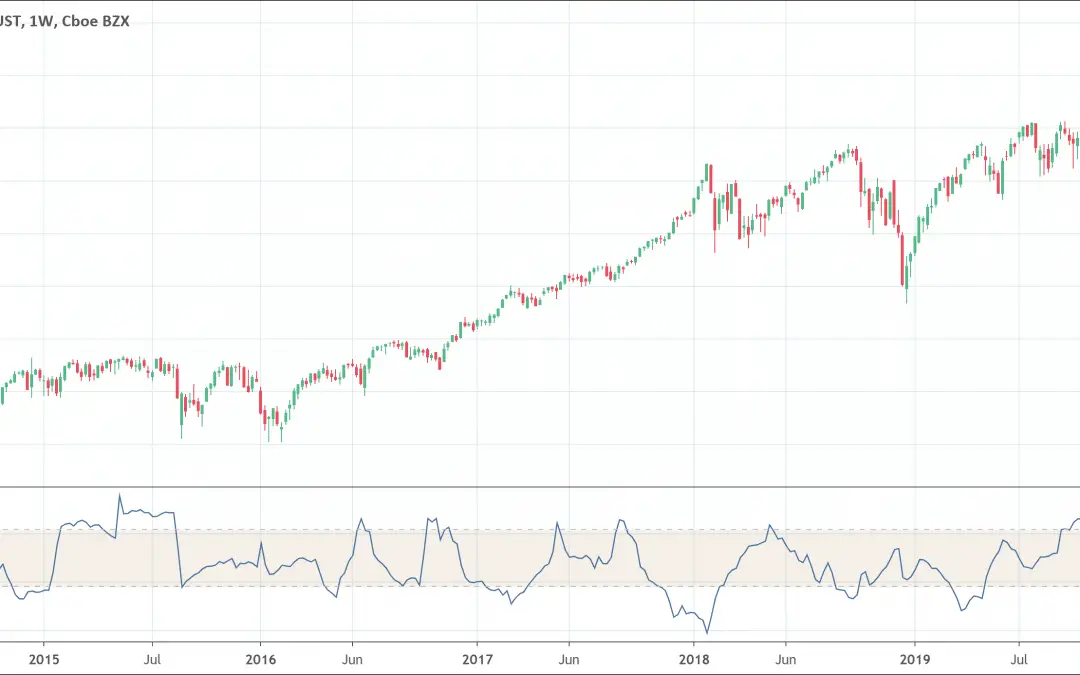
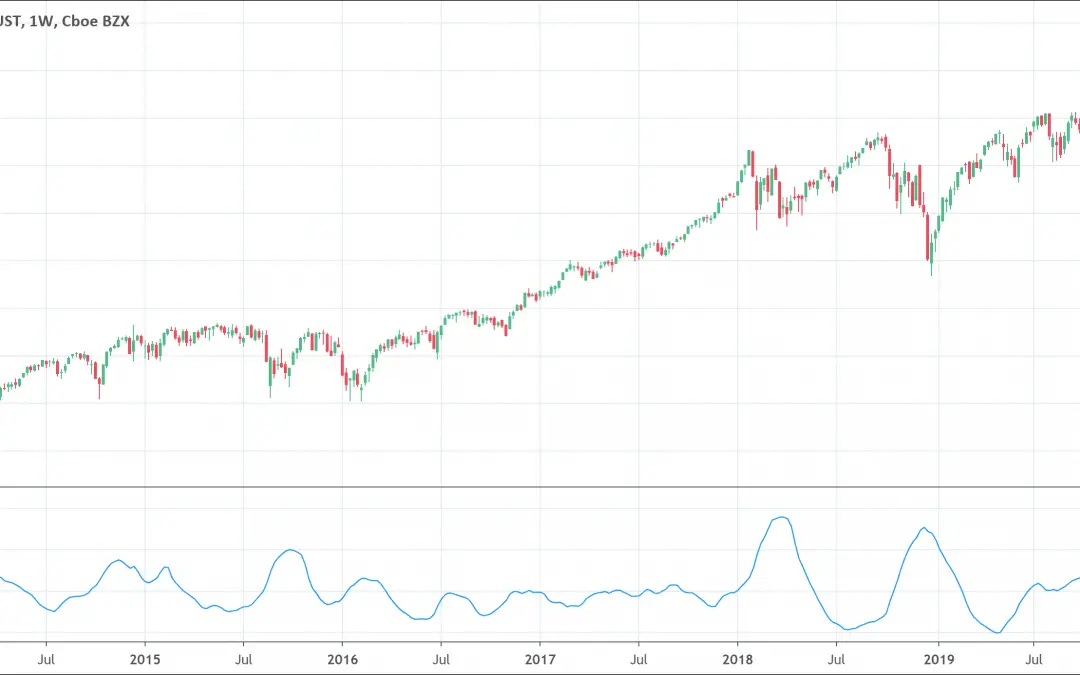
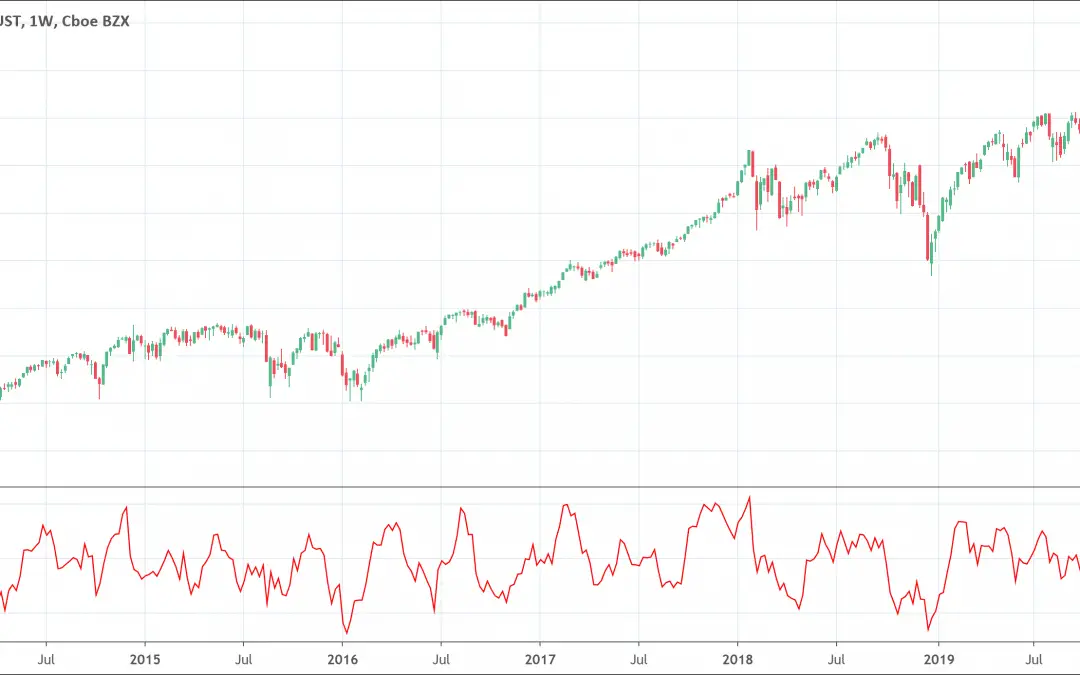
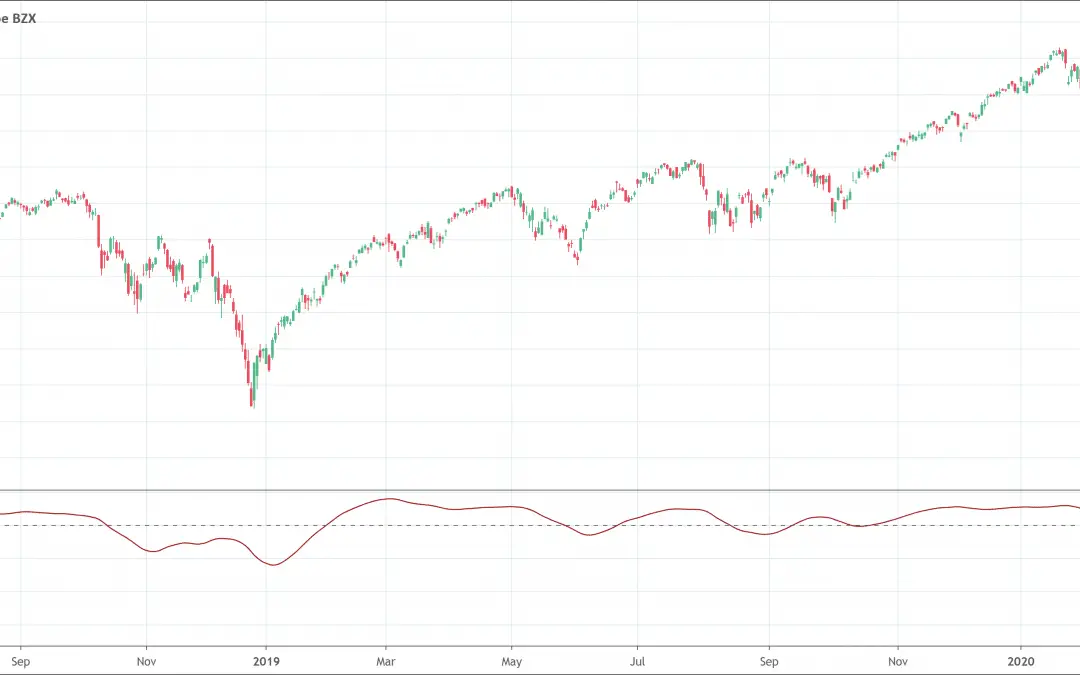
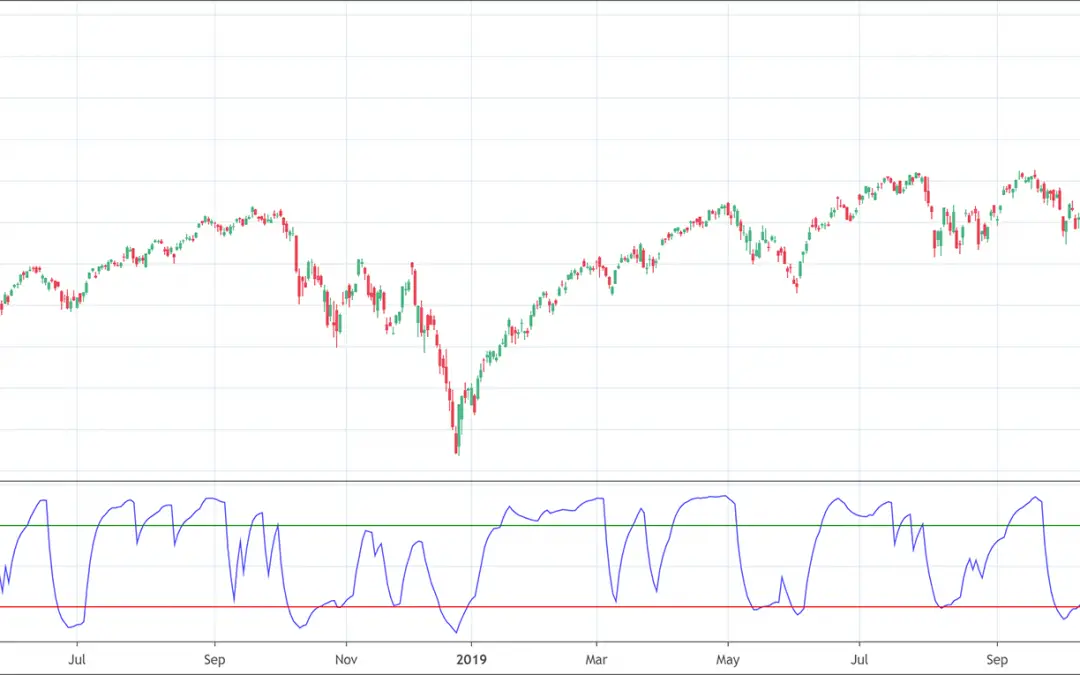
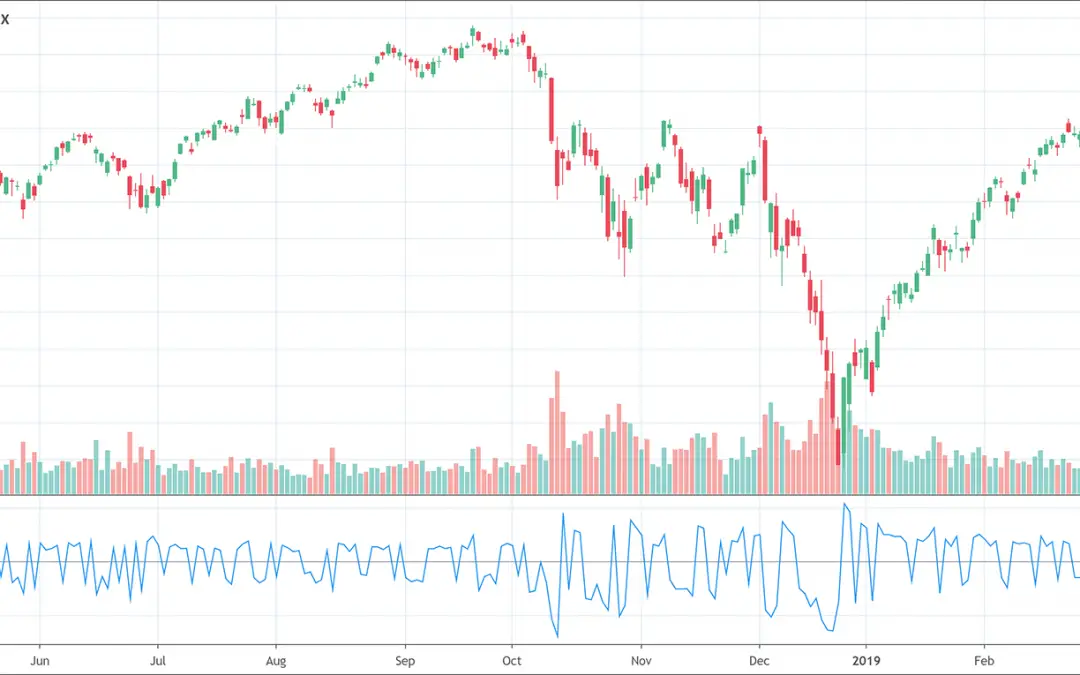
- Relative strength index to identify momentum and market conditions.
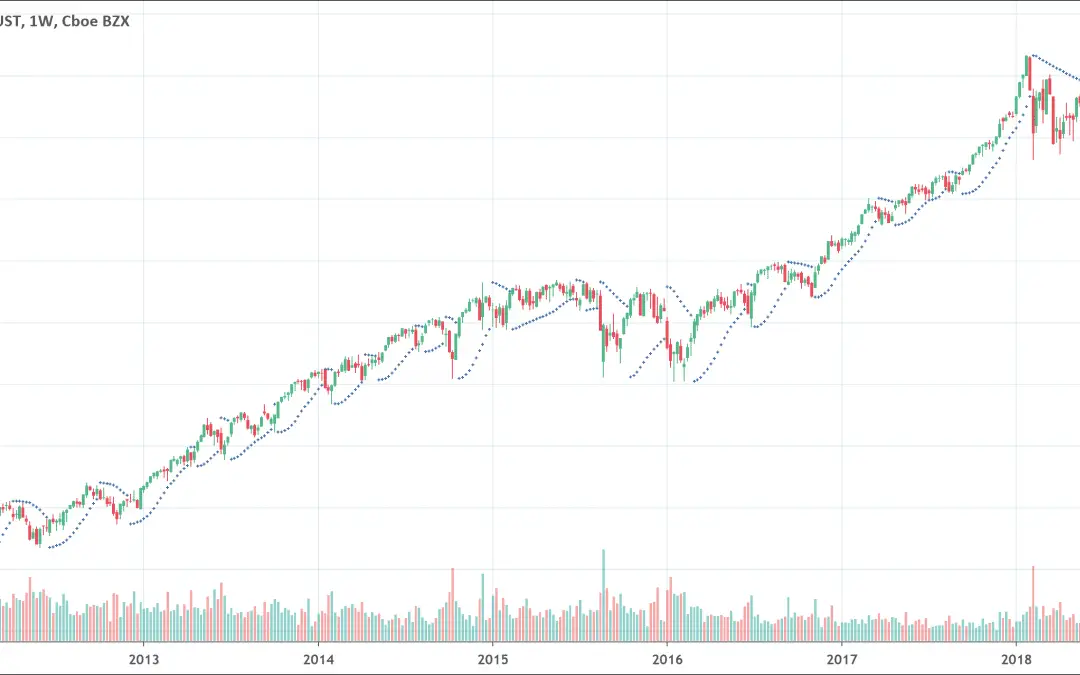
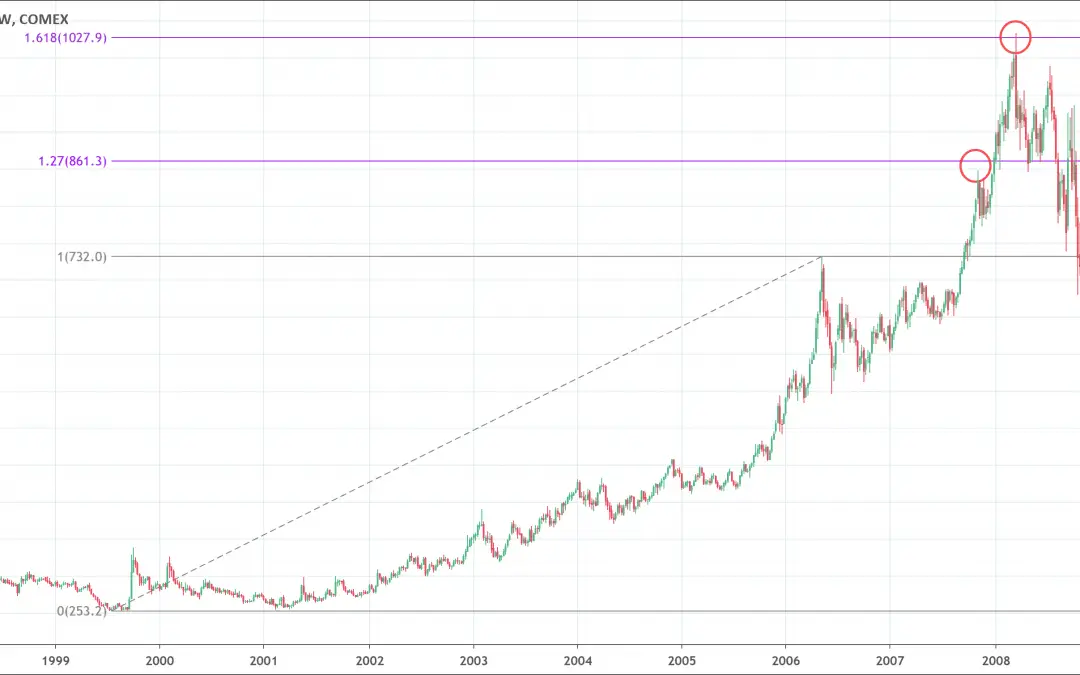
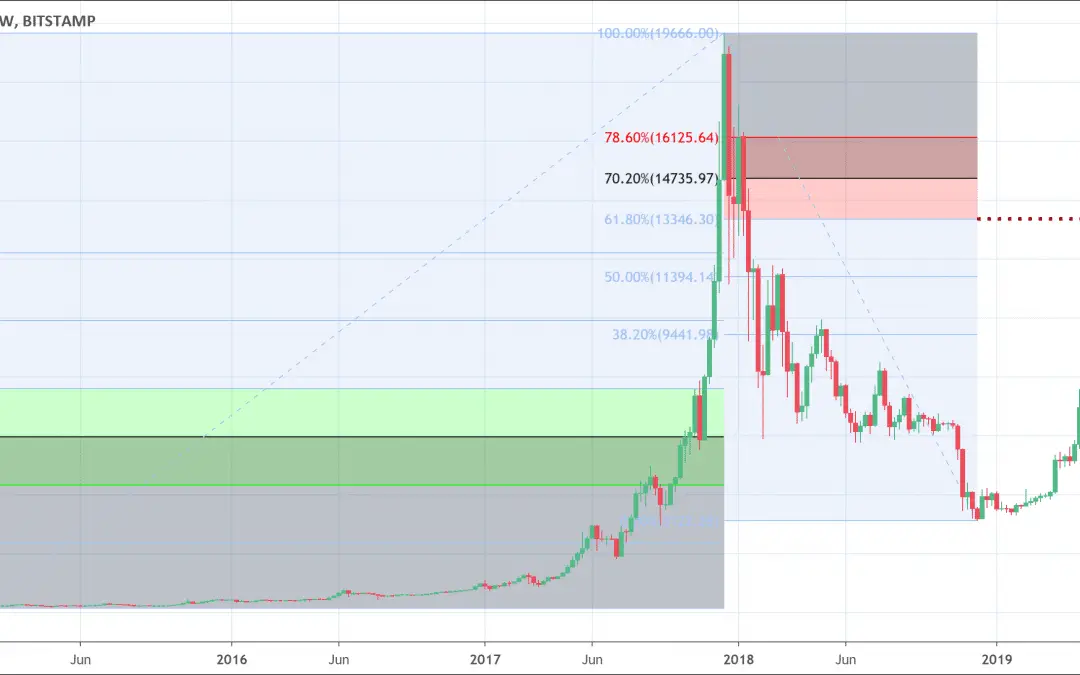
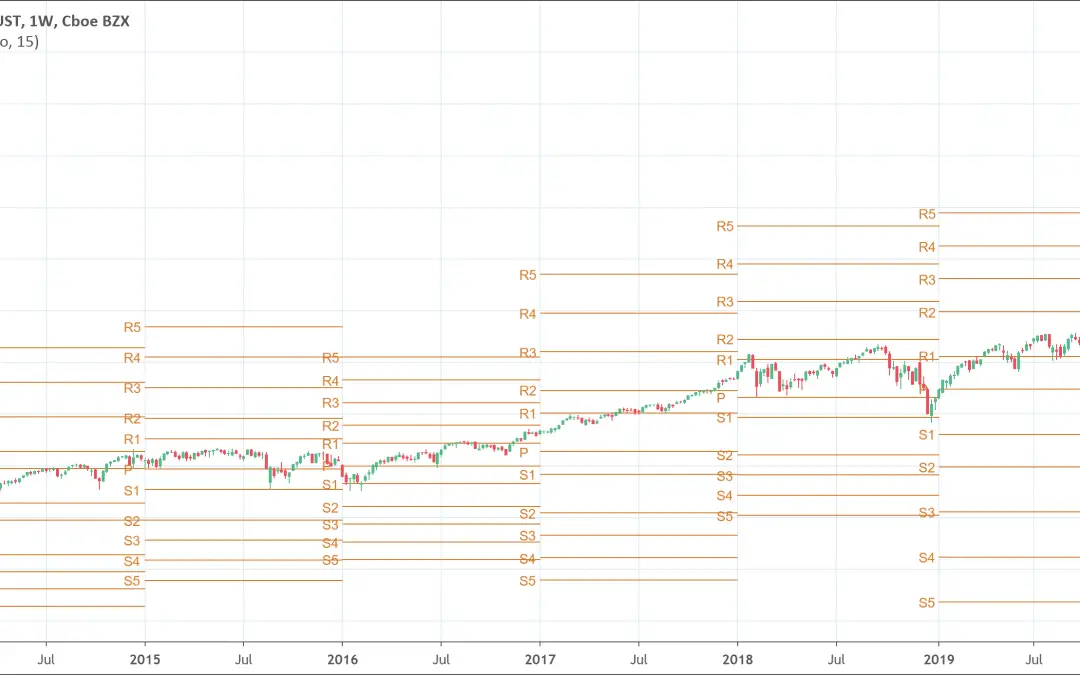
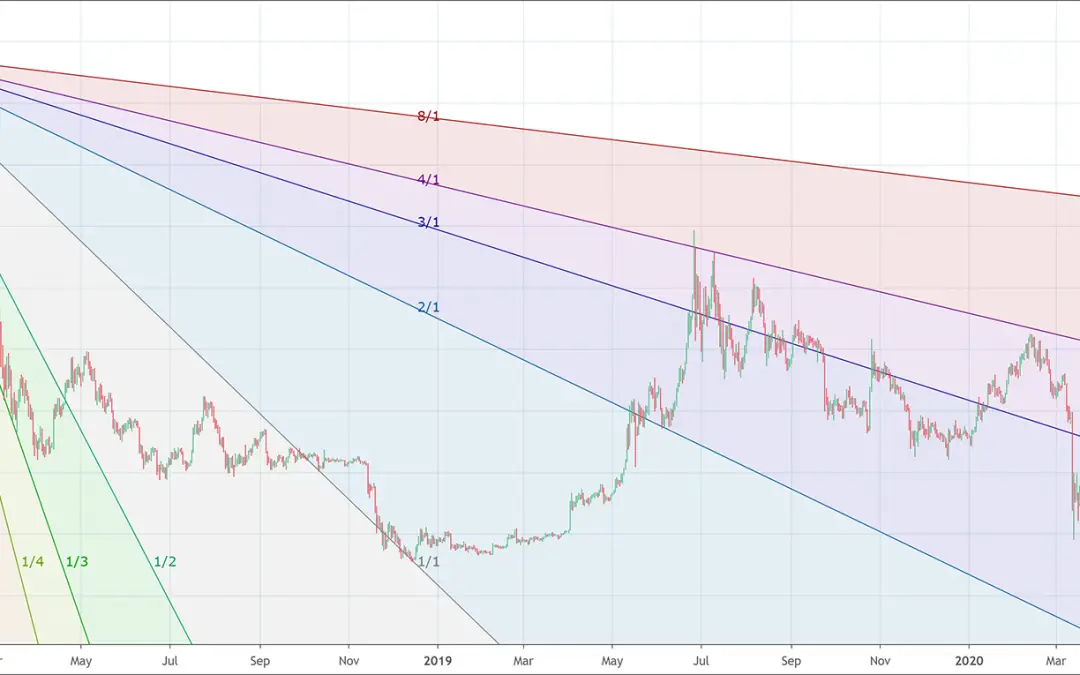
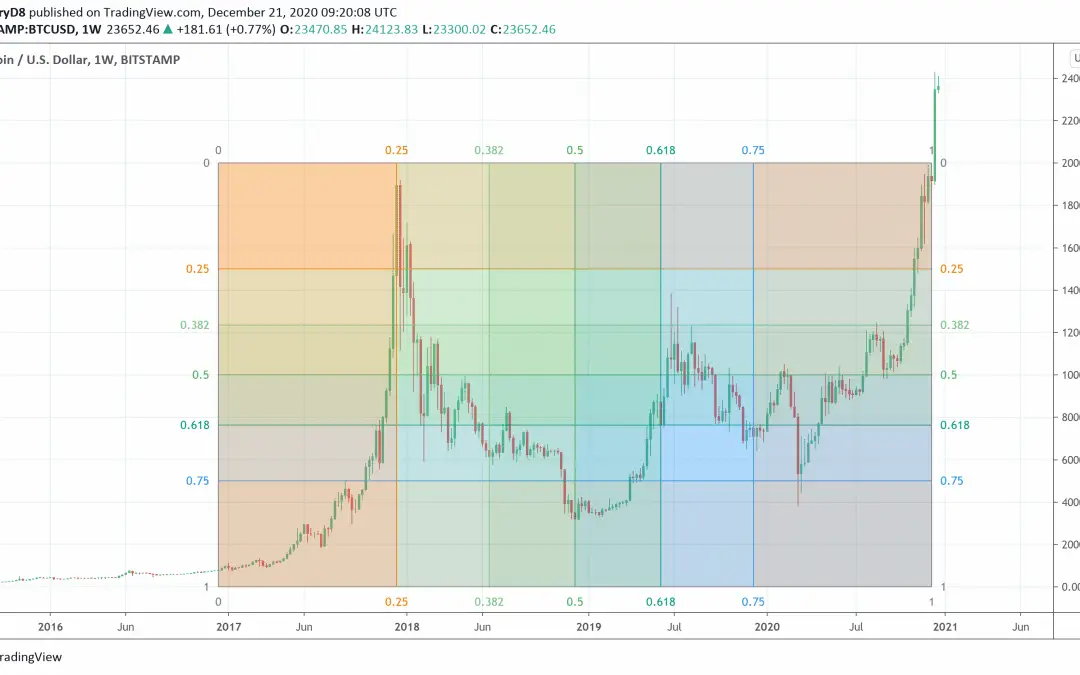
- Fibonacci retracement to determine how much a market will deviate from its current trend.
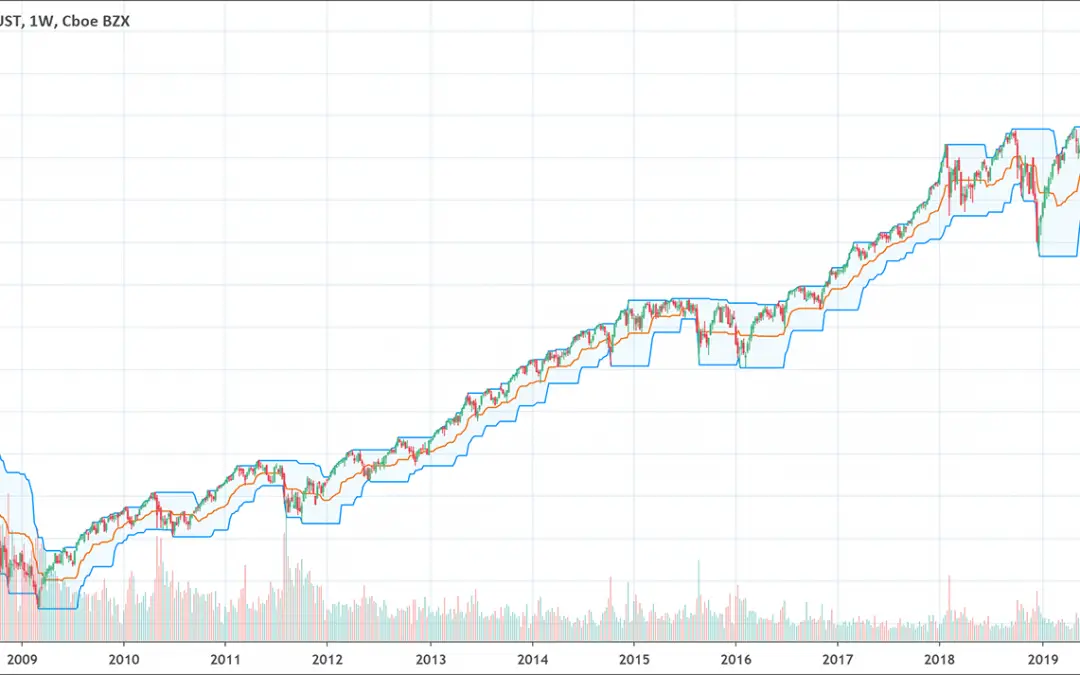
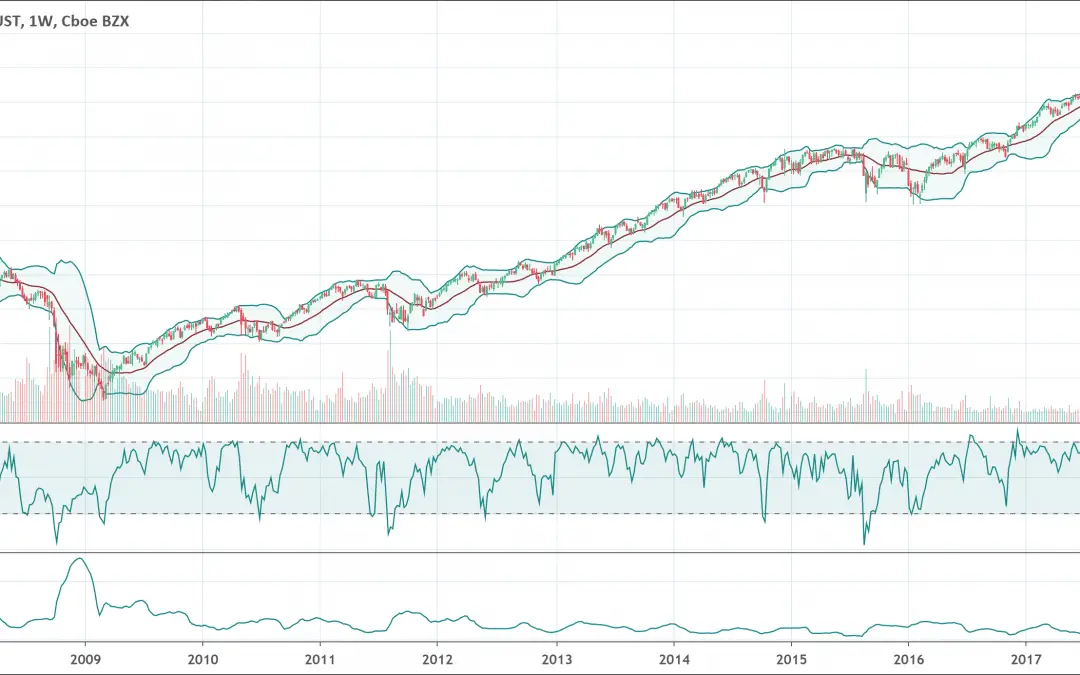
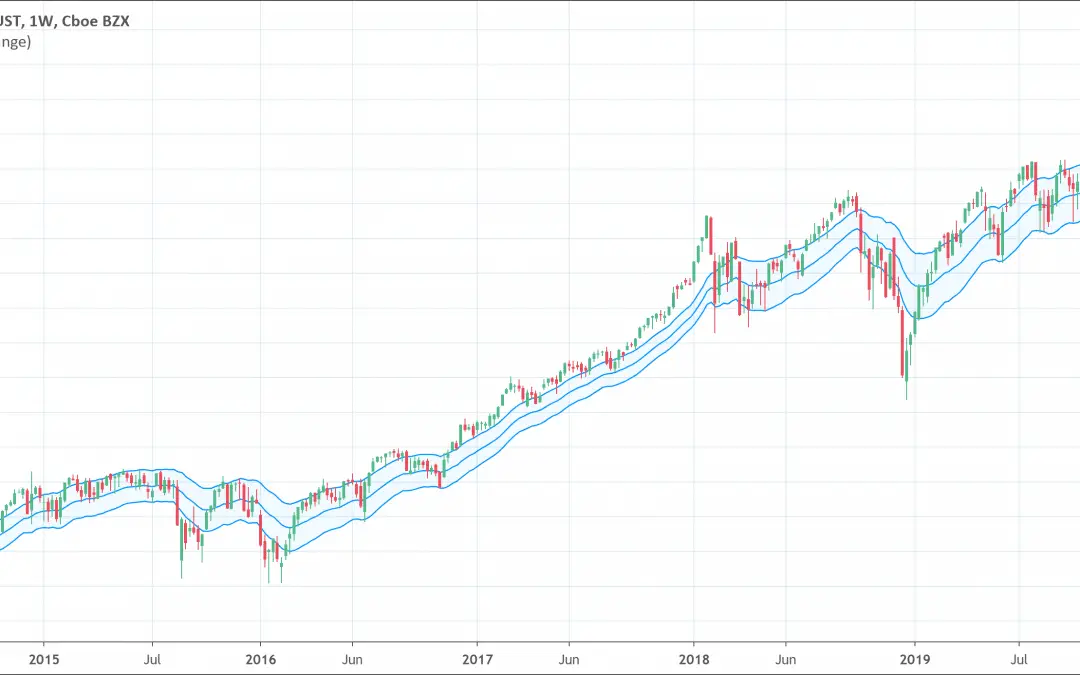
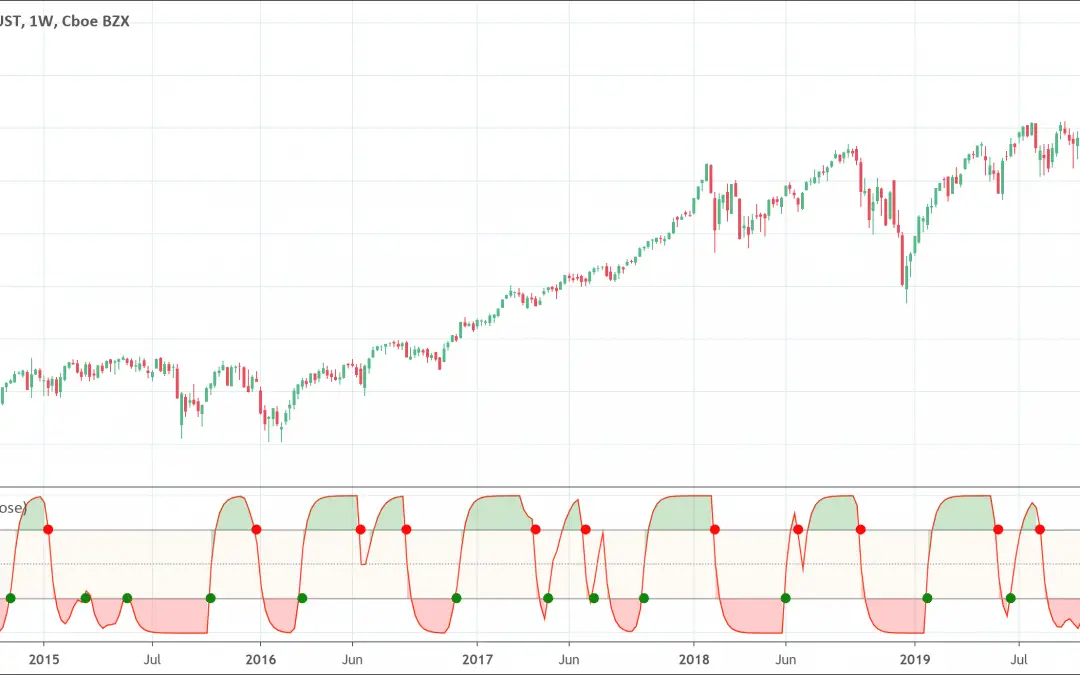
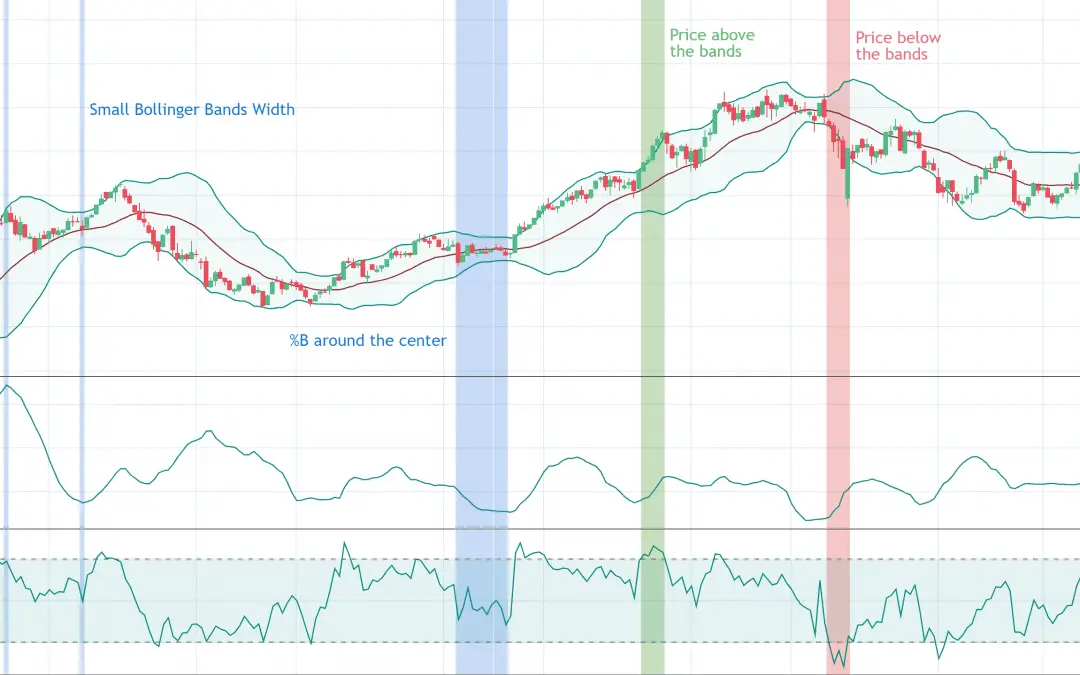
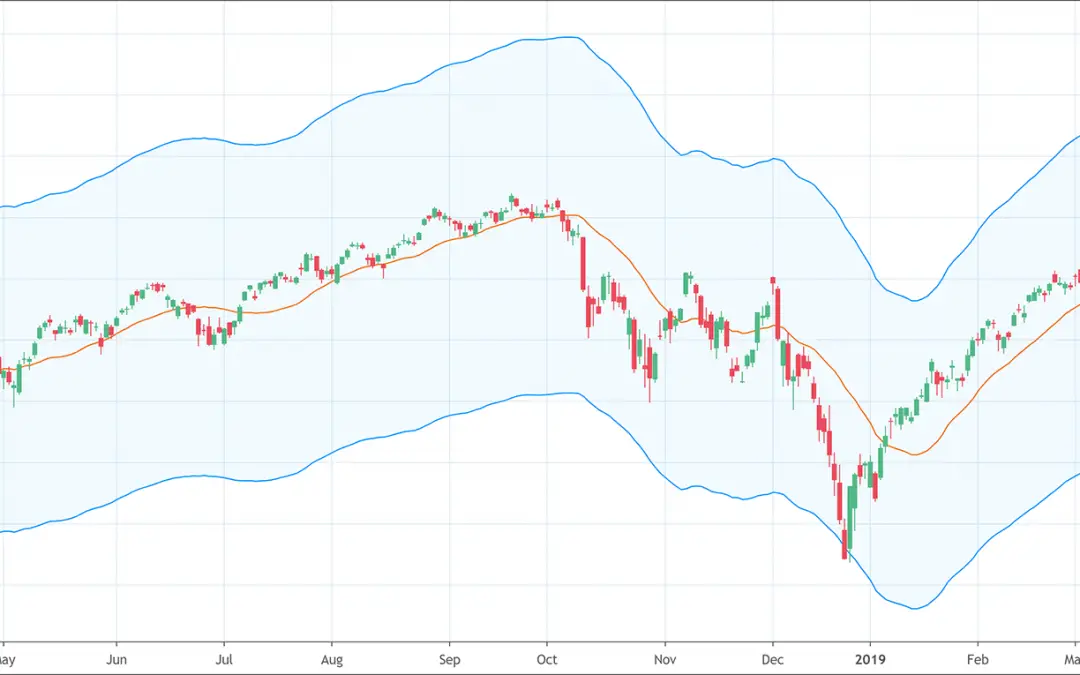
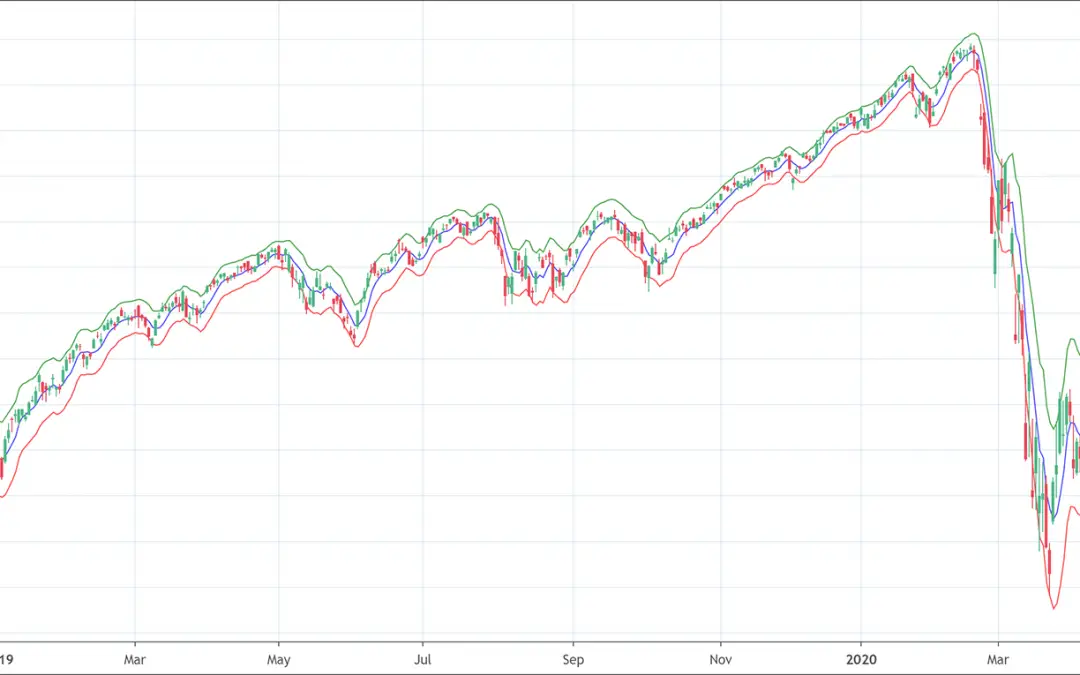
- Bollinger bands to predict long-term price movements.
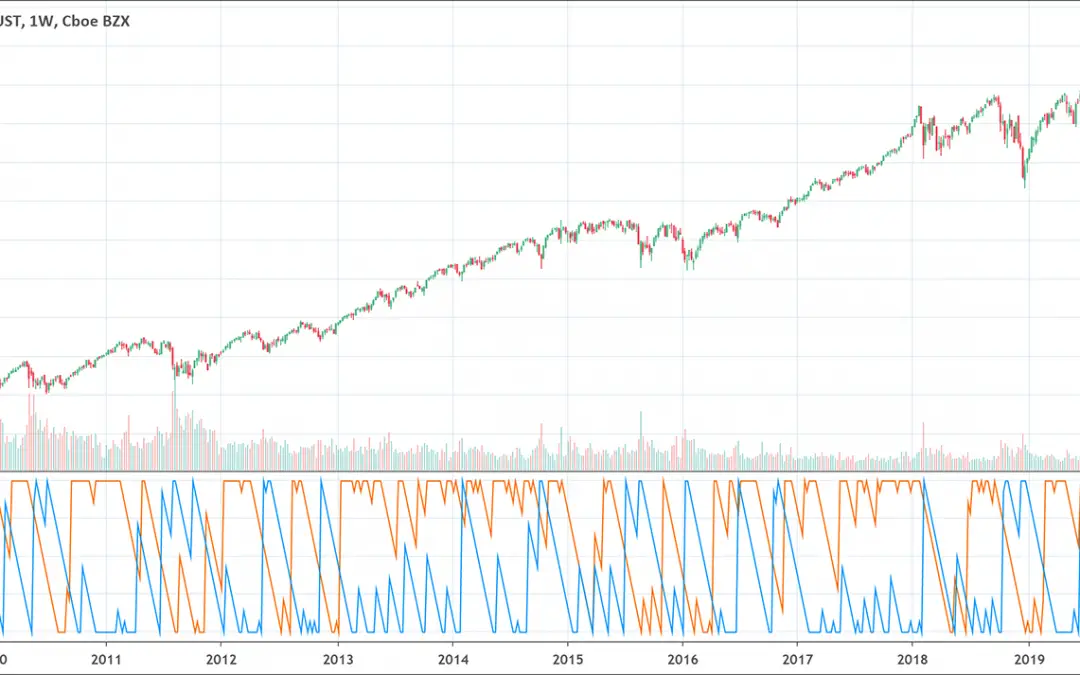
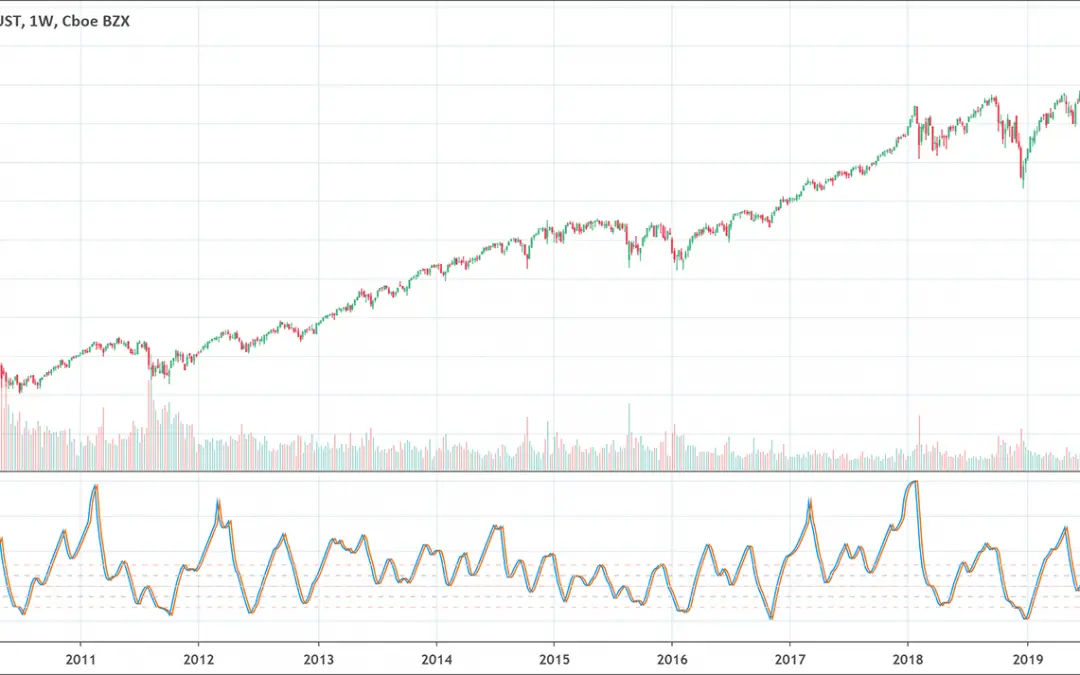
- Stochastic oscillator to determine momentum and trend strength.
Types of technical analysis
There are two main types of technical analysis.
- Top-down approach: A top-down technical analysis approach involves analyzing the market from a broader to a specific viewpoint. Technical analysts continue to observe most specific charts to find out stocks that seem great investments. They also analyze moving averages of stocks and securities in more general to specific timeframes. For example, they start with weekly moving averages and proceed towards daily or hourly averages.
- Bottom-up approach: A bottom-up technical analysis approach involves finding out stocks that are undervalued and observe them on a more fundamental basis. It helps to find a point of entry where stock seems as it is bottomed out. In fact, this approach is all about stocks that disregard the overall trend in the market. It pinpoints the best entry or exit points that put them in the best positions to make significant profits.
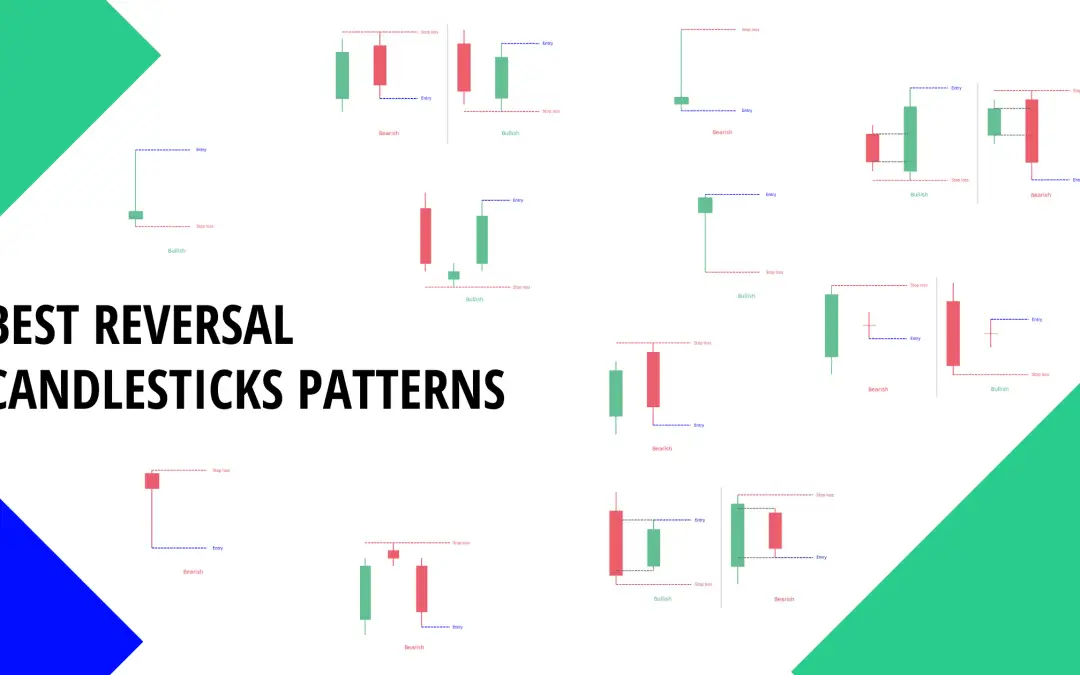
The accepted purpose and reason for existence of technical analysis is to predict trends and signs of trend reversal. This is a question of determining market conditions (significant numbers and/or signals given by mathematical tools) that statistically produce the same results.
Technical analysis does not pretend to be an accurate science. It is closer to human science, because its research object is directly focused on the understanding of market psychology.
Basic principles of technical analysis
There are the following three basic principles of technical analysis.
- Stock prices reflect almost everything: Technical analysis works on the principle that stock prices reveal almost everything. Management decisions, strategic decisions, buybacks, dividends, good results, bad results, or anything upcoming is the things reflected by stock prices. TA emphasizes the importance of analyzing how the financial markets react to any news. Technical analysts don’t even try to dig into the news itself. They only try to figure out how it will affect the stock prices.
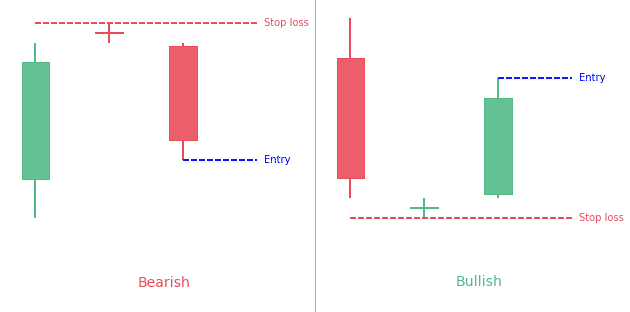
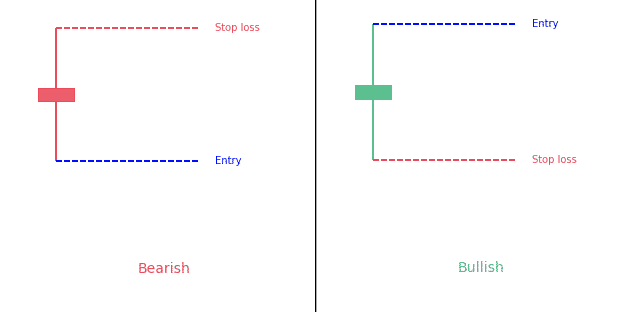
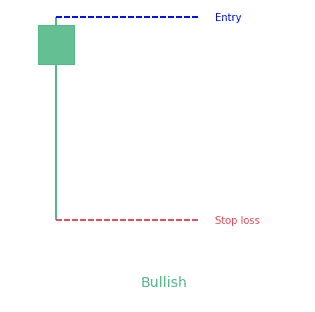
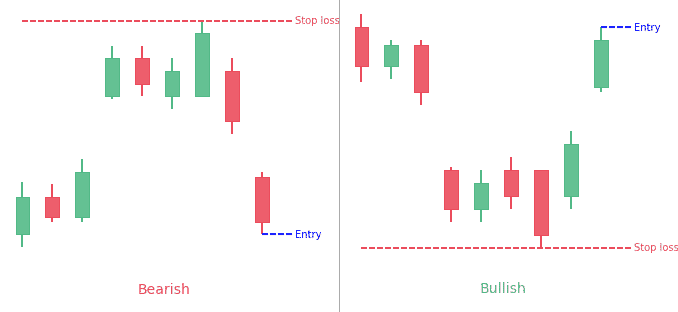
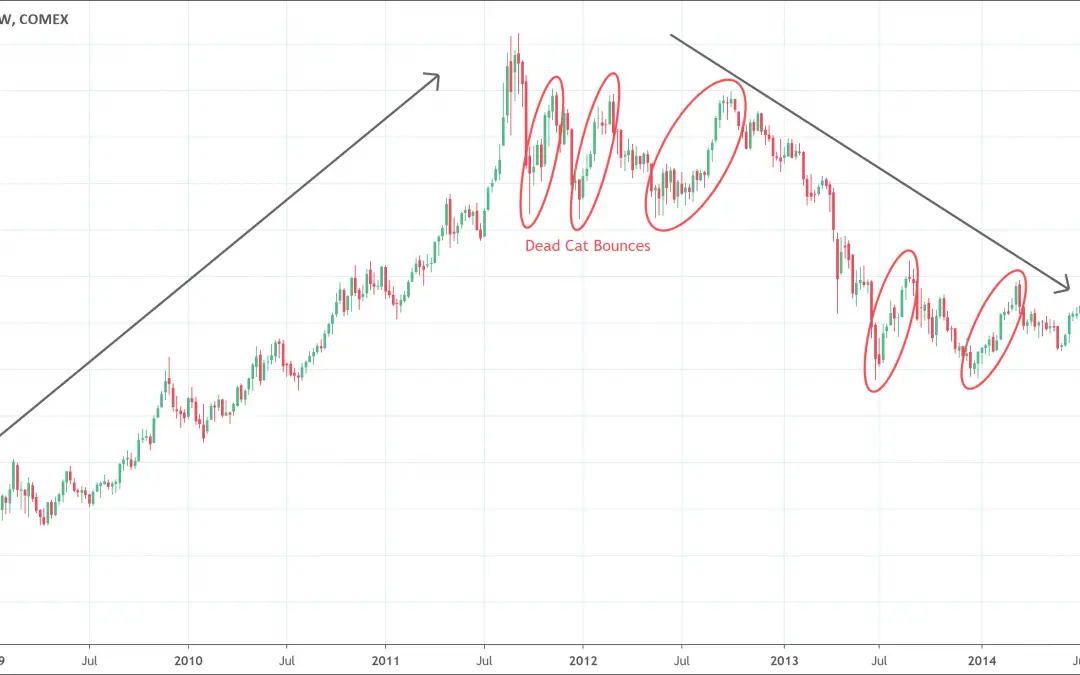
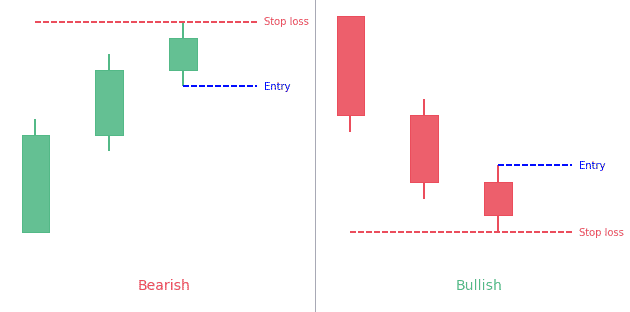
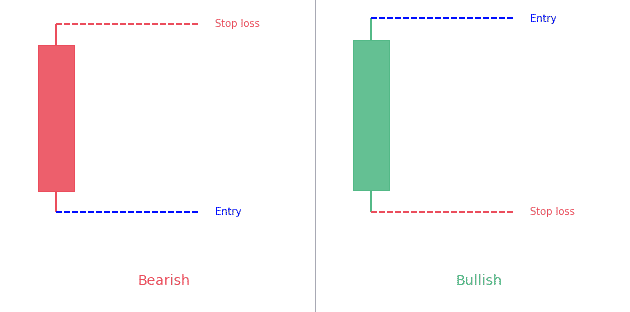
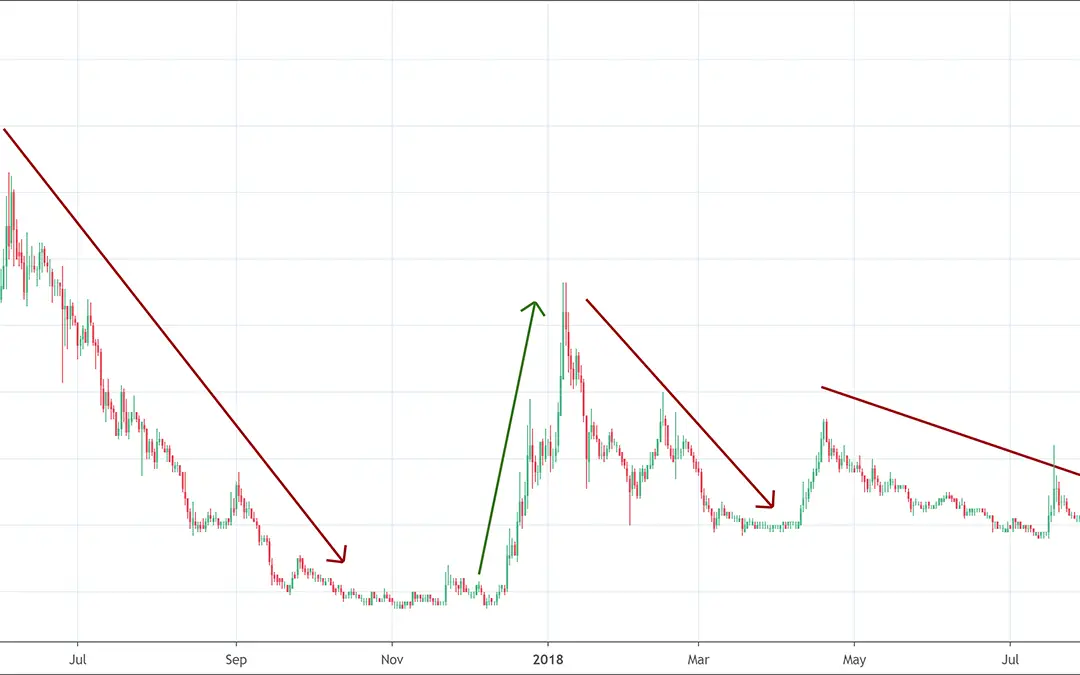
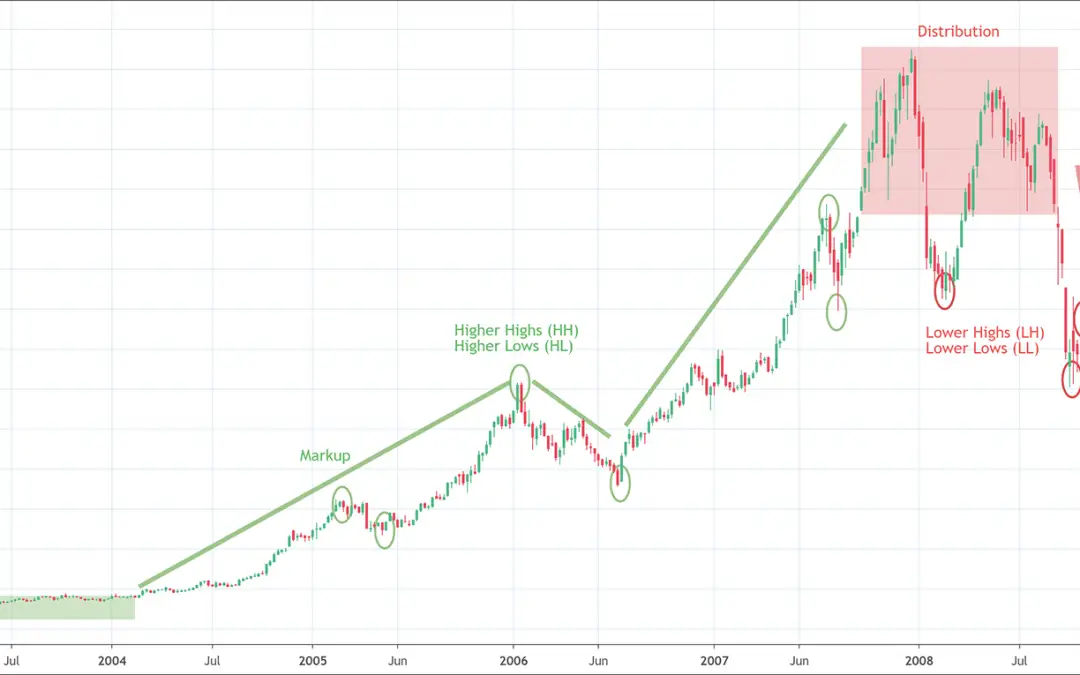
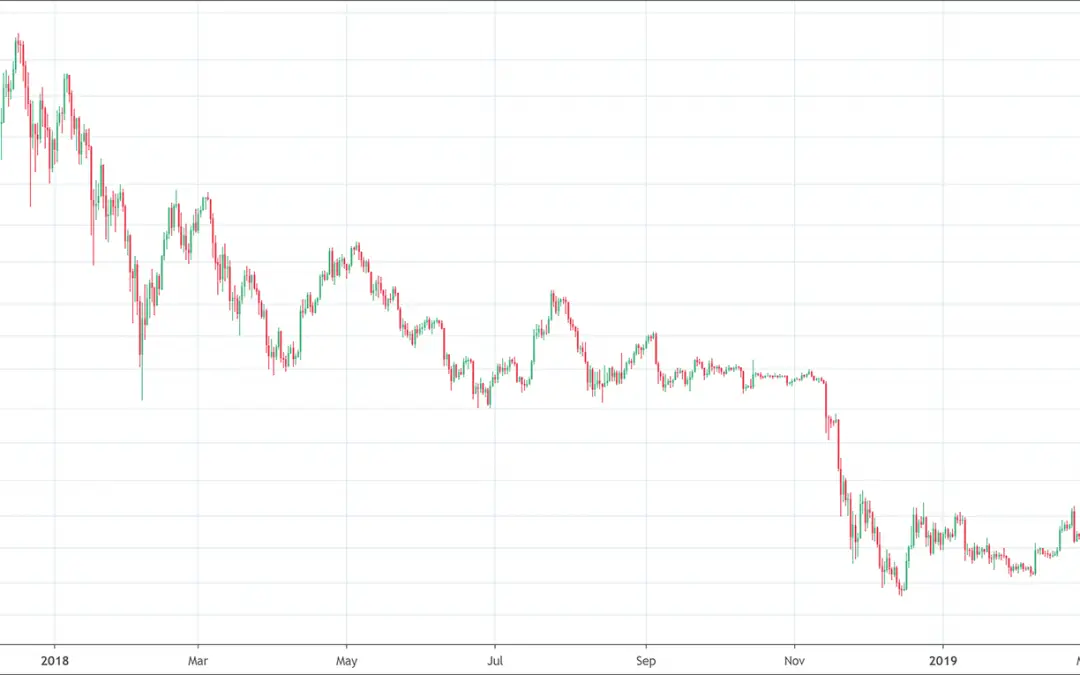
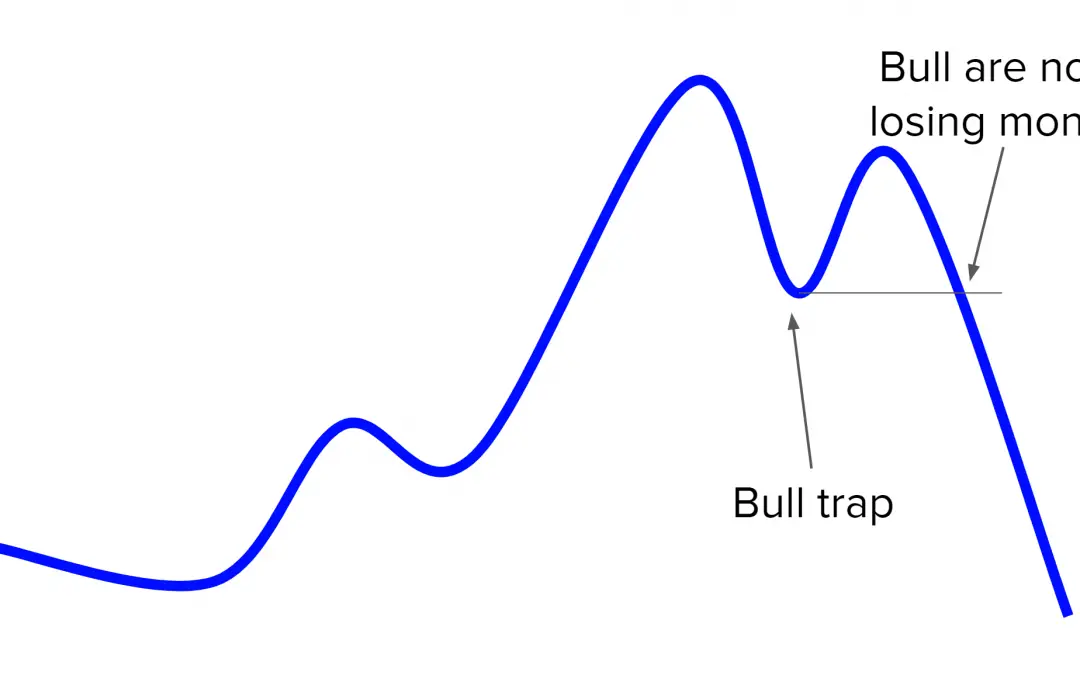
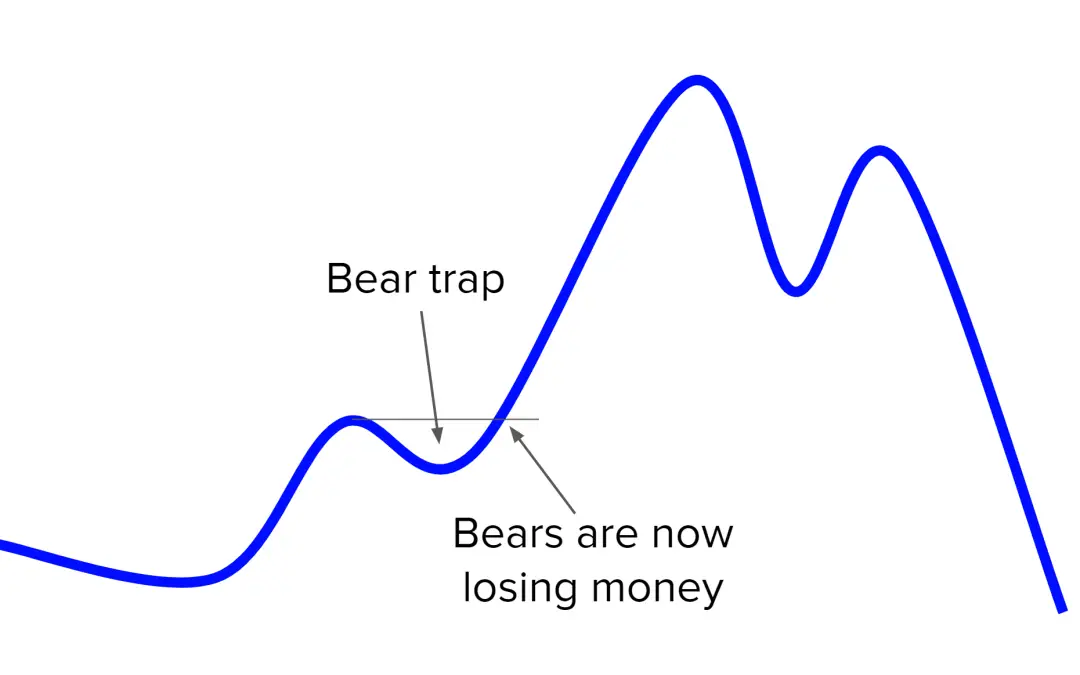
- Stock price movements are always in trends: TA also believes that stock prices always follow a trend and they continue to do so unless a reversal signal appears. For example, a bearish trend will continue until a reversal pattern appears indicating an upcoming bullish trend in the market.
- Repetition of trends: TA also believes that trends in the financial markets repeat. As the saying goes, “history repeats itself” financial market trends also repeat themselves. As we all know that certain chains of events often happen on a regular basis in the markets. Patterns forming with those events recur again when those events repeat themselves.
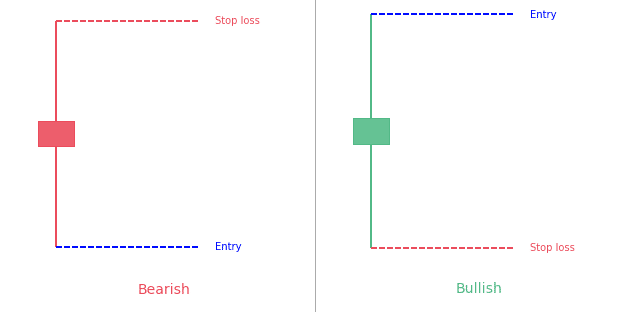
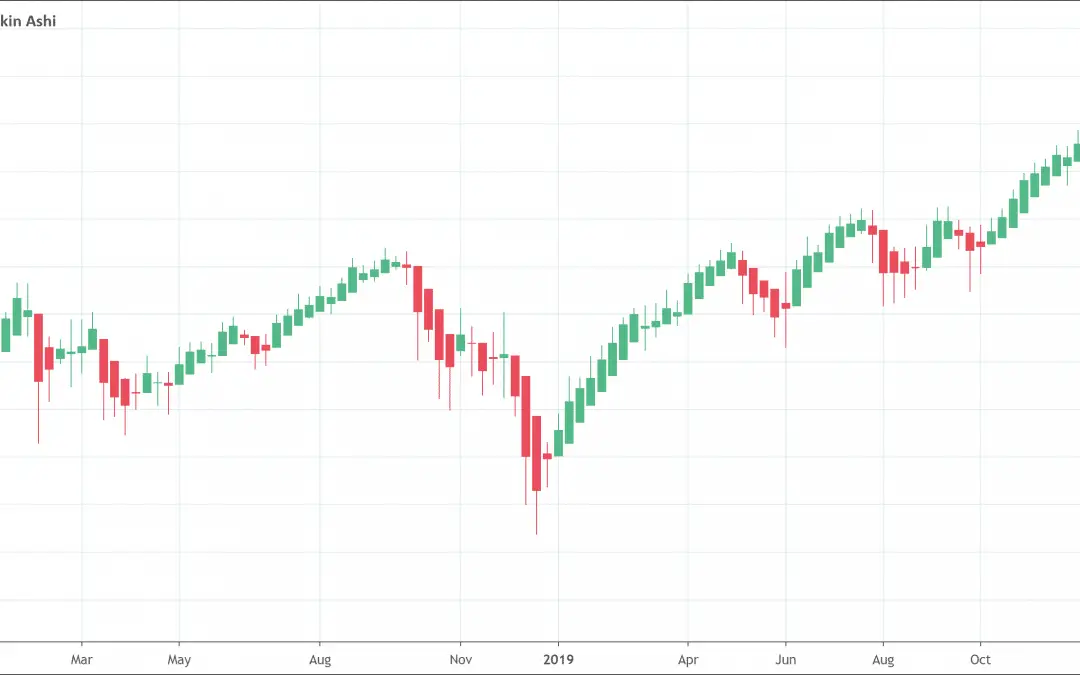
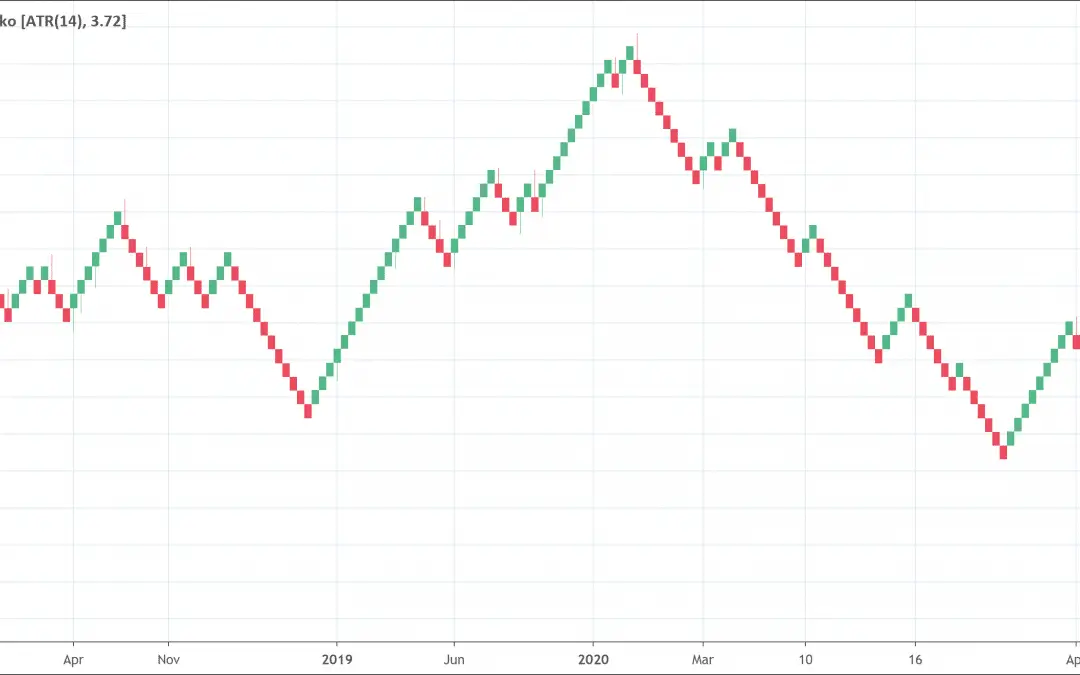
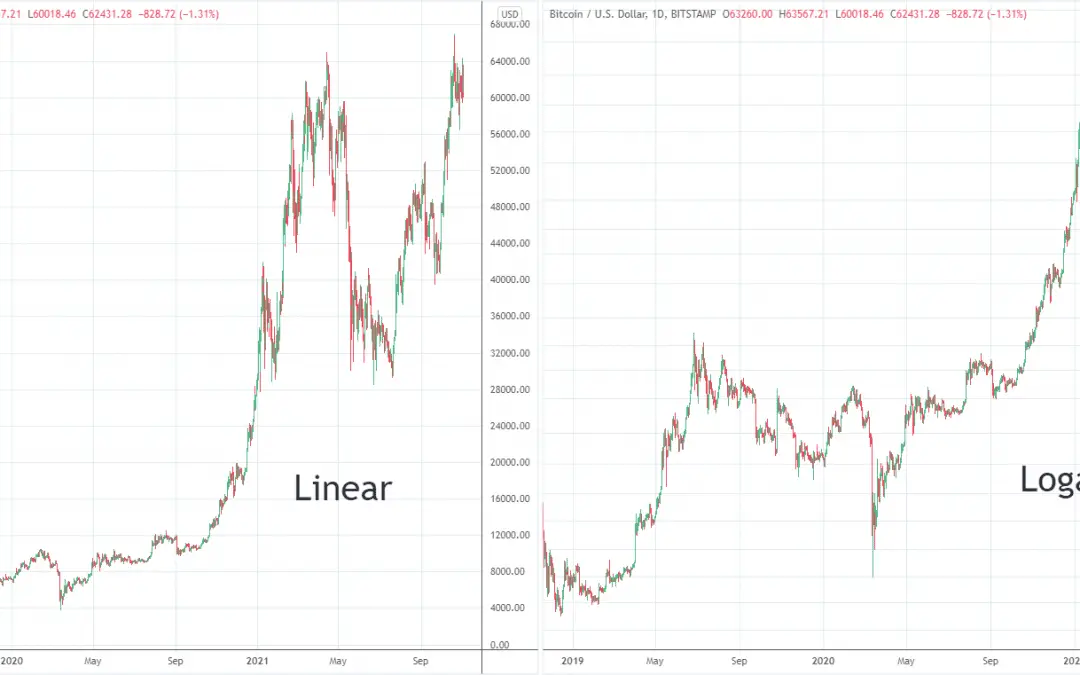
Technical analysis was first used by the Japanese around the 17th century for the rice market. They introduced a specific way to draw the price: the Japanese candlesticks. It helped them aggregate the price for a given period.
Basics of technical analysis
Technical analysis focuses on the following basic factors.
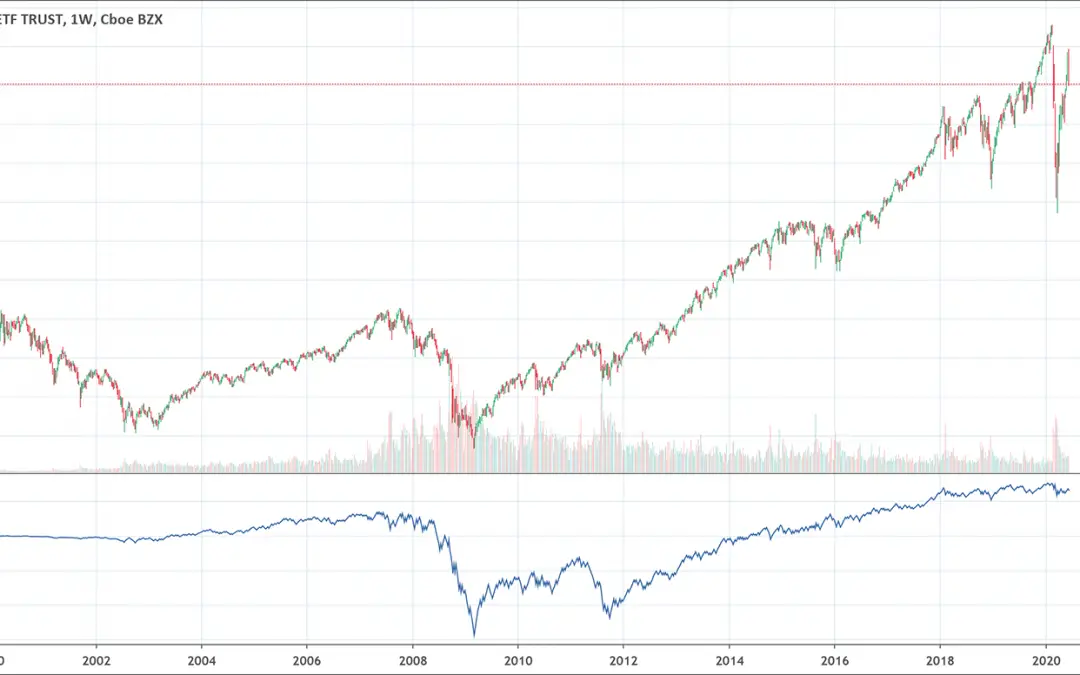
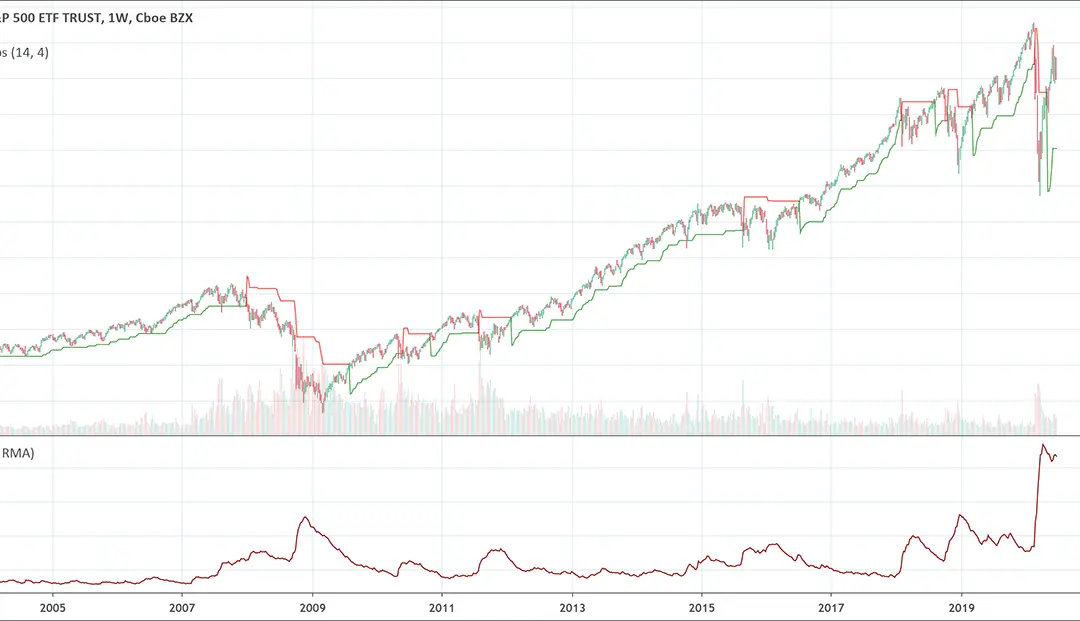
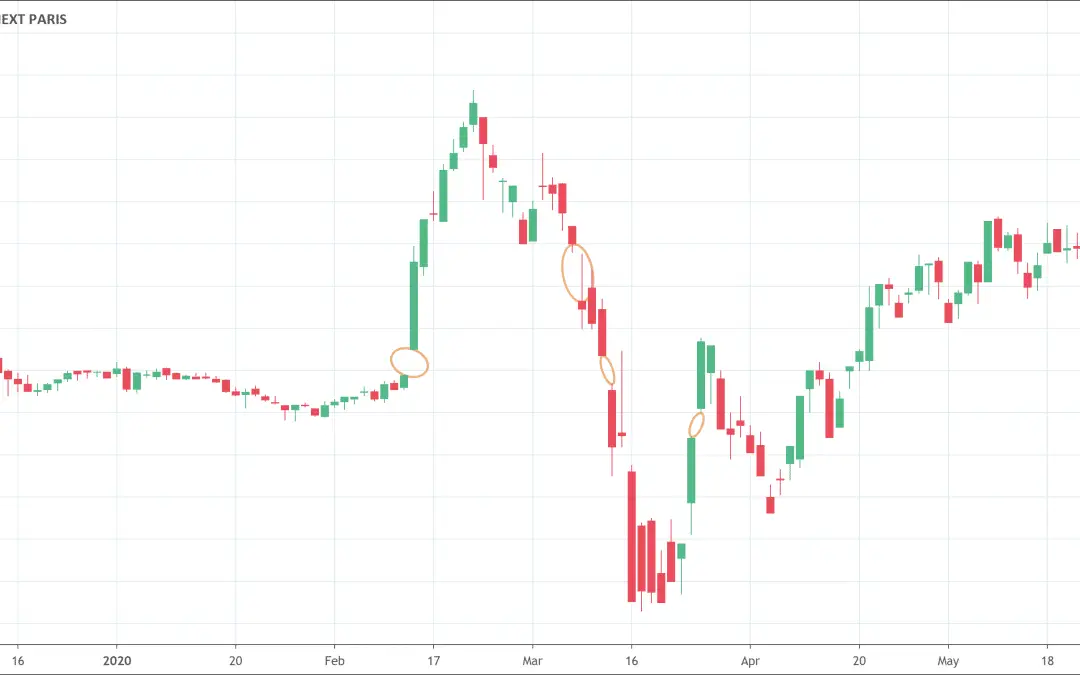
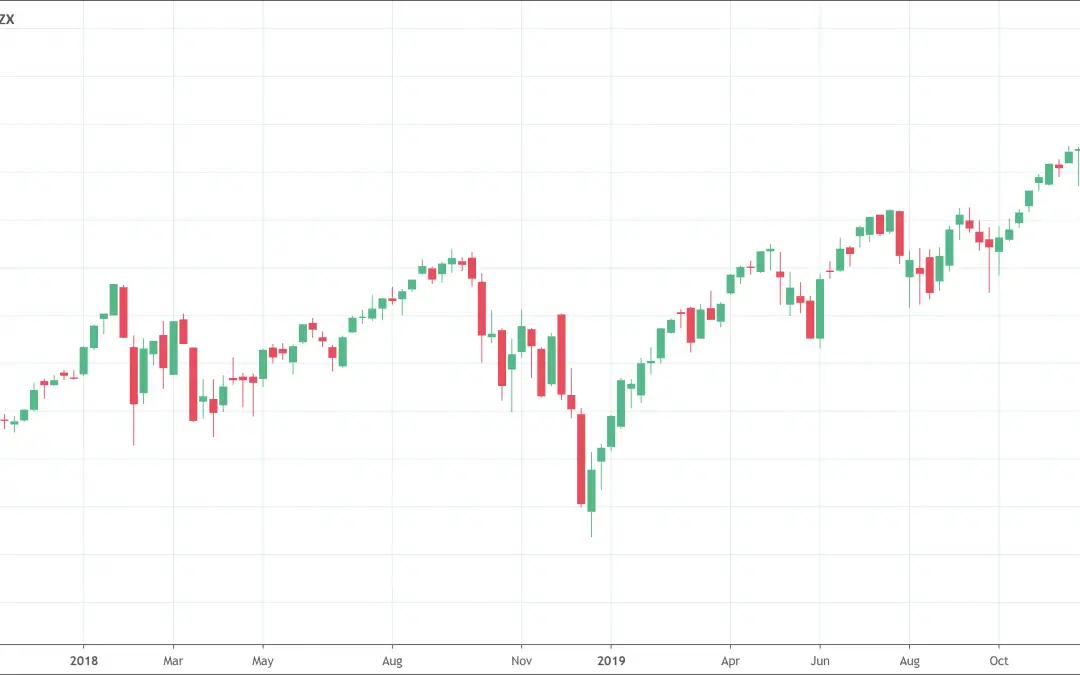
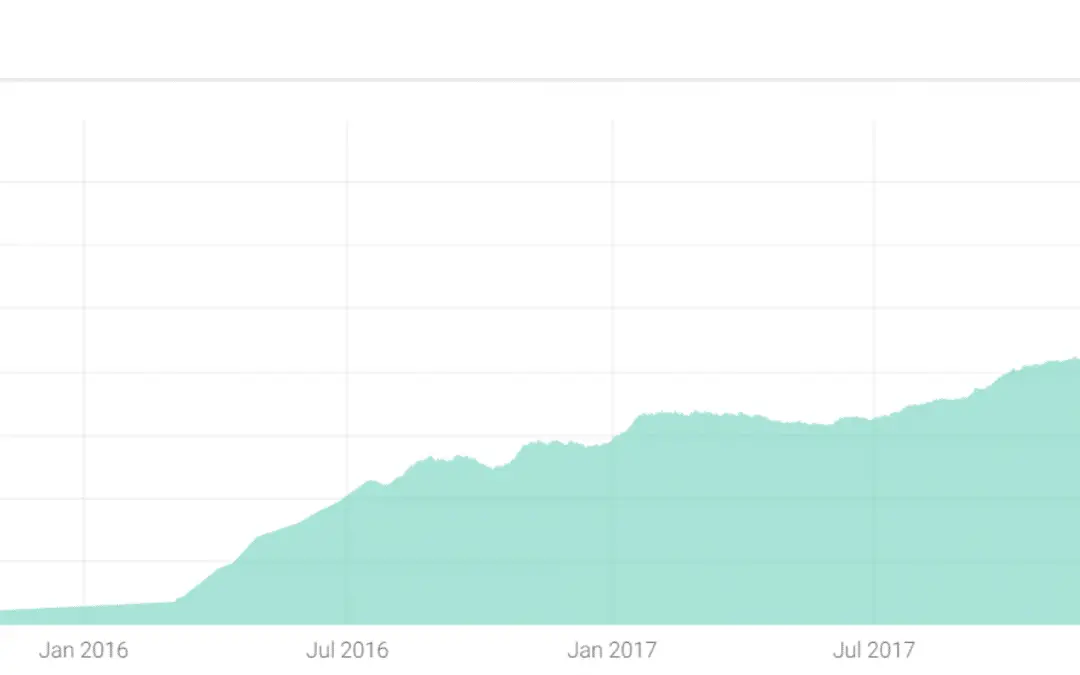
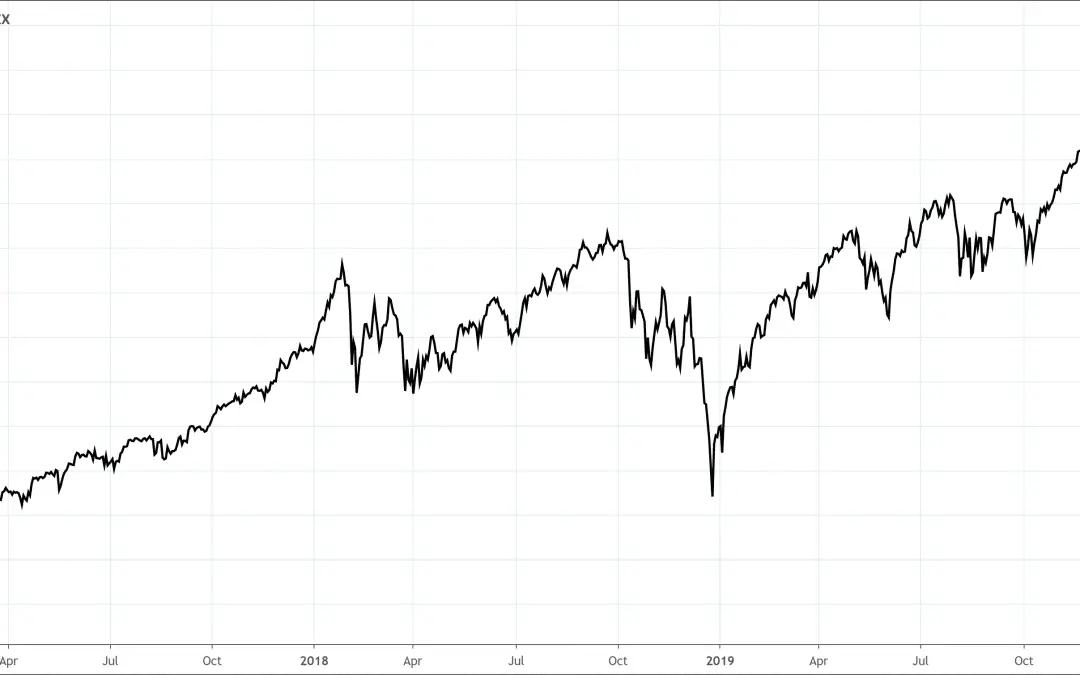
- Price: Price action is the primary measure that technical analysts consider when conducting TA. They start by observing the charts depicting the security’s price and trading volume. It enables them to analyze past performance and predict future movements. The basic objective of chart observation is to identify trends of the price or volume and how those trends behave over time.
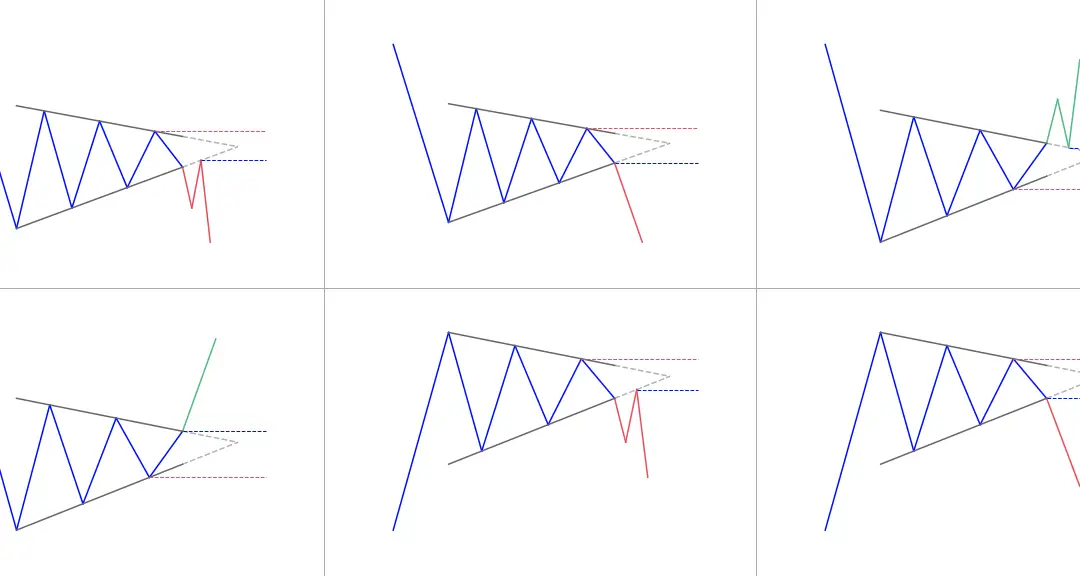
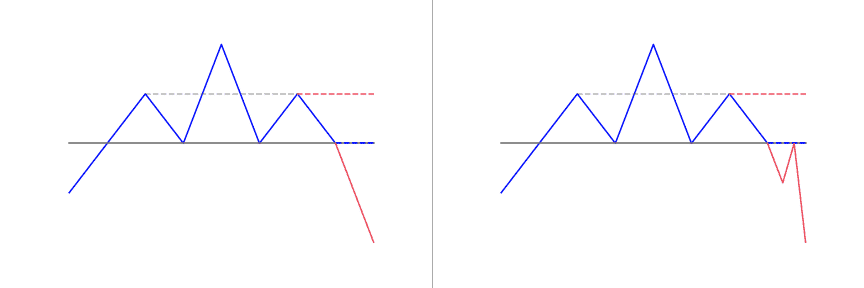
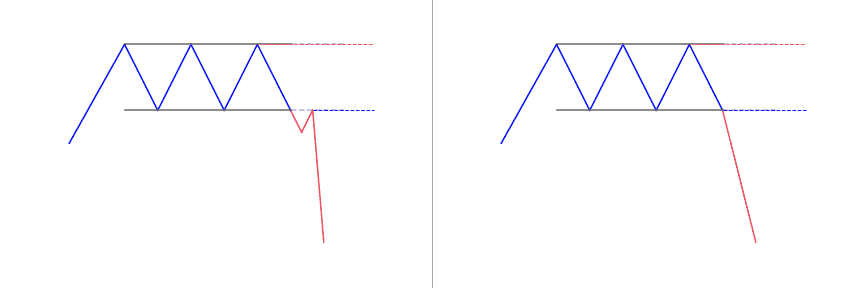
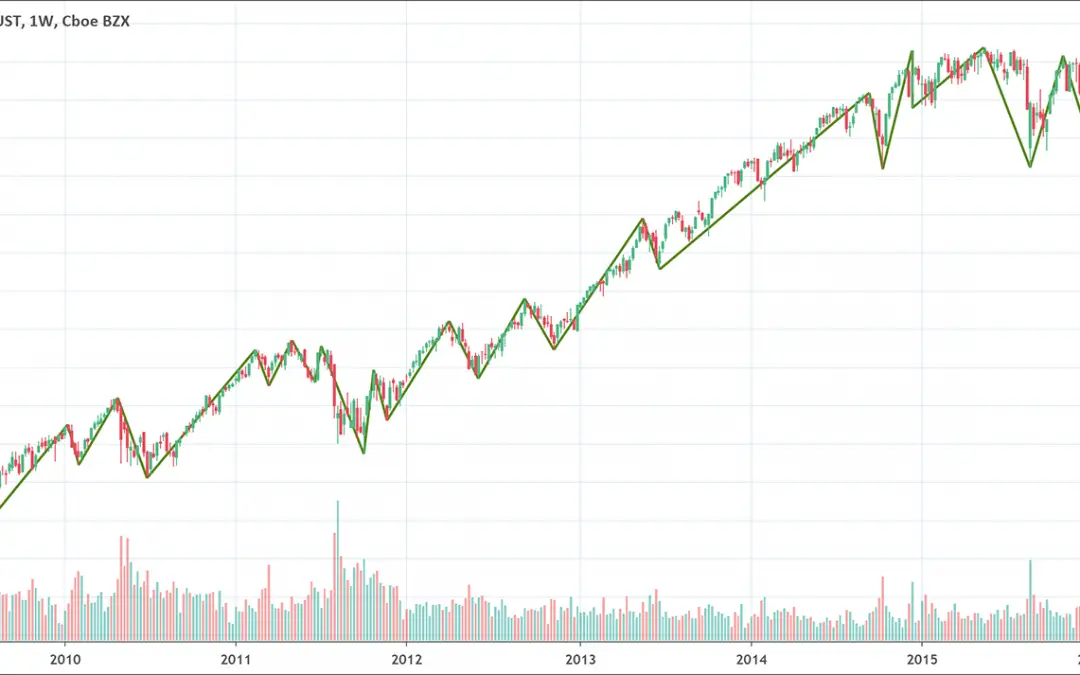
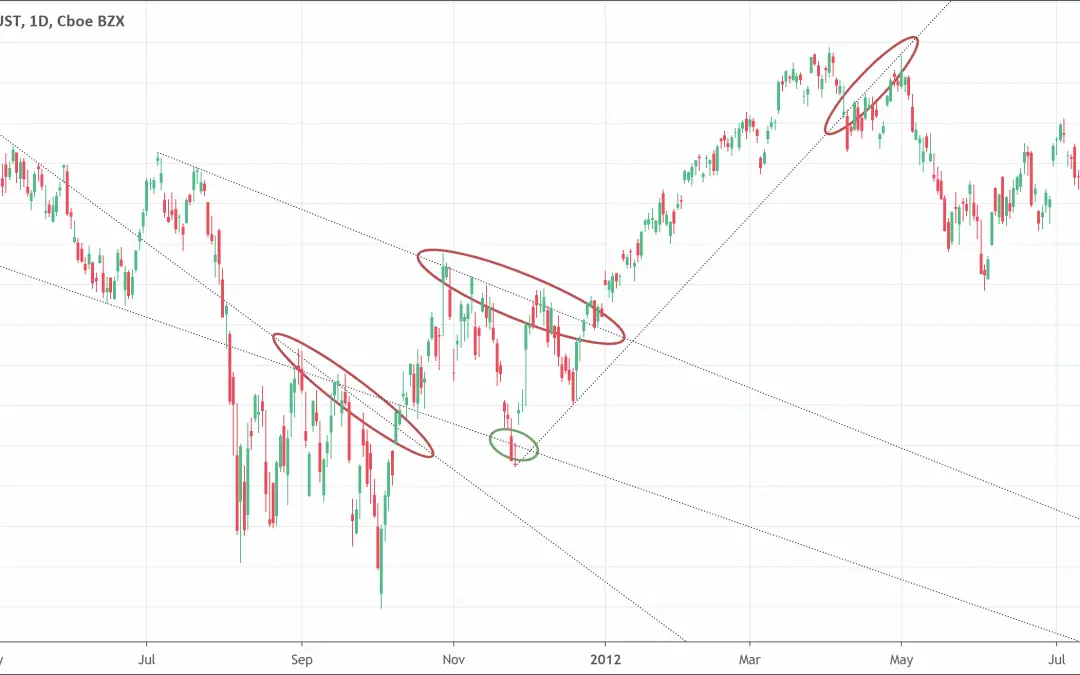
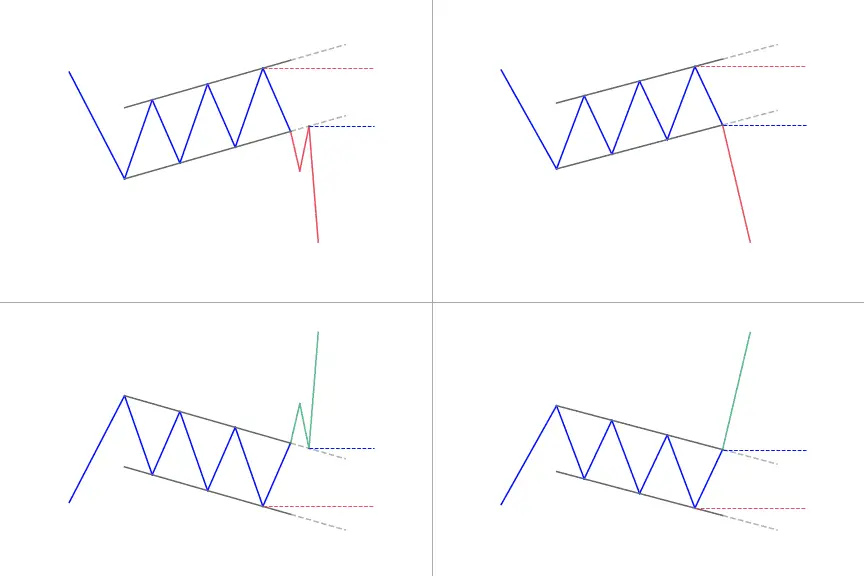
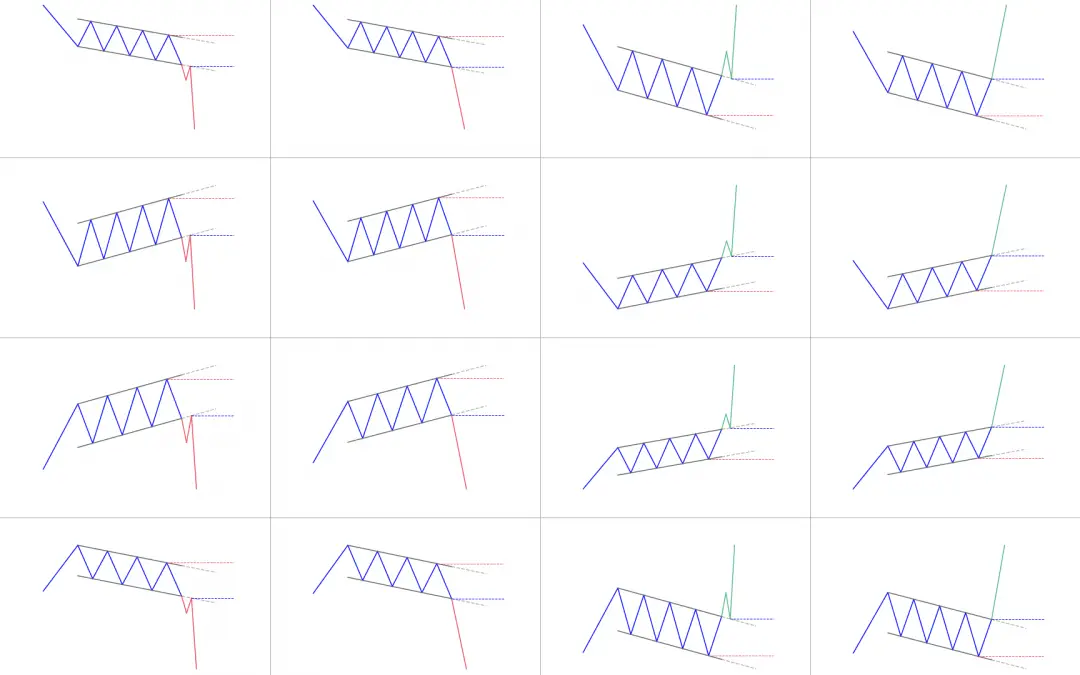
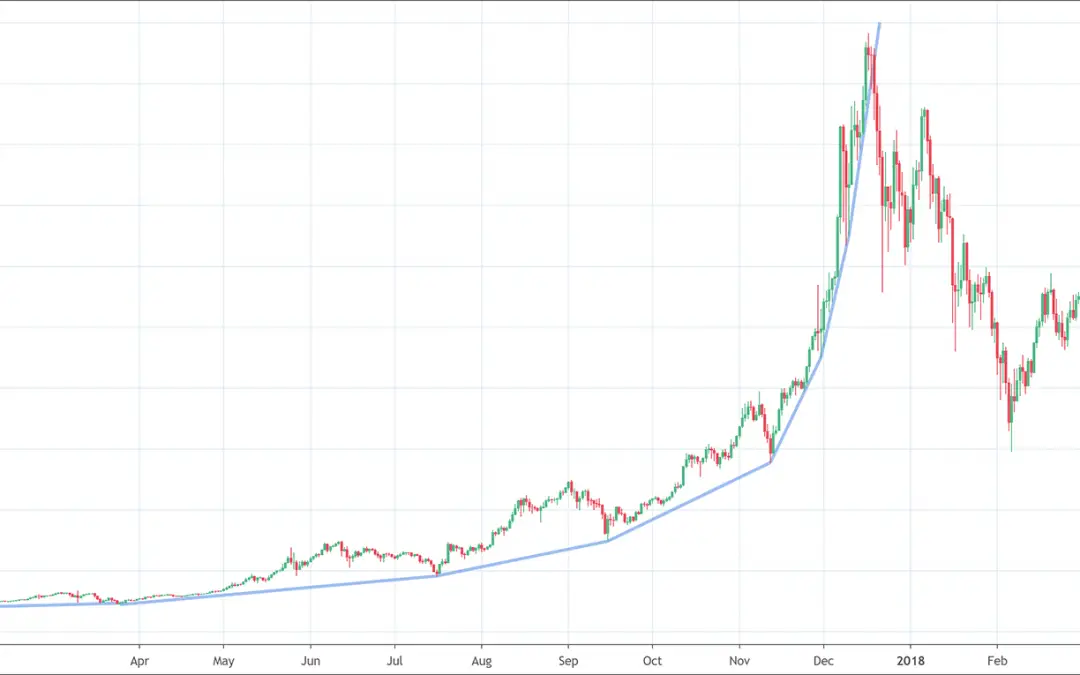
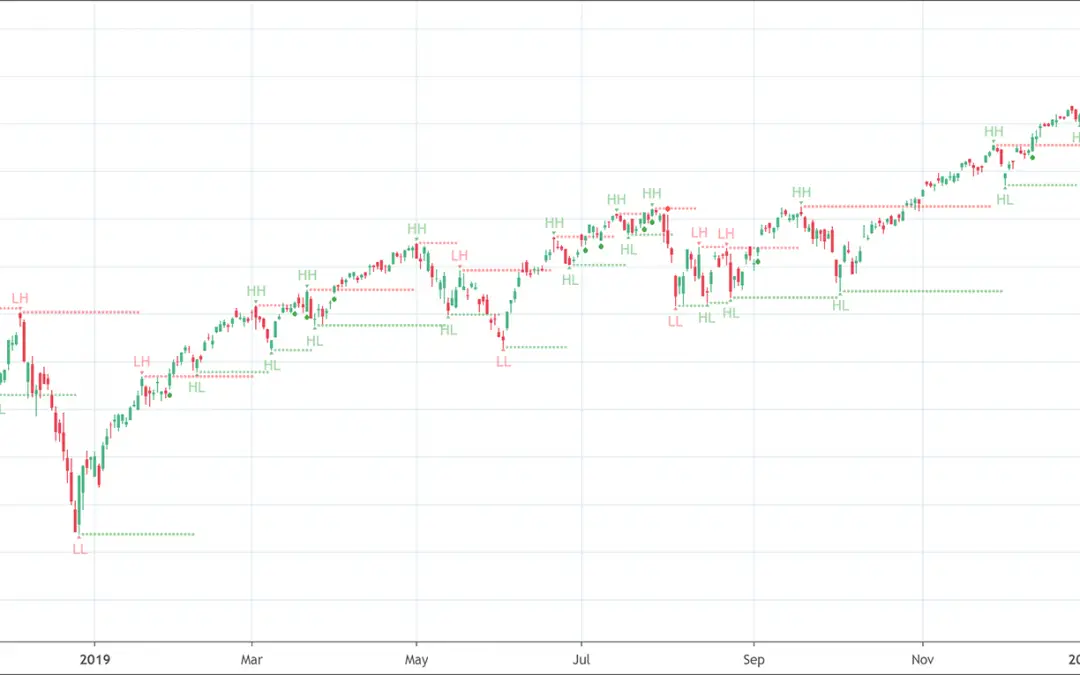
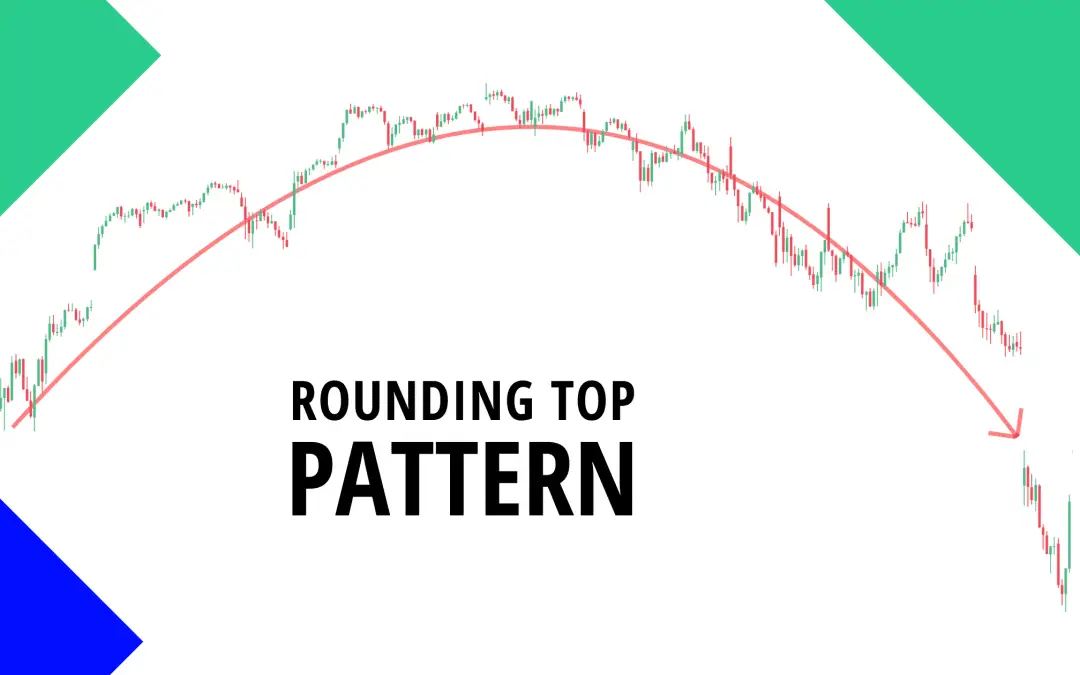
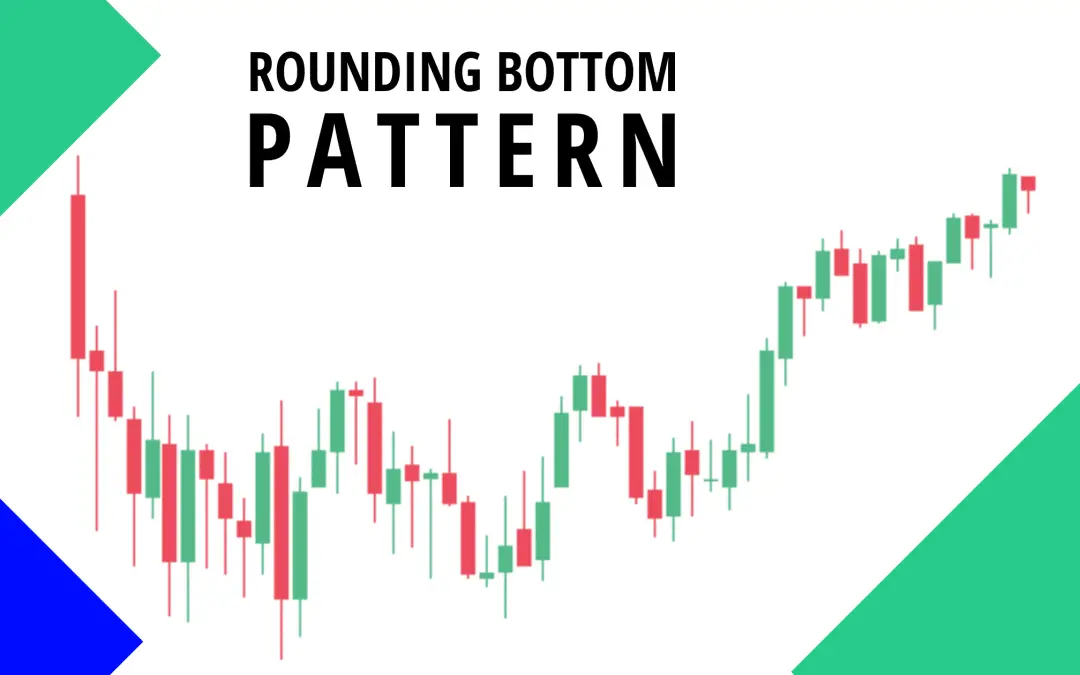
- Chart patterns: Chart patterns are one of the main helping tools that technical analysts employ. They help analysts to examine and predict how a security or stock has behaved and will trade in the future. The trend line, peak/trough, and moving averages help analysts in this regard.
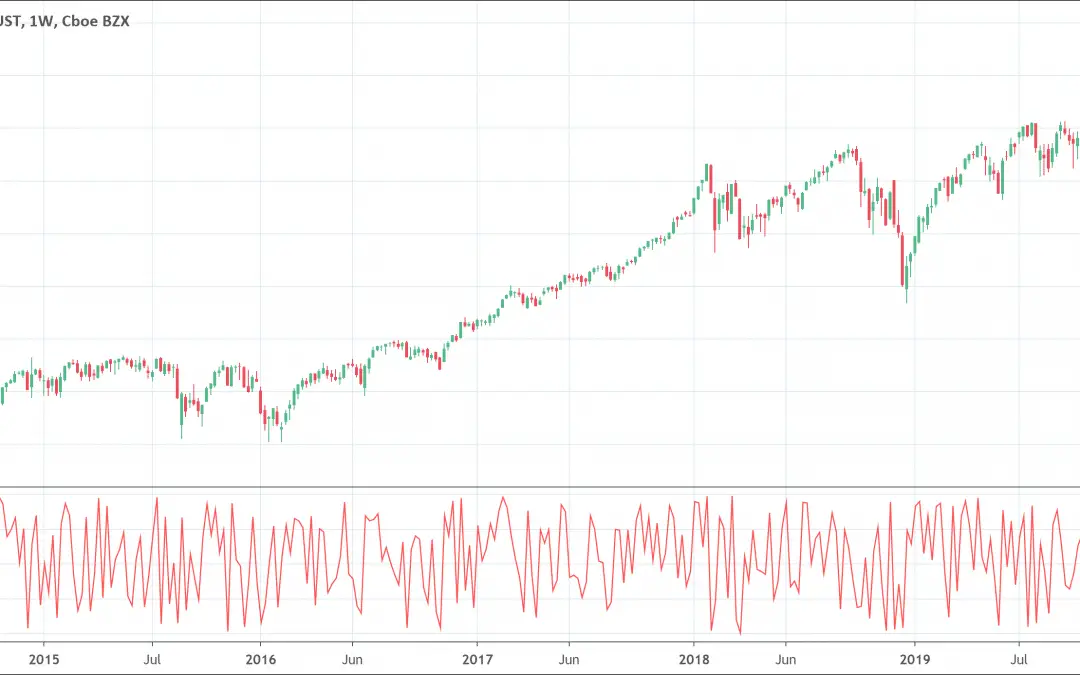
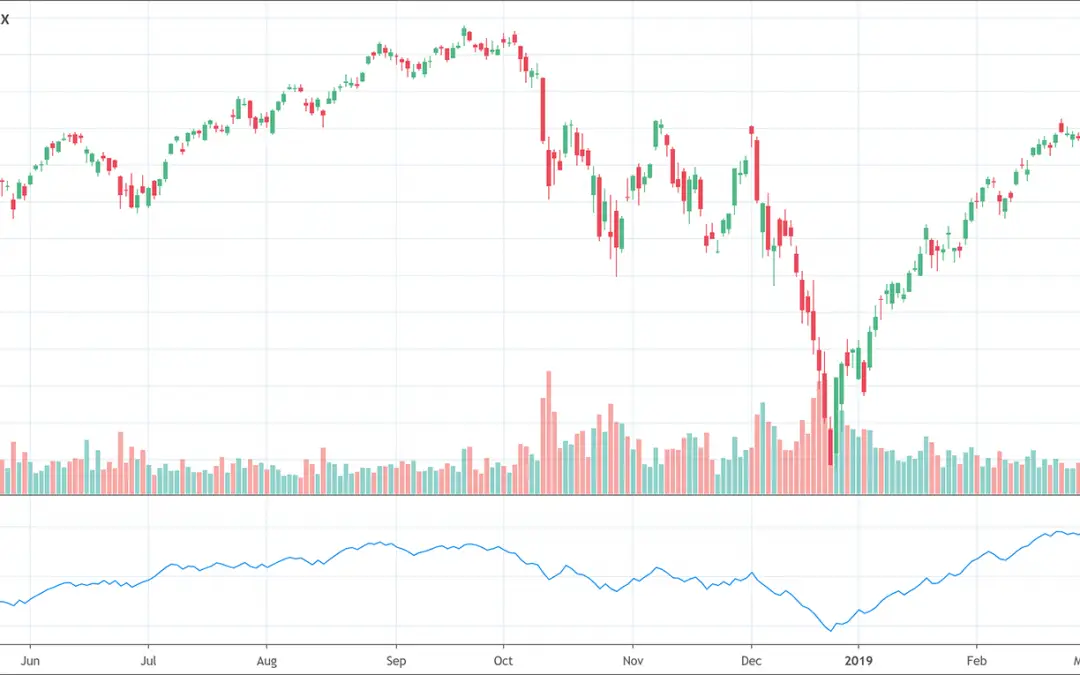
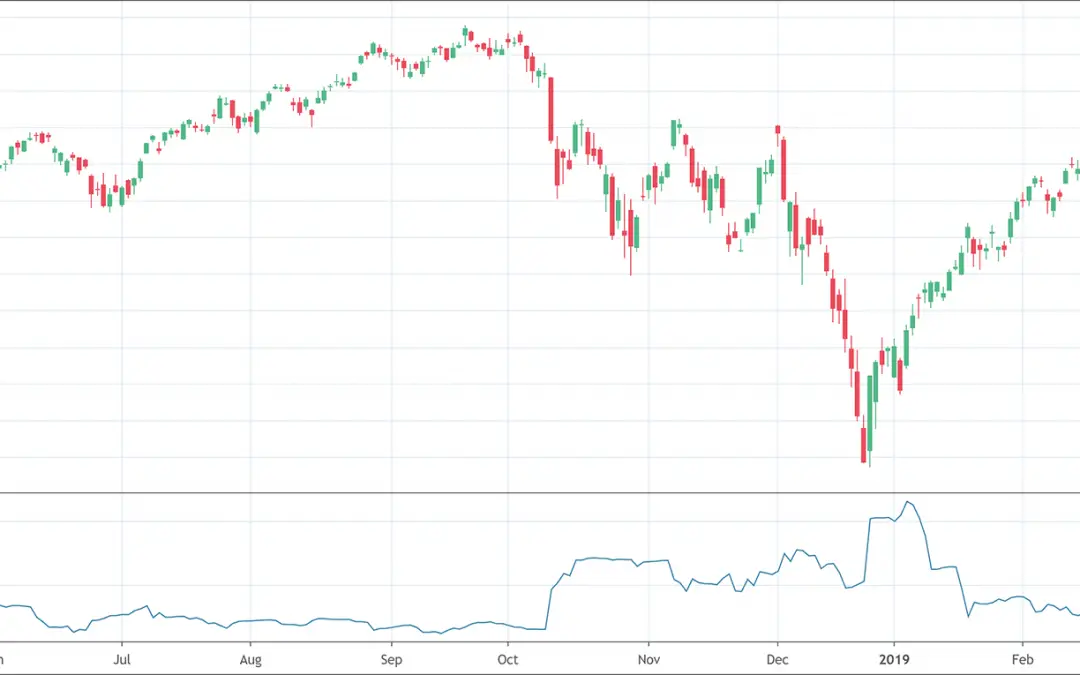
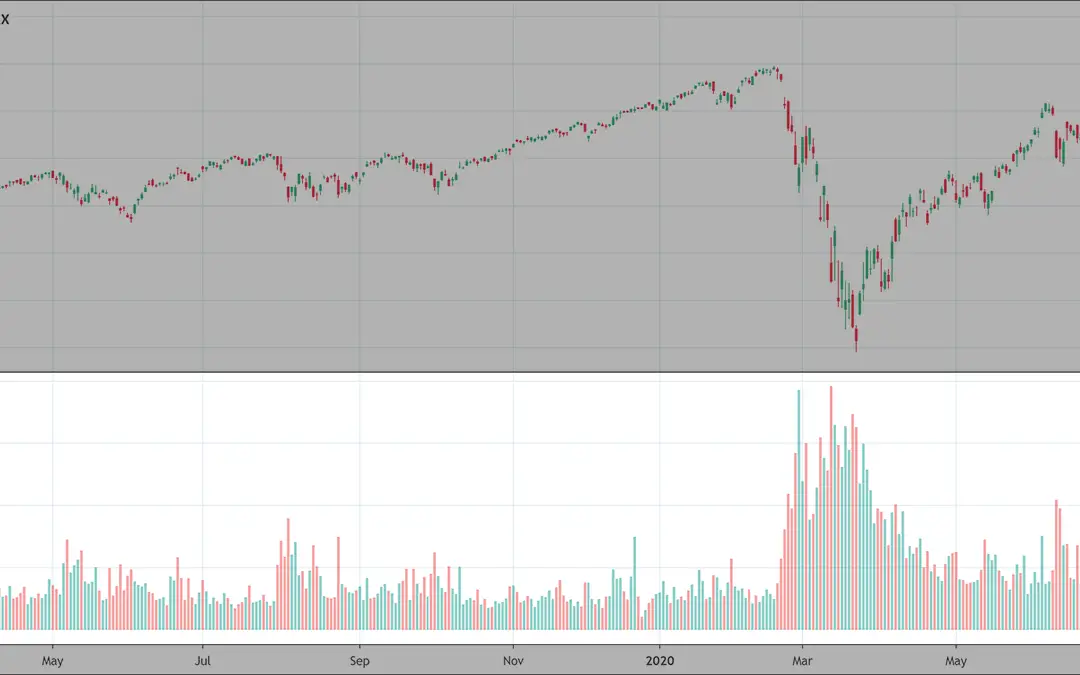
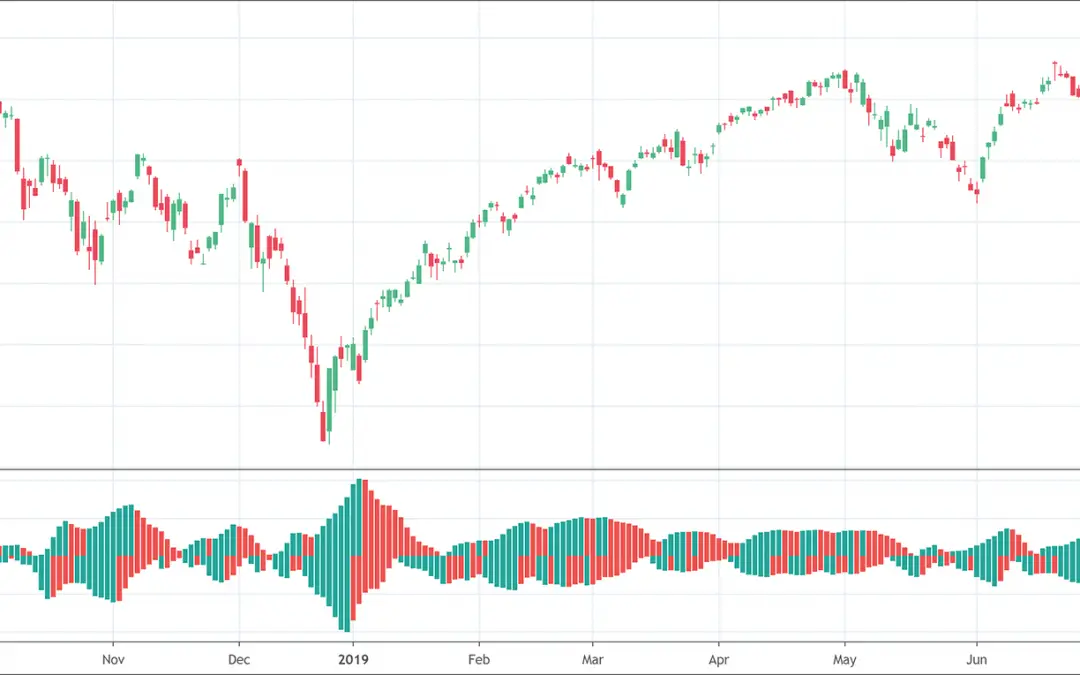
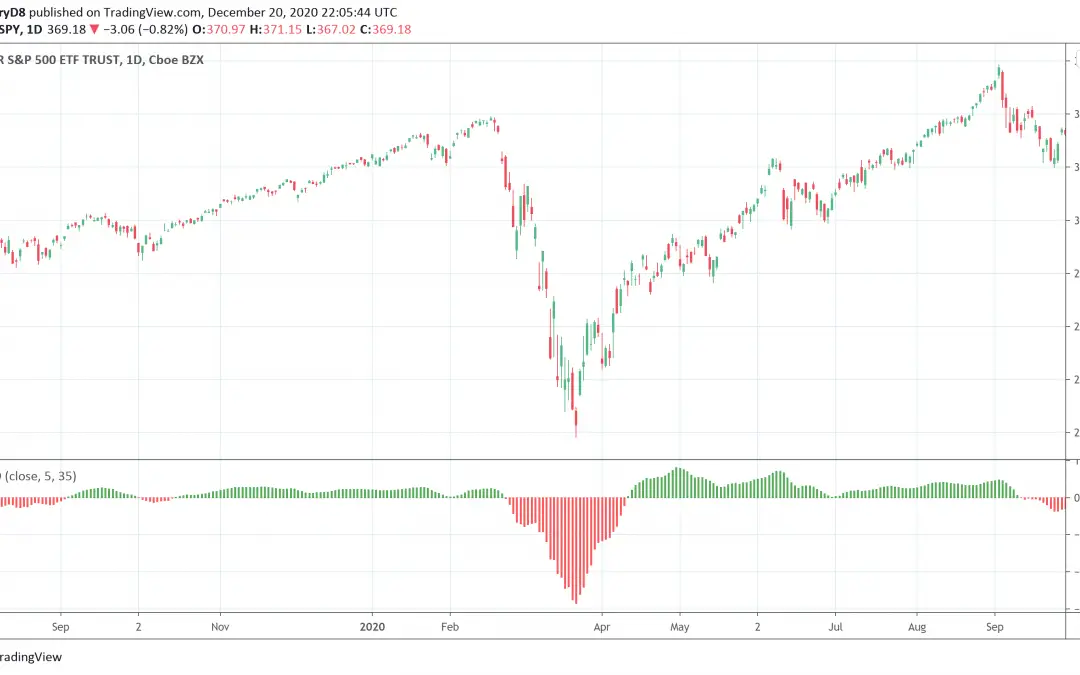
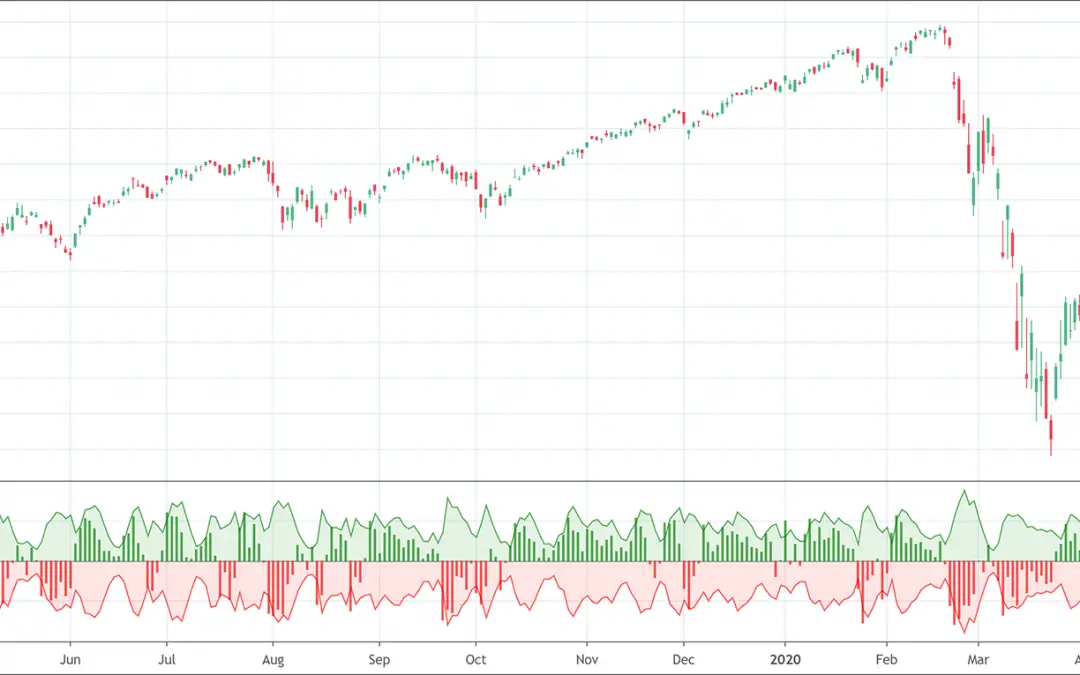
- Volume: Volume is another factor used in TA. The volume shows the number of securities or shares traded over a particular period of time. Volume study helps technical analysts to determine the strength of a trend in the market. A bar at the bottom of a chart exhibits the volume.
- Trend: Trend is one of the most important indicators for technical analysts. They indicate the future performance of stocks or securities.
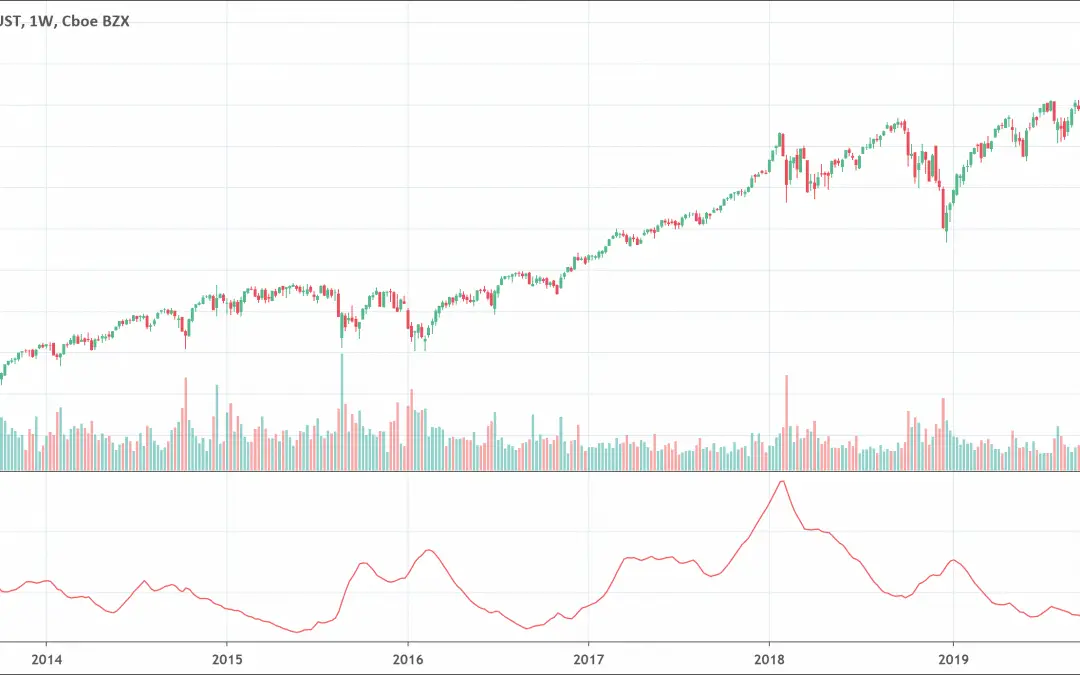
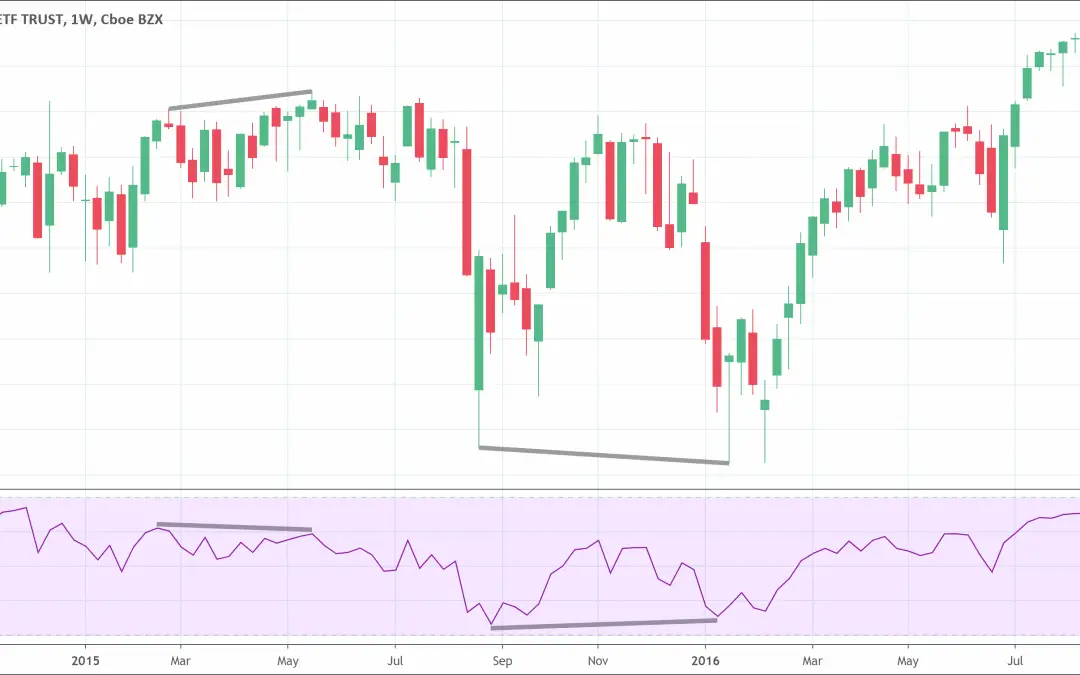
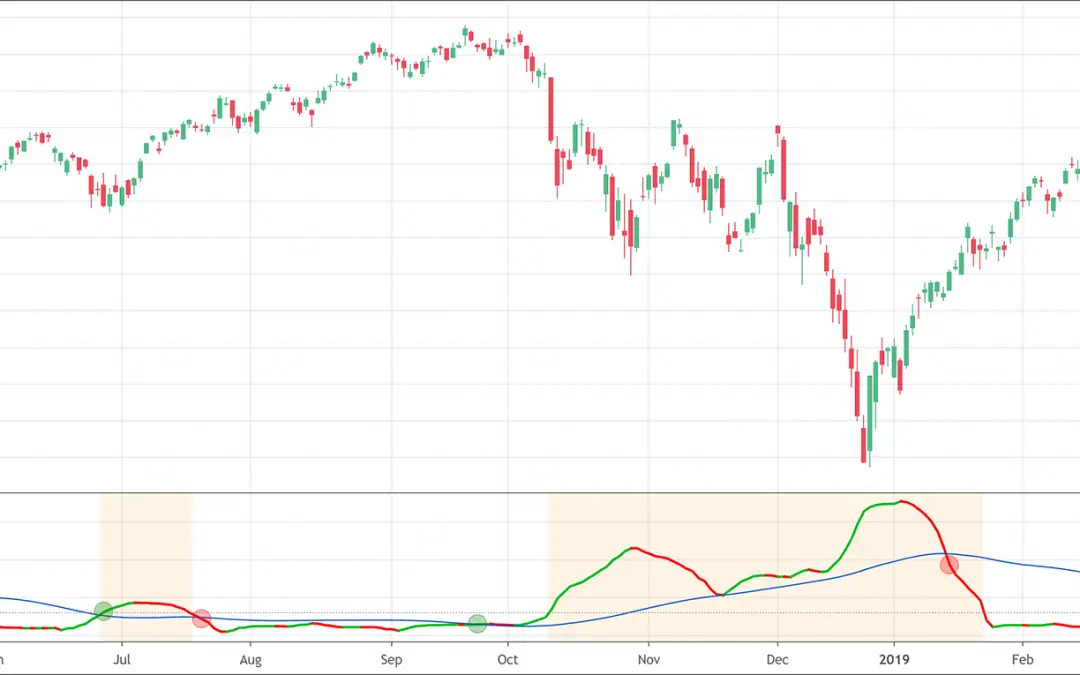
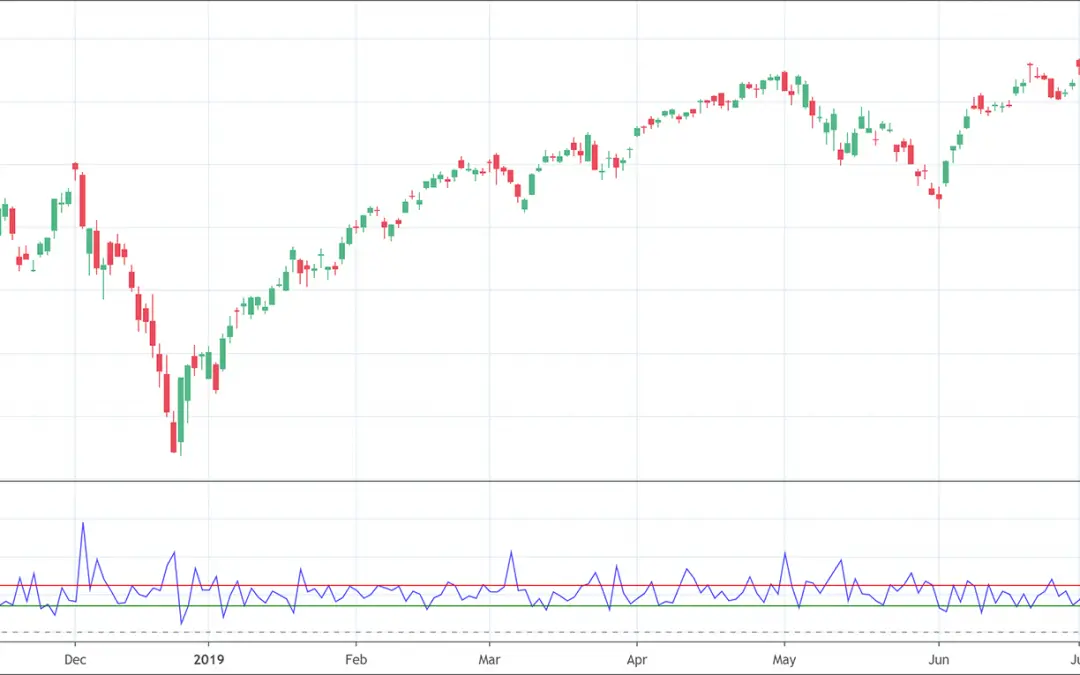
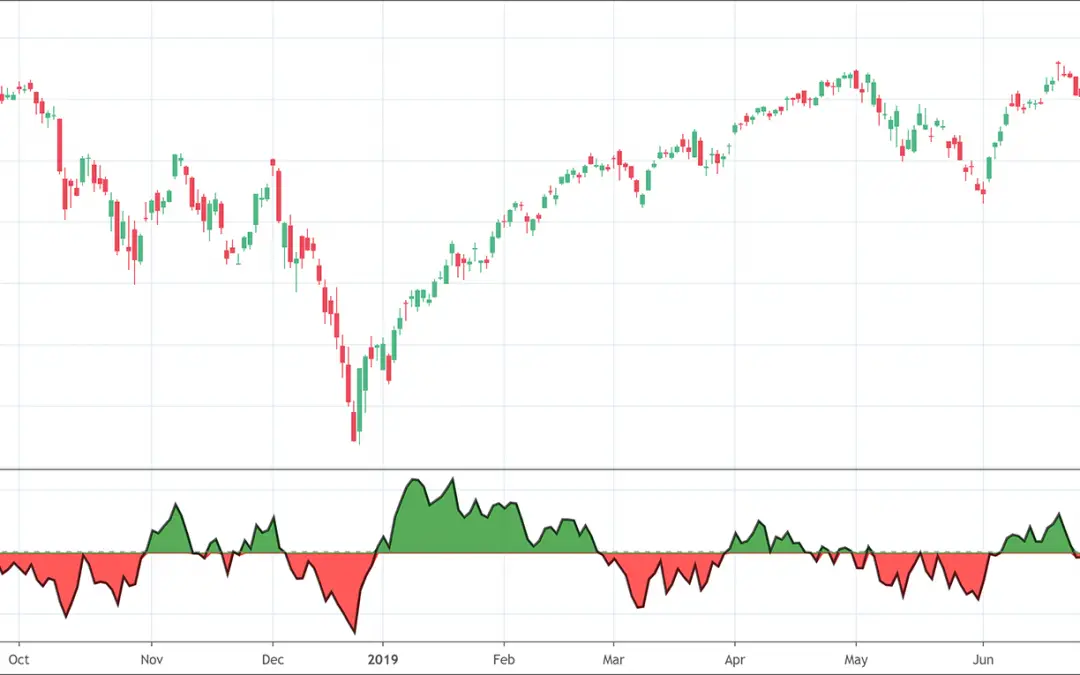
- Momentum: Momentum is another important measure that shows the speed of price movements of a stock or security. Momentum tracks record of the rate of price increase or decreases over a particular period of time.
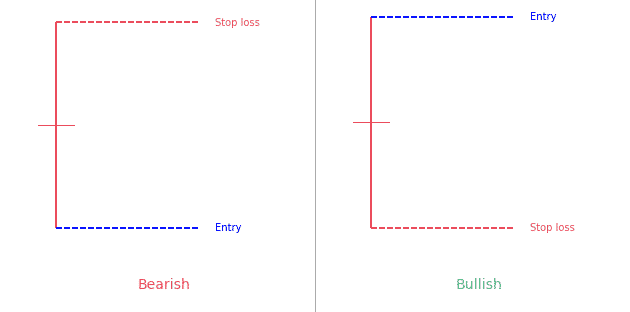
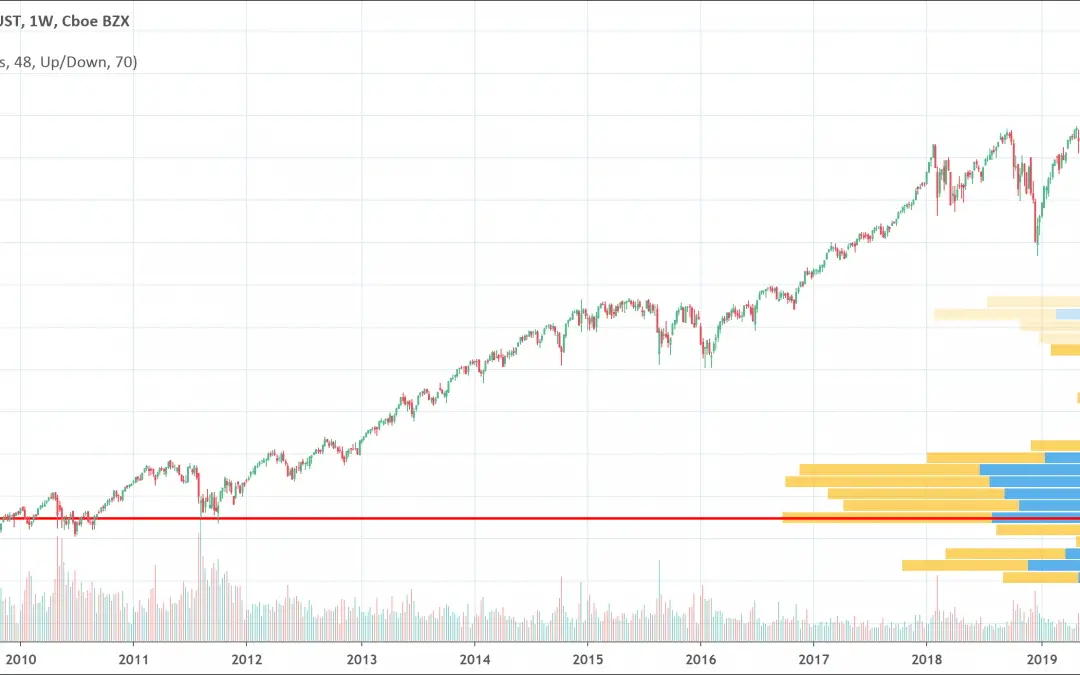
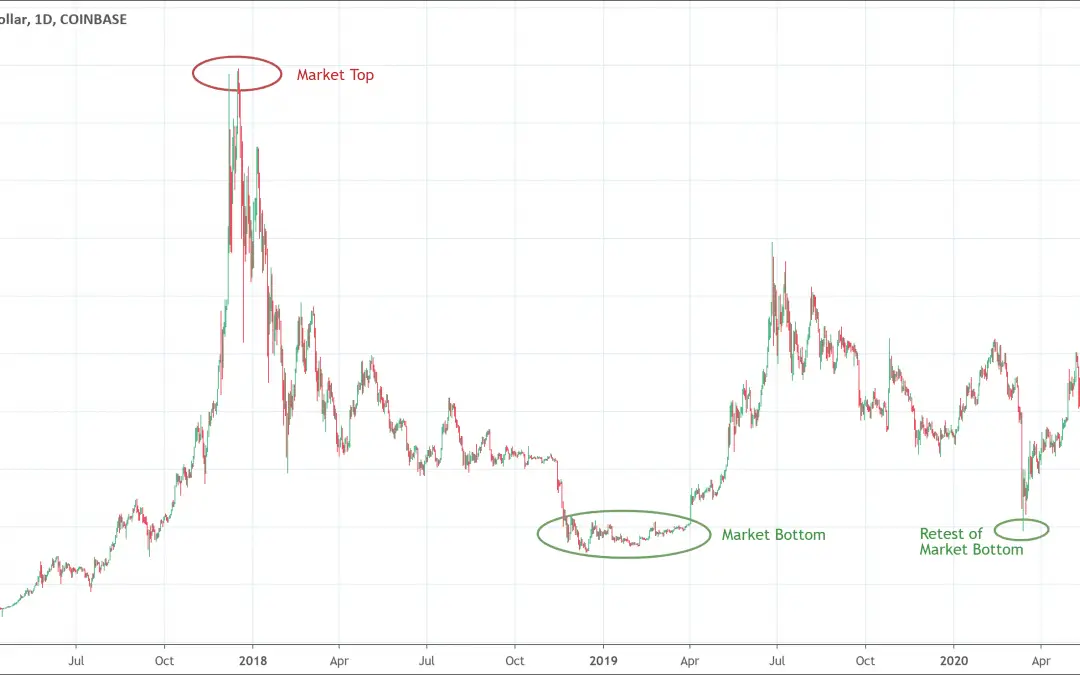
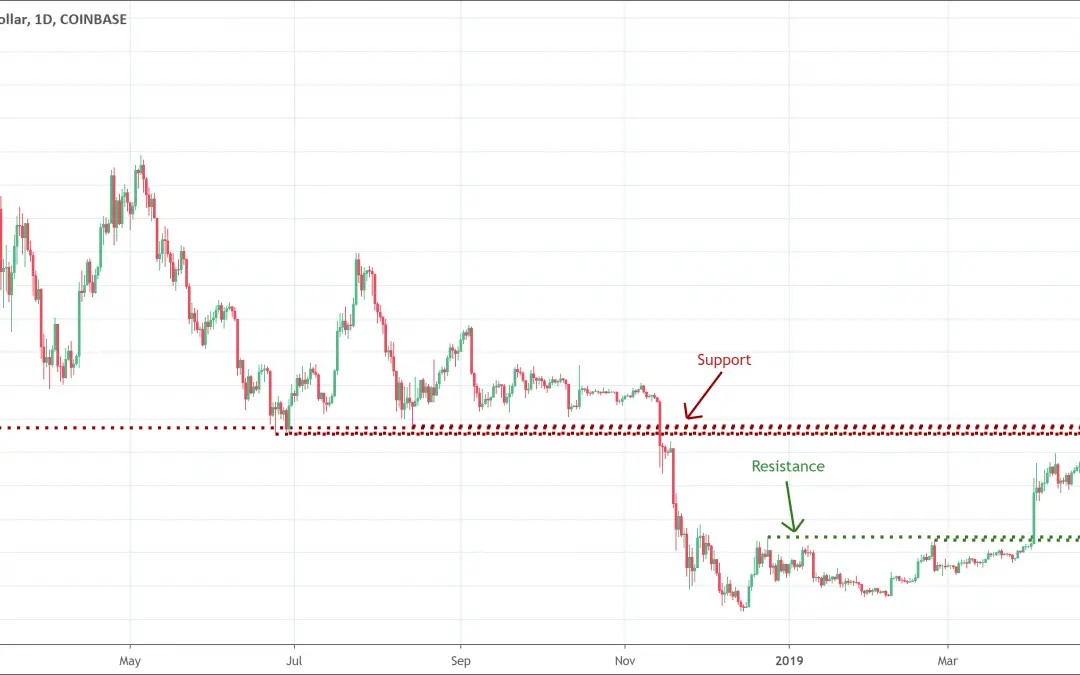
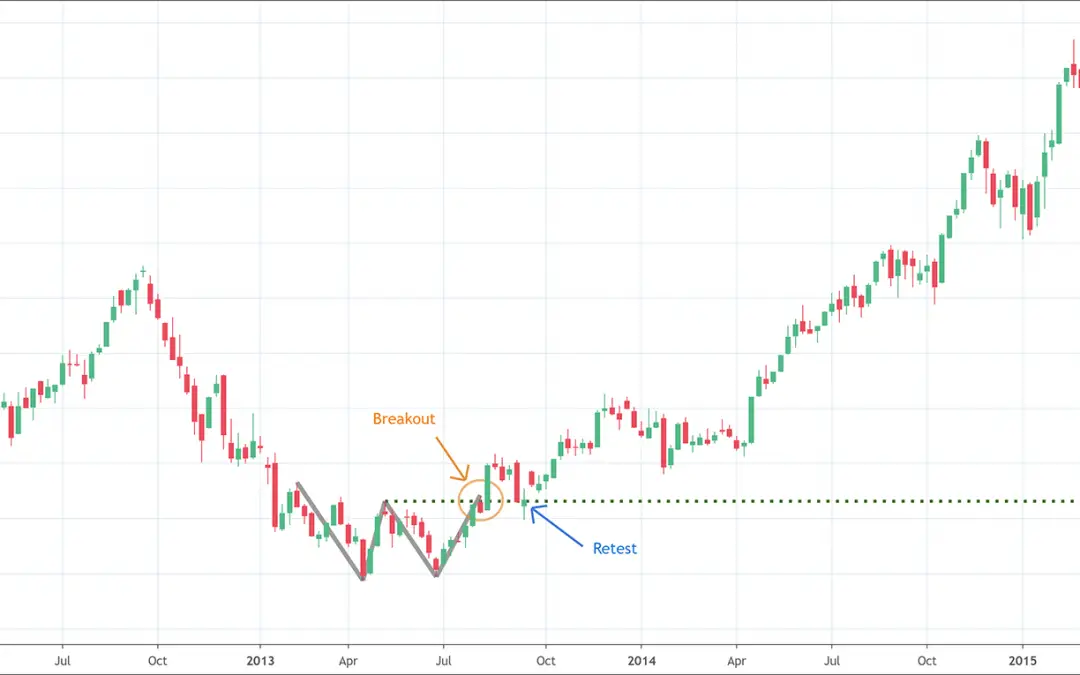
- Support and resistance: Areas of support and resistance are other important observations that technical analysts make. These help analysts to determine whether a stock is on a bullish or bearish trend.
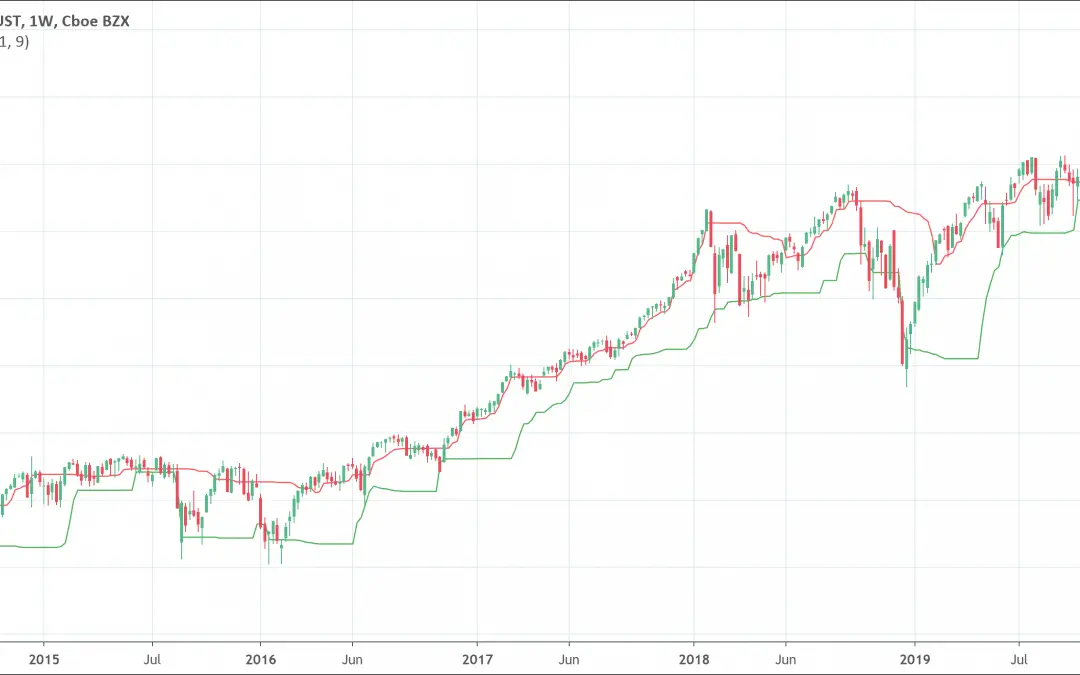
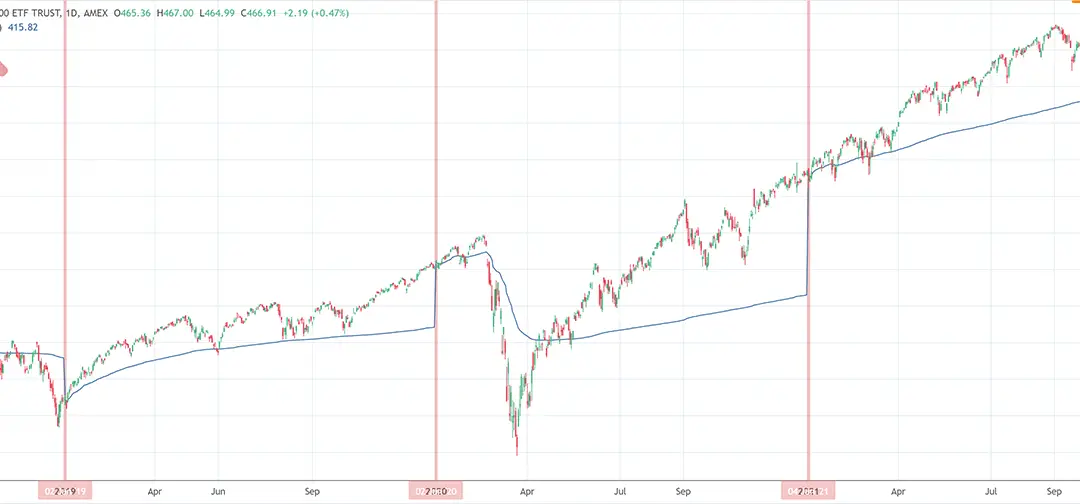
- Moving averages: Moving averages show an average of past movements of a stock or security. These help analysts to see trends more clearly.
Technical charting theories build on a few main assumptions. It partly explains why it is also a very controversial topic.
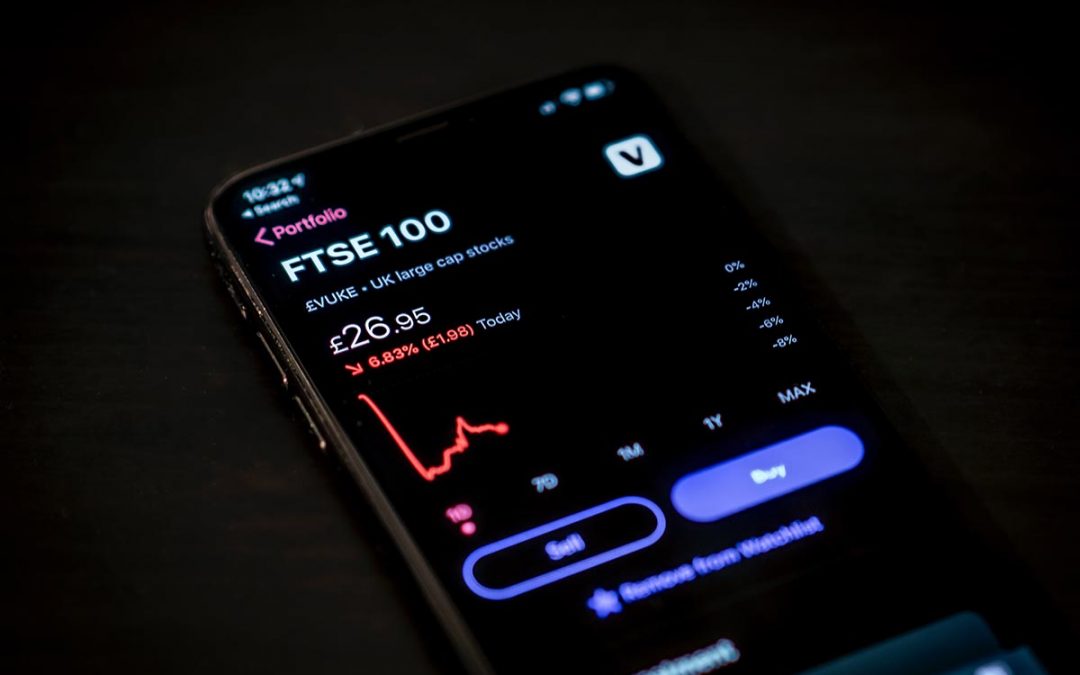
How does technical analysis work in stock markets or forex?
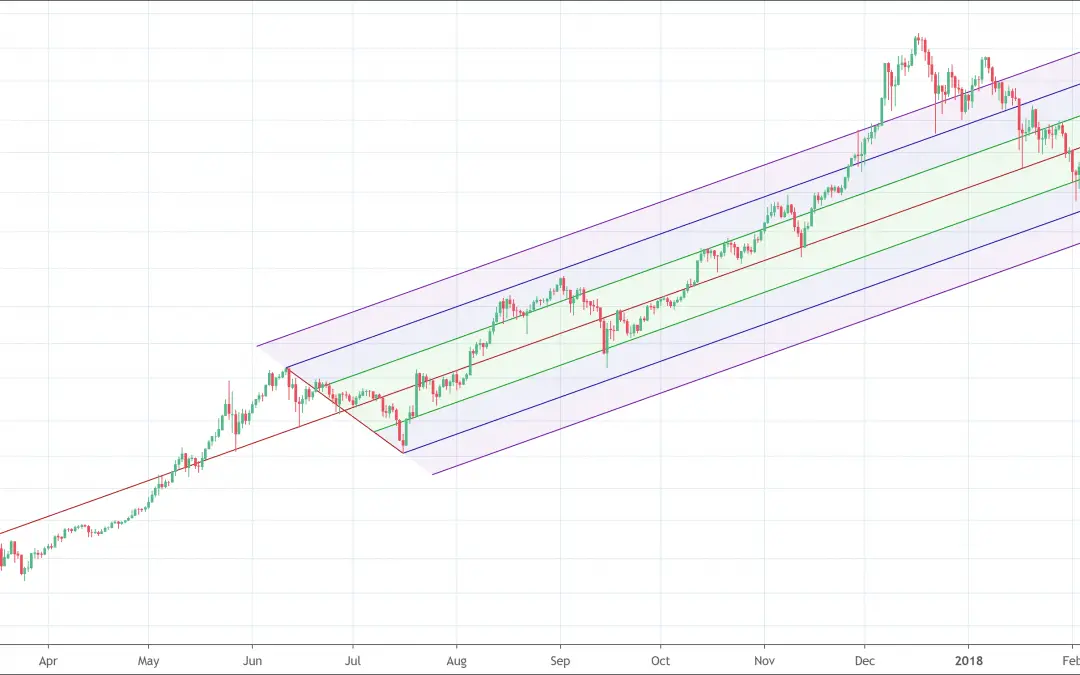
Technical analysis works on the same basis across all the tradable instruments. It works with the purpose of forecasting future price movements including stocks, futures, bonds, and forex instruments. There are various patterns and signals that help analysts during technical analysis. Moreover, analysts have also developed various trading systems that help in forecasting and trading on price movements. Technical analysis works on the basis of such tools and trading systems. Trendlines, channels, moving averages, and momentum indicators are among the most widely used indicators and charting patterns.
Summary before to go into each detailled article
Identification of the signals for price trends in a market is the basic and very important component of any trading strategy. Technical analysis is the best option in this regard. It helps traders to find the best entry or exit points. However, it is also very important to note that market behavior is not 100% accurately predictable. Although technical analysis gives us an insight into the likely price movement of a stock or security, it doesn’t promise success. Moreover, technical analysis alone doesn’t guarantee success. Always remember that successful trading also relies on proper risk management, discipline, and your ability to keep your emotions under control.
You’ll find below all the articles for each single technical analysis patterns, indicators and concepts. We sincerely hope it’ll help you succeed!
 Good Trading requires the Best Charting Tool!
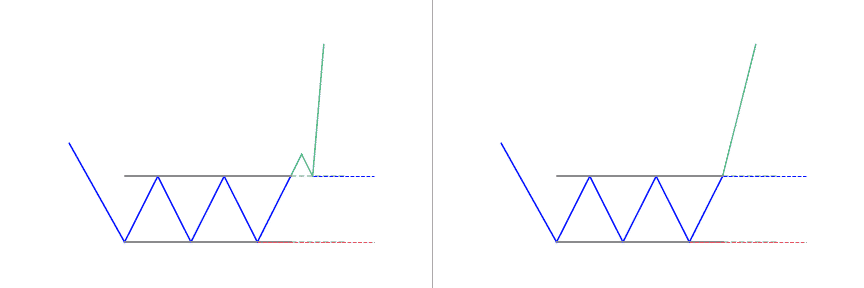
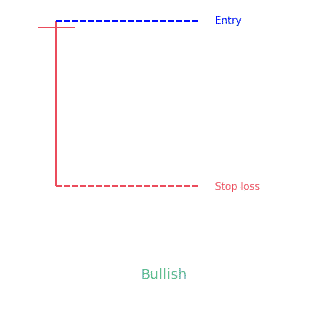
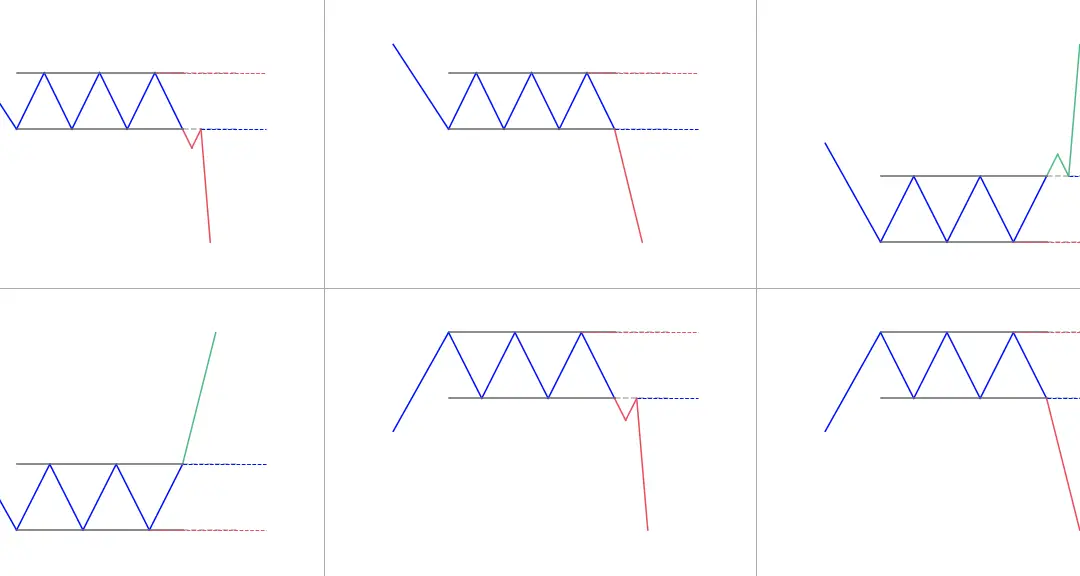
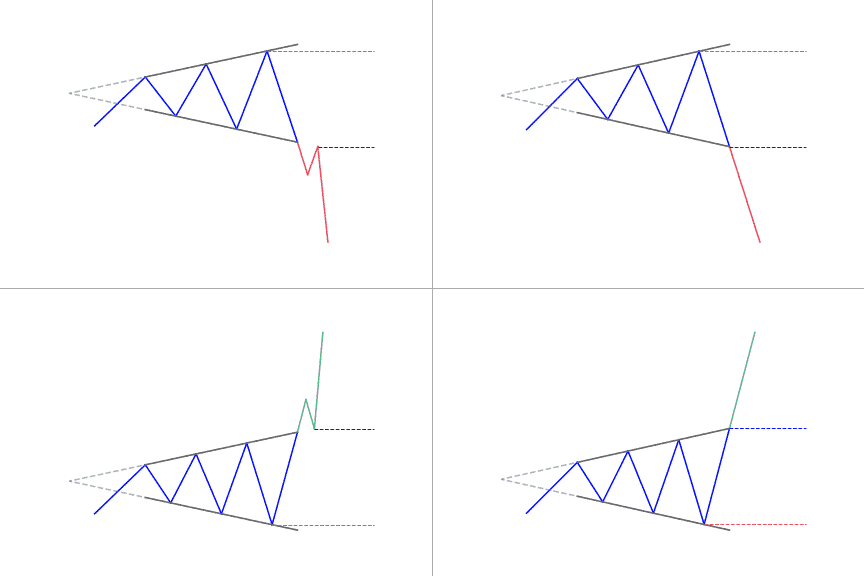
![Ascending Triangle Pattern: Full Guide [2022]](https://patternswizard.com/wp-content/uploads/2020/05/ascendingtriangle.png)
![Dark Cloud Cover Candlestick Pattern: The Ultimate Guide [2022]](https://patternswizard.com/wp-content/uploads/2020/05/darkcloudcover-bearish.png)
![Falling Wedge Pattern: Ultimate Guide [2022]](https://patternswizard.com/wp-content/uploads/2020/05/fallingwedge.png)
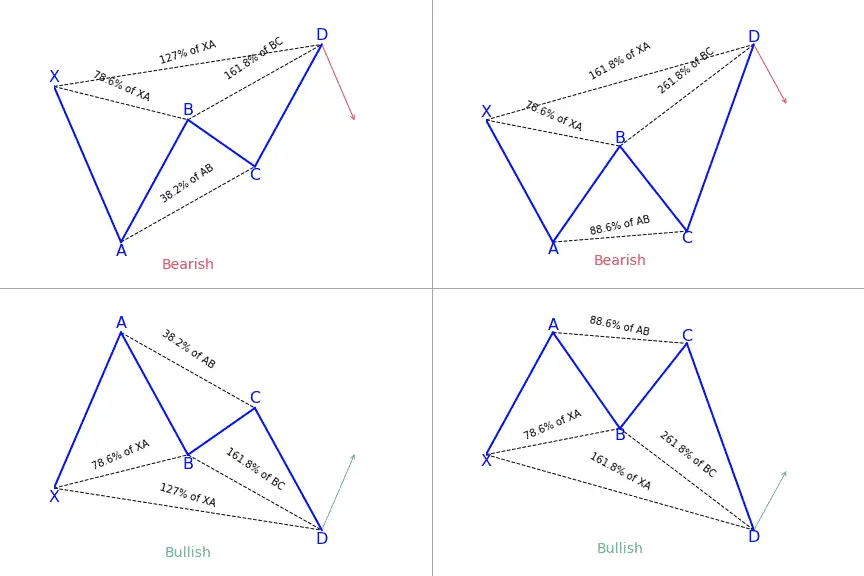
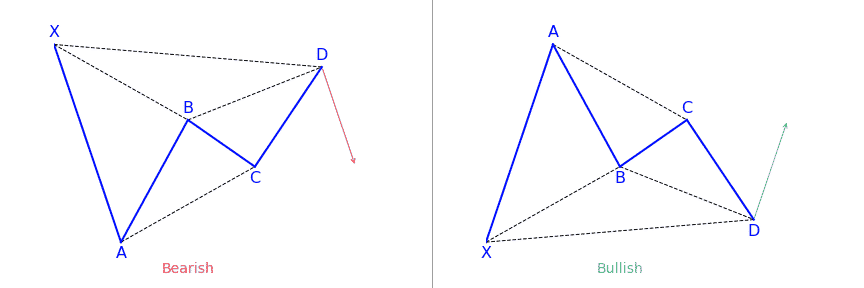
![Crab & Deep Crab Harmonic Pattern: The ultimate guide [2022]](https://patternswizard.com/wp-content/uploads/2020/06/crab.png)
![Three-Line Strike Pattern: Complete Guide [2022]](https://patternswizard.com/wp-content/uploads/2020/06/threelinestike.png)
![Shark Harmonic Pattern: Full Guide [2022]](https://patternswizard.com/wp-content/uploads/2020/06/shark.png)
![Key Reversal Bar Pattern: Complete guide [2022]](https://patternswizard.com/wp-content/uploads/2020/06/keyreversalbar.png)
![5-0 Harmonic Pattern: Complete guide [2022]](https://patternswizard.com/wp-content/uploads/2020/06/5-0.png)
![Stochastic Oscillator: Full Trading Guide [2022]](https://patternswizard.com/wp-content/uploads/2020/06/Stochastic-1080x675.png)
![MACD Indicator: The Ultimate Guide [2022]](https://patternswizard.com/wp-content/uploads/2020/06/MACD-1080x675.png)
![McGinley Dynamic Indicator: Full Guide [2022]](https://patternswizard.com/wp-content/uploads/2020/07/mcginleydynamic-1080x675.png)
![Rate of Change Indicator: Complete Guide [2022]](https://patternswizard.com/wp-content/uploads/2020/07/rateofchange-1080x675.png)
![Stochastic RSI indicator: Full Guide [2022]](https://patternswizard.com/wp-content/uploads/2020/07/stochrsi-1080x675.png)
![Elliott Waves Theory: The Complete Guide [2022]](https://patternswizard.com/wp-content/uploads/2020/08/elliottwave-1080x675.png)
![Volume Price Trend Indicator: Full Guide [2022]](https://patternswizard.com/wp-content/uploads/2020/08/pricevolumetrend-1080x675.png)


![TTM Squeeze Indicator Explained [Full Trading Guide]](https://patternswizard.com/wp-content/uploads/2021/10/TTM-Squeeze-1080x590.png)
![RSI Divergence: How to interpret & trade it? [Complete Strategy]](https://patternswizard.com/wp-content/uploads/2021/11/rsi-divergence-1080x504.png)


 We loved Marwood Research’s course “Candlestick Analysis For Professional Traders“. Do you want to follow a great video course and deep dive into 26 candlestick patterns (and compare their success rates)? Then make sure to check this course!
