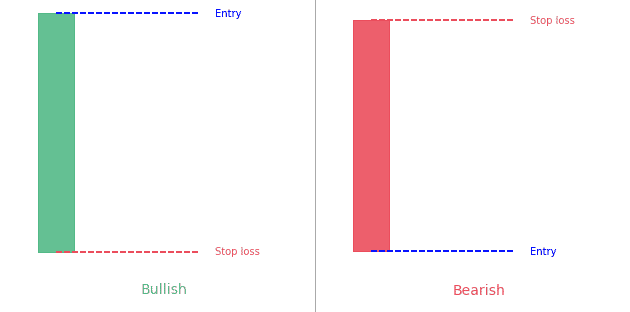
Key takeaways A marubozu candle only has a body. It doesn't have wick or tail.Bullish marubozu is a long green body candleBearish marubozu is a long red body candle Statistics to prove if the Marubozu pattern really works What is...
Did you know there are about 100 different types of chart patterns?
They come in different shapes and sizes but they all share something in common : they are a key part of technical analysis and to be able to use them you first need to recognize them.
Below you’ll find the ultimate database with every single chart pattern. You’ll find detailed articles for each going into detailed explanation, giving you examples and data for each pattern. No more doubt about what makes a specific pattern and how well it works.
Moreover, this extensive cheat sheet will definitely give you an edge and let you understand and recognize every pattern. Plus at PatternsWizard, our absolute focus is to bring you data-driven performance statistics. So for most patterns (articles below) you’ll find data about each pattern’s performance statistics and reliability (how often they confirm, reach the target or stop, how often they appear, …) to adjust your trading strategy of financial markets.
Chart patterns are unique formations formed by changes in the price of securities on the price chart. They are the basis of technical analysis.
There are several types of patterns: classic patterns, candlestick patterns and harmonic patterns. As a result, each type has its own specificities. Identify patterns by lines that connect common price points (such as closing prices or high or low points) within a specific time period.
Technical analysts and chart experts seek to identify patterns to predict the future direction of security prices. These patterns can be as simple as a trend line or as complex as a double head and shoulders pattern.
There are three main categories that classify the chart patterns:
Each of these patterns have very strict requirements. To help you easily get your hands on each pattern we detailed them in their own article with everything you should know.
Of course, you can use these patterns in conjunction together, with other indicators or locations (resistance levels or resistance lines) to enhance your hints about future price movements before you take a trade.
Depending on the pattern (each pattern can tell a different story), they can be a hint for :
Regardless of the pattern(s) you’d like to hunt and trade, you’ll need a reliable source to chart your markets. TradingView is the best solution for you! As you may have noticed, most of our charts on the site are taken from charts created on TradingView. Click here to check TradingView for free now!
Want to go into the details of a specific pattern? You’re at the right place!
These patterns often have very imaginative names. Feel free to discover the detailed article for each chart pattern right below :

Key takeaways A marubozu candle only has a body. It doesn't have wick or tail.Bullish marubozu is a long green body candleBearish marubozu is a long red body candle Statistics to prove if the Marubozu pattern really works What is...
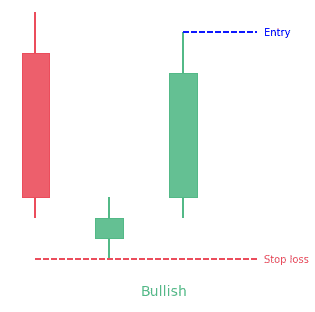
Key takeaways A morning star pattern is a bullish 3-bar reversal candlestick patternIt starts with a tall red candle, then a small candle and finishes with a tall green candleThe middle candle reports indecision in the marketThe opposite pattern is the evening star...
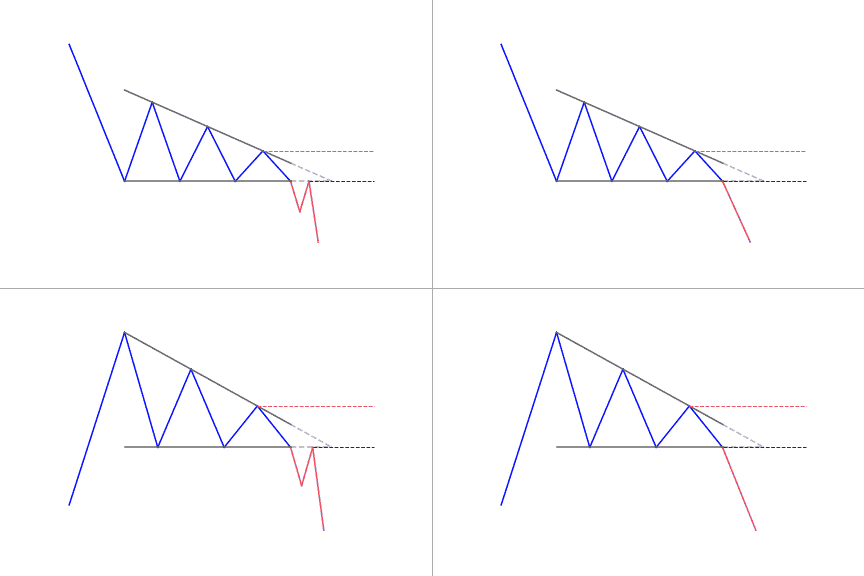
A descending triangle forms with an horizontal resistance and a descending trendline from the swing highsTraders can use the descending triangle pattern as a signal to enter a short position at breakdownThe opposite technical pattern is the ascending triangle What is...
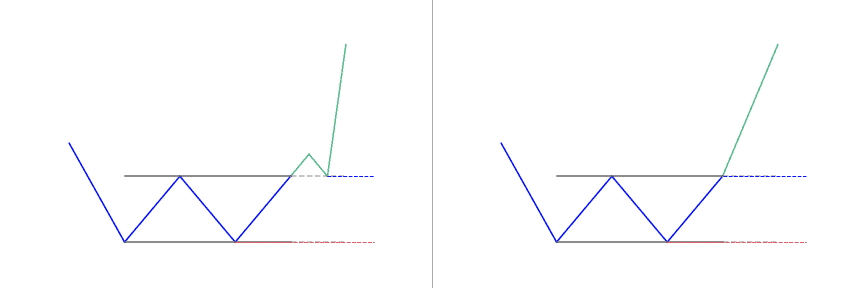
The double bottom looks like the letter "W"Price touches twice a support levelThe double bottom pattern follows a downtrendIt signals the reversal and the beginning of a potential uptrend What is a Double Bottom classical pattern? A double bottom pattern is a classic...
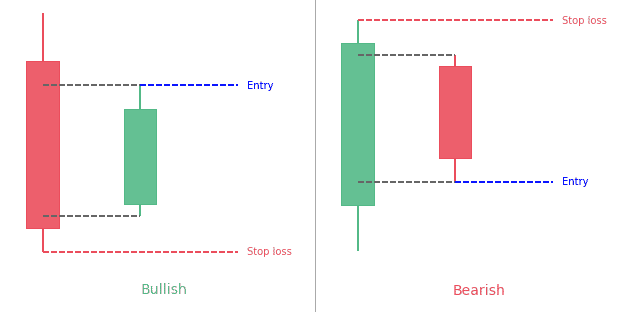
The Harami pattern is a 2-bar reversal candlestick patternThe 2nd bar is contained within the 1st one Statistics to prove if the Harami pattern really works What is the Harami candlestick pattern? Even though the word Harami appears...
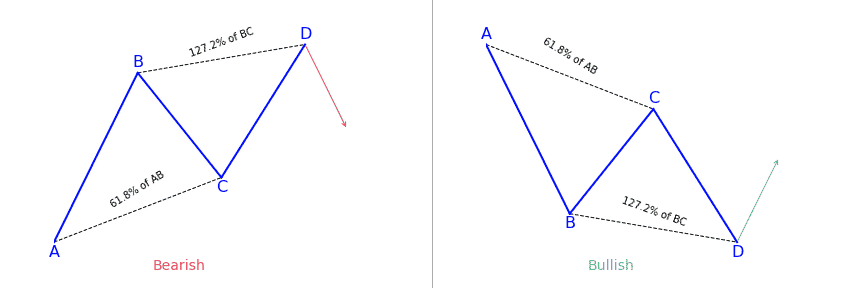
The AB=CD harmonic is reversal patternDepending on the context, it can be bullish or bearishIt should follow specific fibonnaci ratios : BC is the 61.8 percent Fibonacci retracement of ABCD is the 127.2 percent Fibonacci extension of BC Interested in learning more...
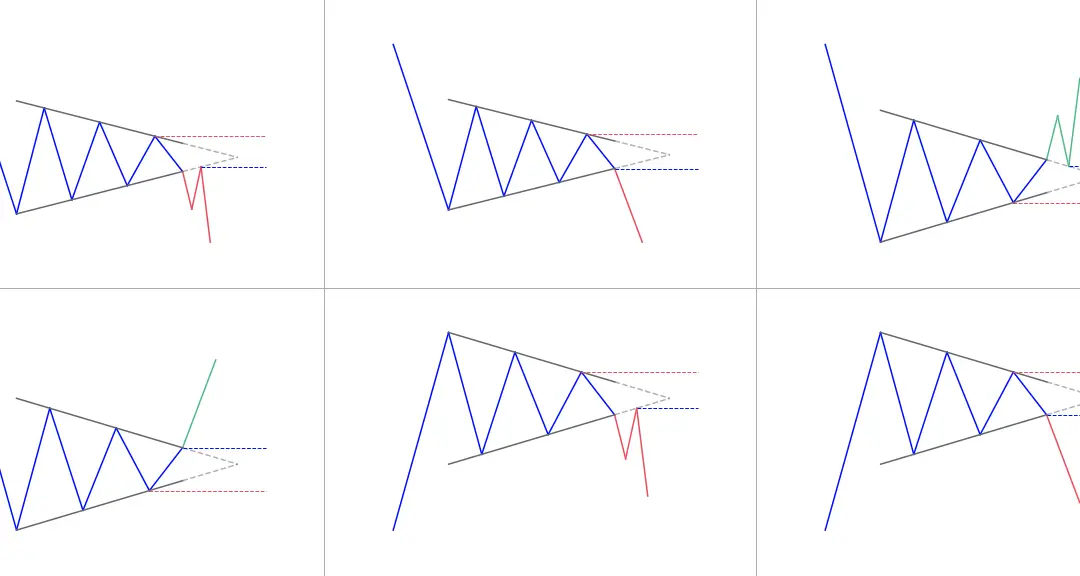
A symmetrical triangles forms when the price of a security consolidates between two trend lines with similar slopesIt can break in both directions, up or downThe symmetrical triangle helps frame your entry, stop and target What is the Symmetrical Triangle pattern?...
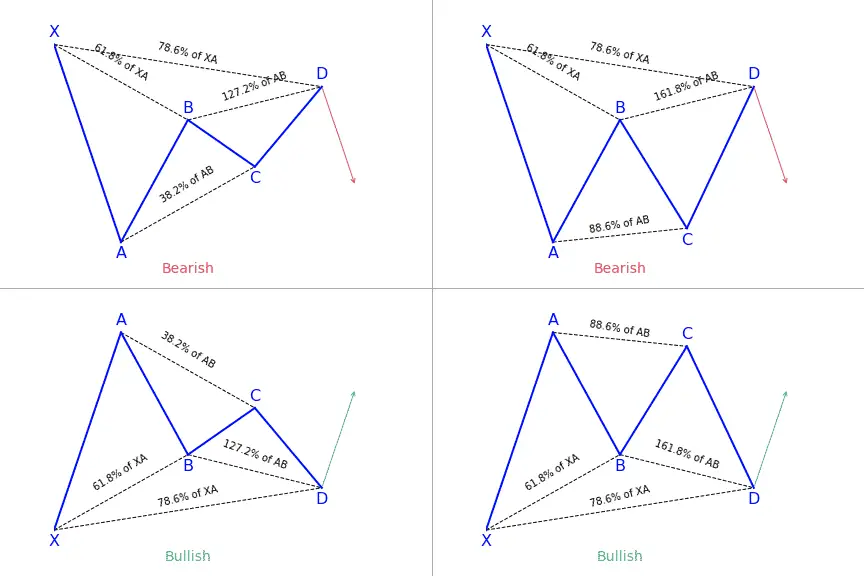
The Gartley pattern is a 4-legged harmonic patternIt can be bullish or bearish It follows clear fibonacci levels (see the Gartley ratios paragraph for detail) Interested in learning more about harmonics pattern in general?You'll love this two courses I shortlisted for...
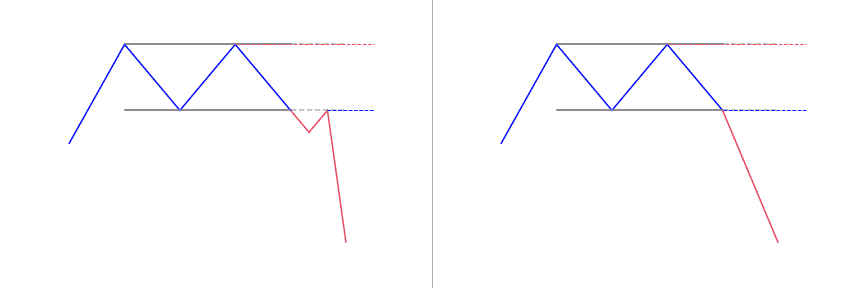
The double top looks like the letter "M"Price touches twice a resistance levelThe double top pattern follows an uptrendIt signals the reversal and the beginning of a potential downtrend What is the Double Top pattern? A double top is a very bearish technical reversal...
![Ascending Triangle Pattern: Full Guide [2022]](https://patternswizard.com/wp-content/uploads/2020/05/ascendingtriangle.png)
The ascending triangle pattern is a continuation pattern. Price typically breakout in the direction of the prevailing trend.It forms between a horizontal resistance and an upward slope trendlineIt helps traders frame their trade, giving an entry, stop and target If...
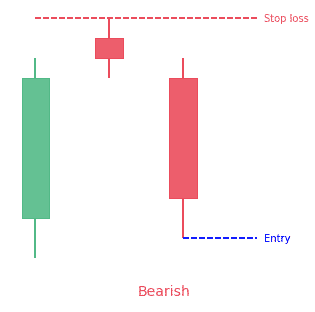
An evening star pattern is a bearish 3-bar reversal candlestick patternIt starts with a tall green candle, then a small candle and finishes with a tall red candleThe middle candle reports indecision in the marketThe opposite pattern is the morning star pattern...
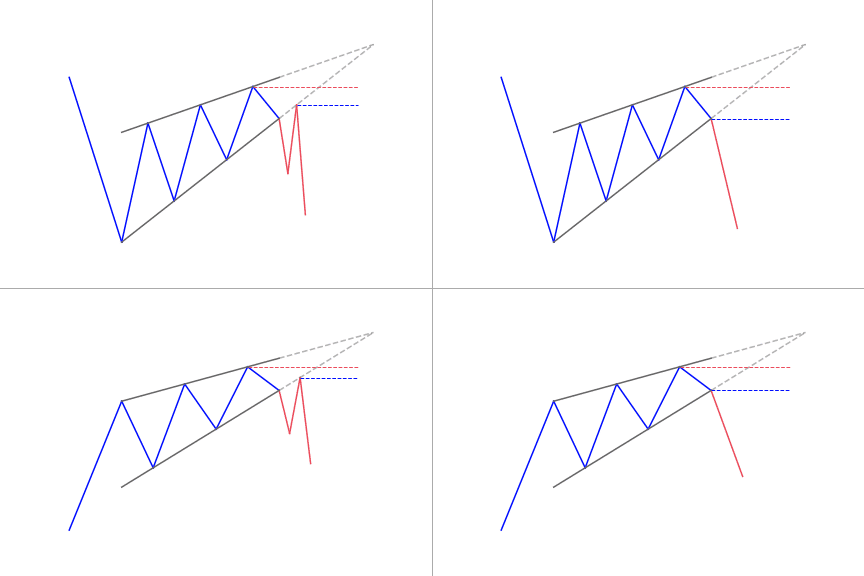
A rising wedge forms when two converging upward slope trendlines encapsulate the priceIt is a bearish pattern What is a Rising Wedge? Rising wedge is a popular reversal pattern that can easily be predicted in nature. It offers clues to traders on the direction and...
![Dark Cloud Cover Candlestick Pattern: The Ultimate Guide [2022]](https://patternswizard.com/wp-content/uploads/2020/05/darkcloudcover-bearish.png)
The dark cloud cover is a 2-bar bearish reversal candlestick patternIt starts with a green candle The second candle opens above the first one (gap) but then closes below the midpoint of the prior bullish candleBoth candles show be quite large Statistics to prove if...
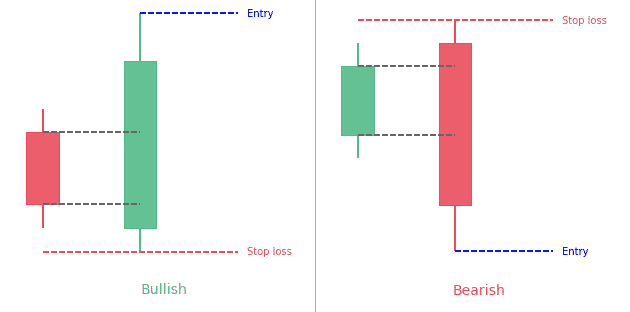
An engulfing pattern is a 2-bar reversal candlestick patternThe first candle is contained with the 2nd candleA bullish engulfing pattern has a red candle engulfed within a green candleA bearish engulfing pattern has a green candle engulfed within a red candle...
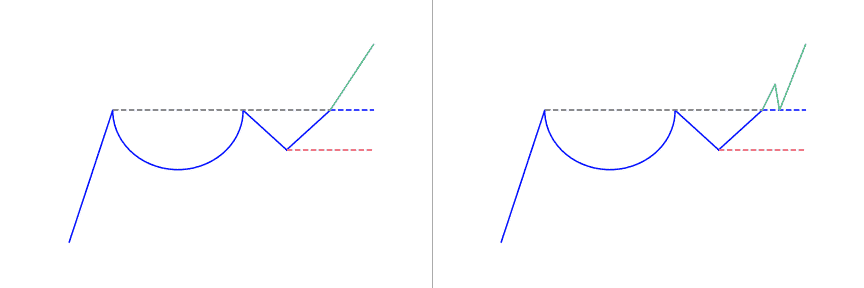
Chart patterns usually occur when the cost of an asset goes towards a direction that a common shape, like a rectangle, triangle, head and shoulders, or in this case, a cup and handle pattern. These patterns are great ways to trade visually. They offer a logical point...
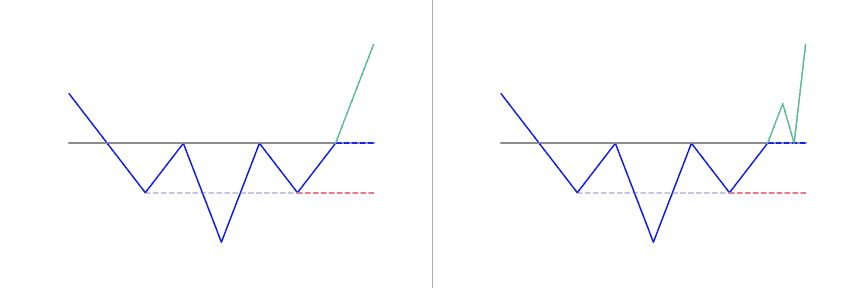
Traders apply charts when studying various patterns in market trends, including the inverse head and shoulders pattern. This pattern is characterized by three troughs (both the upward head and shoulders have peaks), with the middle trough being the deepest. An inverse...
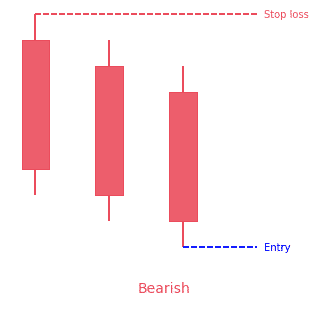
The three black crows is a 3-bar bearish reversal patternThe pattern consists of 3 bearish candles opening above the previous one and closing below the midpoint of the previous candleEach candle should be relatively large to show the strong participation Statistics to...
![Falling Wedge Pattern: Ultimate Guide [2022]](https://patternswizard.com/wp-content/uploads/2020/05/fallingwedge.png)
Out of all the chart patterns that exist in a bullish market, the falling wedge is an important pattern for new traders. It is a very extreme bullish pattern for all instruments in any market in any trend. Depending on the educator and educational material you’ve read...
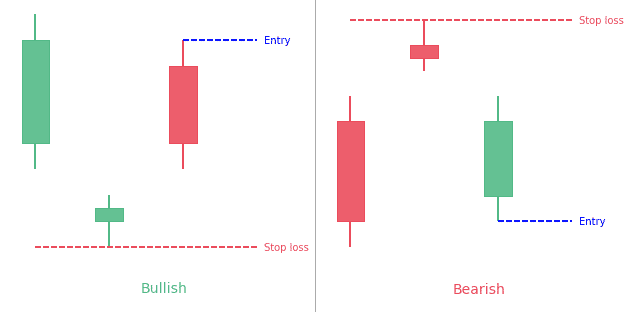
The abandoned baby pattern is a 3-bar reversal pattern.The bullish abandoned baby follows a downtrend. It has a big red candle, a gapped down doji and then a big green gapped up candle.The bearish abandoned baby follows an uptrend. It has a big green candle, a gapped...
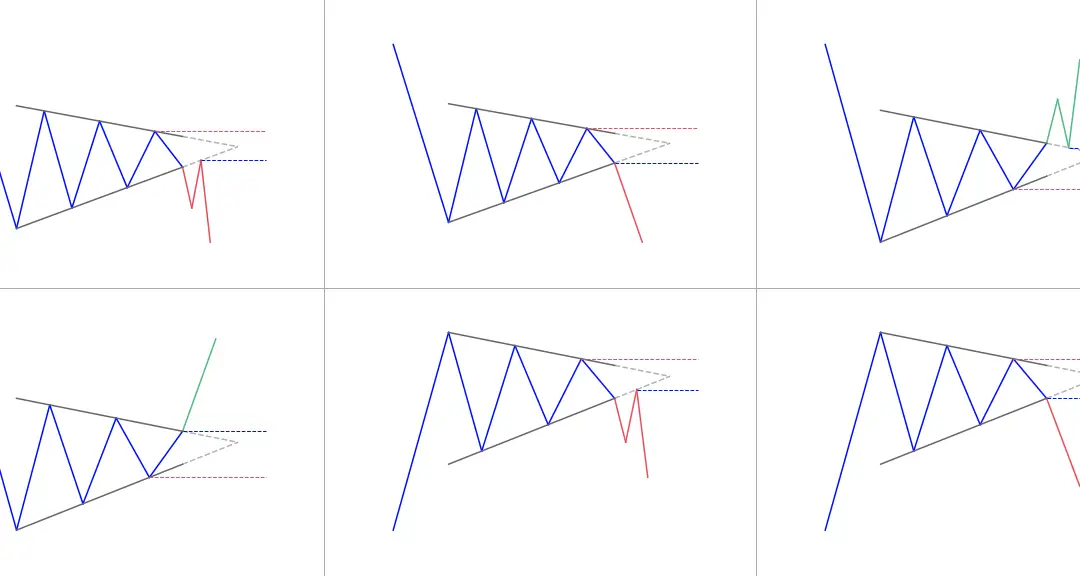
The pennant pattern is a continuation pattern.The pennant shows a time of consolidation before to (likely) continue of the same trend with a breakout.The consolidation period should have lower volume and the breakouts should occur on higher volume. What is the Pennant...
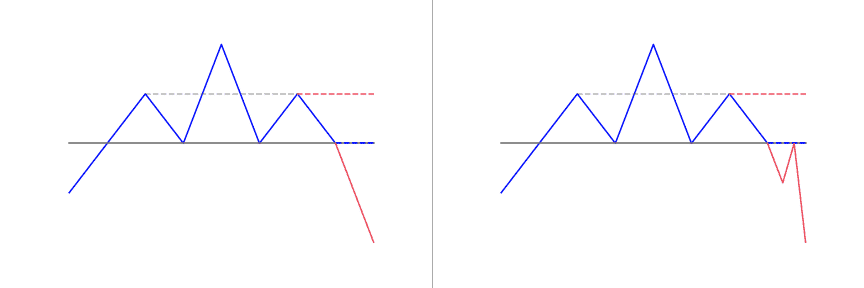
Recognizing chart patterns is one of the most reliable techniques for trading the market. There are various chart formations that traders can observe and apply to their arsenal. Today, we will go through one of the most dependable chart patterns: the head and...
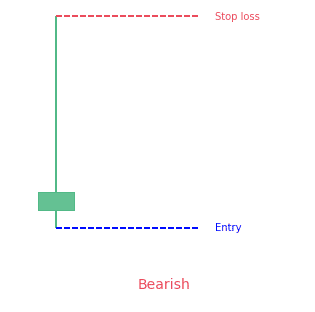
The shooting star is a 1-bar bearish reversal candlestick patternThis formation is bearish because the price tried to rise sharply throughout the day, but then the seller took over and pushed the price down to the opening price Statistics to prove if the Shooting Star...
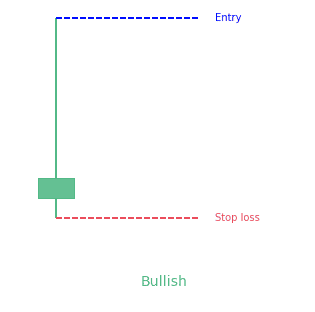
The inverted hammer is a 1-bar bullish candlestick pattern.It looks like a letter "T" upside-down. Statistics to prove if the Inverted Hammer pattern really works What is the Inverted Hammer candlestick pattern? As far as the...
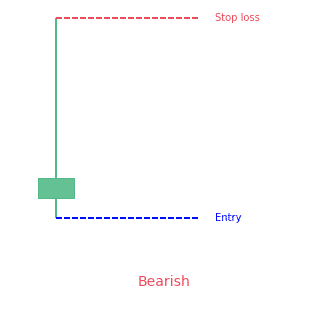
The Gravestone Doji Candlestick Pattern is one of the fabulous and versatile patterns in trading. It an interesting bearish trend reversal candlestick pattern. Some traders, use this pattern in their daily lives to learn about the feel of the market. The article is...
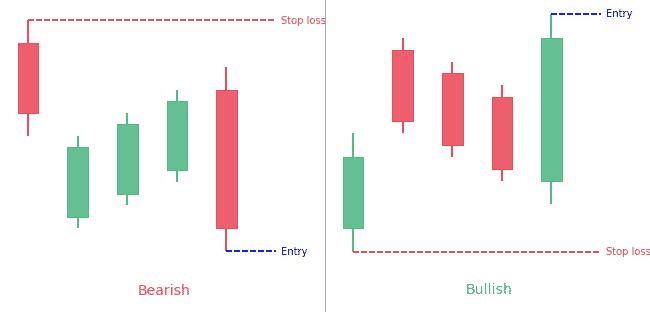
The Mat Hold candlestick pattern is a 5-candle patternIt can be bullish or bearish depending on its formationFor the bullish pattern, there is a tall green candle, 3 small red candles and the last candle is a tall green candle closing above the patternFor the bearish...
![Crab & Deep Crab Harmonic Pattern: The ultimate guide [2022]](https://patternswizard.com/wp-content/uploads/2020/06/crab.png)
Harmonic trading is a kind of technical analysis generally used across futures, stocks and forex. Harmonic trading makes use of particular price patterns which are subject to alignment of specific Fibonacci extension and retracement levels. As a result of the...
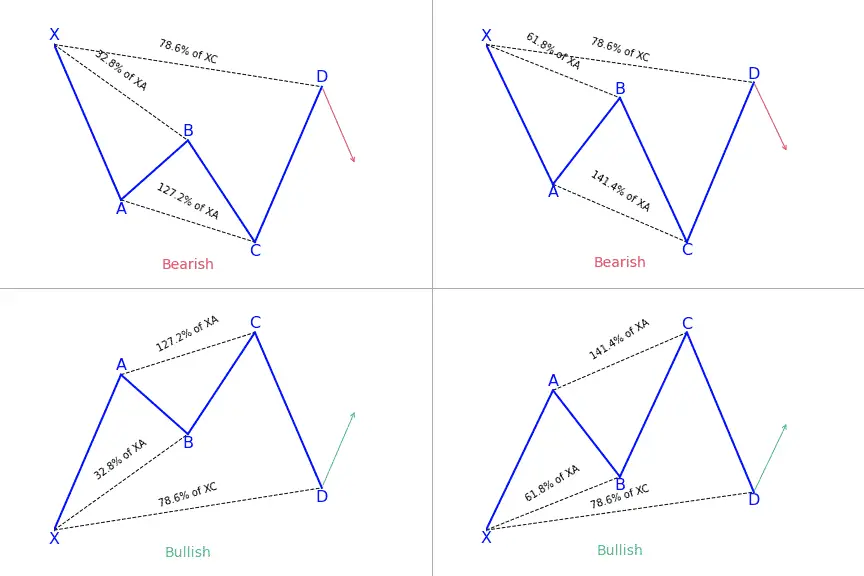
The cypher pattern trading strategy teaches traders how to correctly trade and draw the cypher pattern. The cypher harmonic pattern can be used on its own and provide traders a profitable forex trading strategy. It is not surprising that geometric patterns are used in...
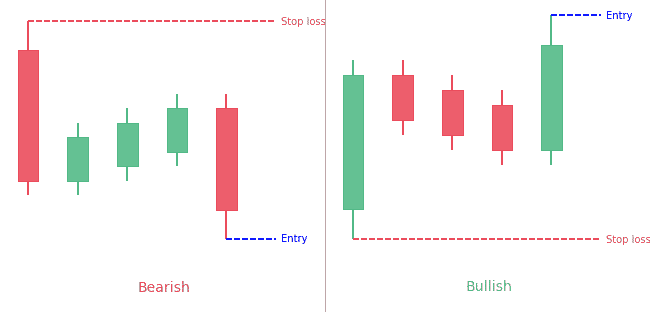
Candlestick patterns have become the preferred method of charting for a lot of traders. Their colorful bodies make it simple to spot market action and patterns that could hold predictive value; they also form patterns that have various meanings. One pattern is the...
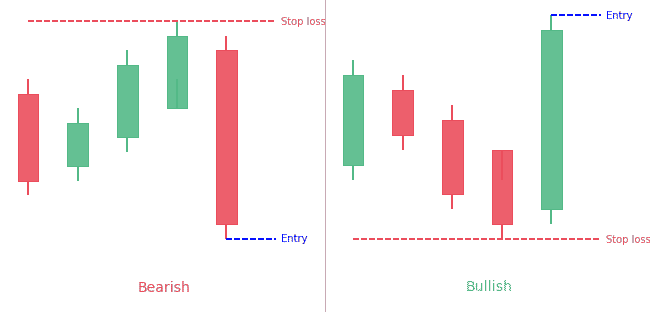
Trading price action usually brings about surprise and excitement at the same time. Price is commonly used as a base for any technical analysis, and the hikkake trading strategy takes in consideration three price action bars to identify the pattern. The pattern looks...
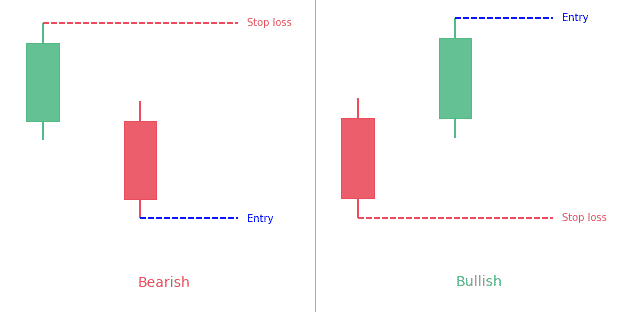
Traders have applied candlestick patterns in analyzing the movement of a market. One of such patterns is the separating lines candlestick pattern. The pattern comes up when there's an uptrend in the market and when there's also a pullback. The separating lines...
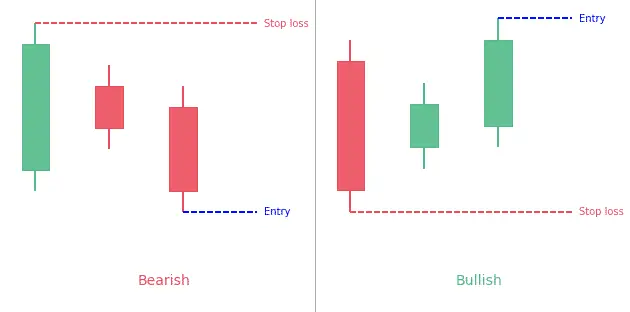
To interpret candlestick patterns, you need to look for particular formations. These candlestick formations assist traders know how the price is likely to behave next. In this article, we will go in-depth into the Three Inside Up / Down candlestick pattern. Some...
![Three-Line Strike Pattern: Complete Guide [2022]](https://patternswizard.com/wp-content/uploads/2020/06/threelinestike.png)
Recognizing patterns is a necessary aspect of technical analysis. Traders should make sure that if they have a moment of doubt, they can act on a situation if they have seen it before. In this article, we will cover in-depth the Three Line Strike candlestick pattern....
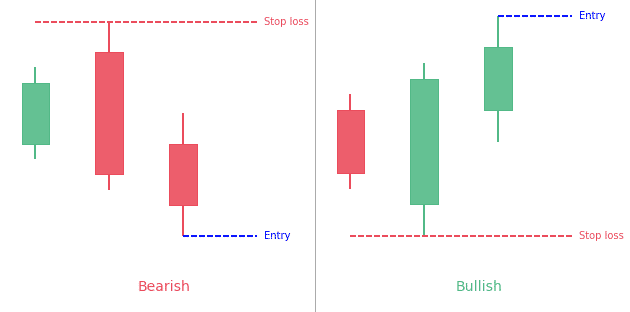
The Three Outside Up & Down candlestick patterns are 3-bar opposite reversal patterns.They are made of one up or down candle and then 2 candles of the opposite color.The second candle contains the first one.The third candle closes over (for the bullish formation)...
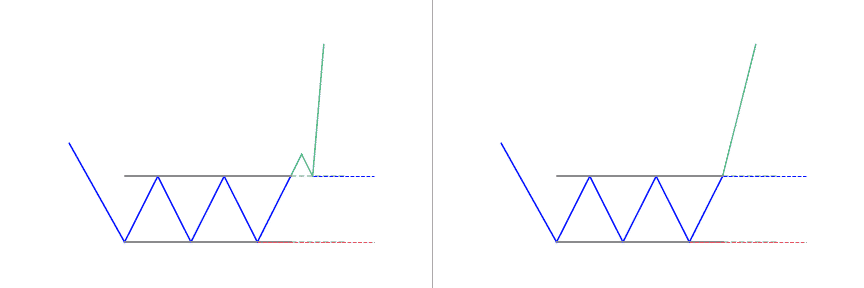
The triple bottom pattern is a bullish reversal pattern. It's created when price bounces off support 3 time at similar levels.It's a sign the buyers are coming in the market to avoid the security price to drop lower. What is the Triple Bottom pattern? The Triple...
The dragonfly doji candlestick pattern is a 1-candle bullish pattern.It looks like the letter "T".It prints when the candle as a long bottom shadow but (almost) no upper shadow and open and close are almost the same. Statistics to prove if the Dragonfly Doji pattern...
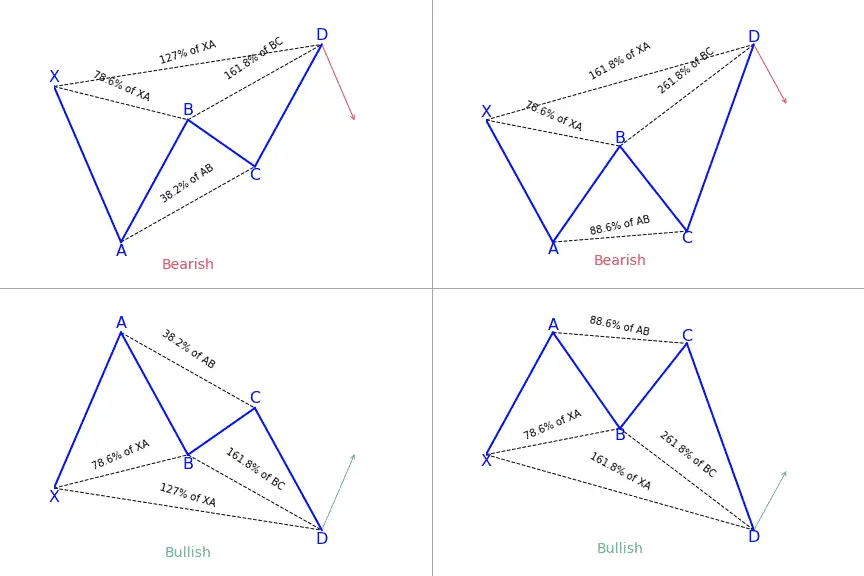
When you decide to trade, the secret to becoming successful is in reading patterns. Harmonic price patterns take geometric price patterns to the next level by applying Fibonacci numbers to define specific turning points. Unlike other more trading processes, this...
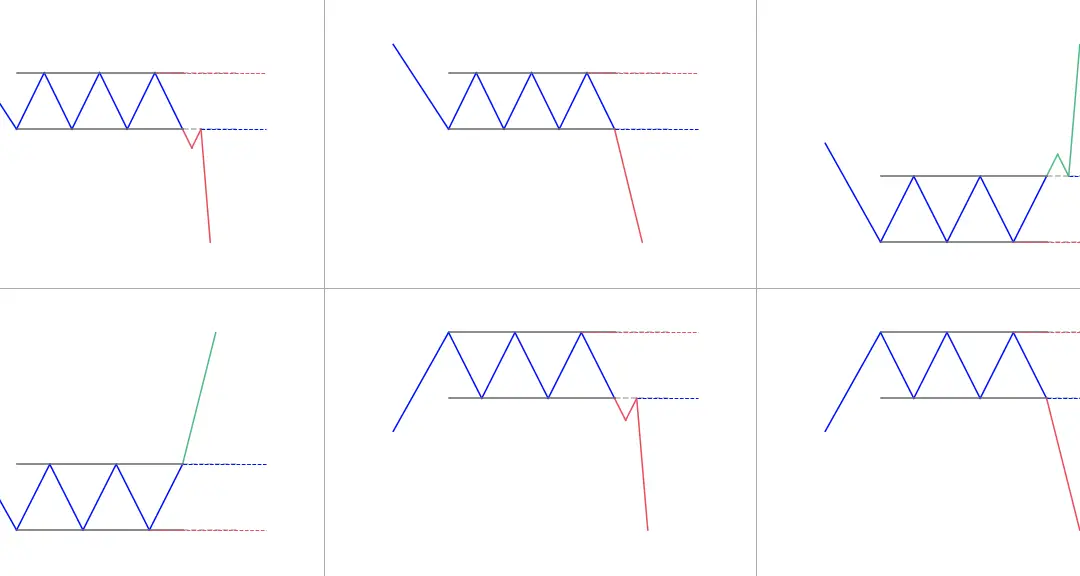
The Rectangle pattern is bullish or bearish depending on the direction of the breakoutIt forms when price oscillates between a horizontal support and resistance. What is the Rectangle pattern? The rectangle formation is a classical technical analysis pattern shown by...
![Shark Harmonic Pattern: Full Guide [2022]](https://patternswizard.com/wp-content/uploads/2020/06/shark.png)
When it comes to harmonics, trading forex is very similar to the animal world. After crabs and butterflies, sharks have come to share their name with popular five-point patterns used in trading. A very new pattern, the shark harmonic pattern, was discovered by Scott...
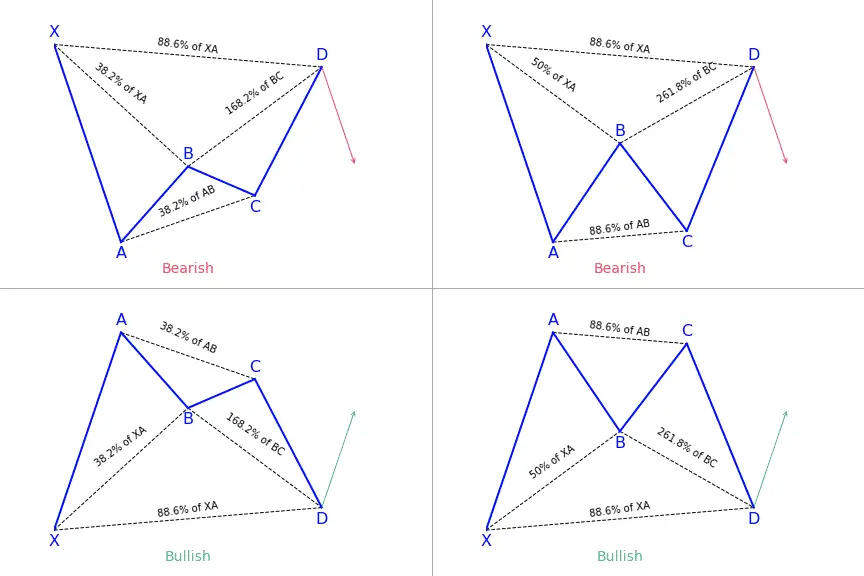
The Bat harmonic pattern is close to the Gartley pattern. It is a retracement and continuation pattern that comes up when a trend temporarily changes its direction but then continues on its original course. The Bat harmonic pattern is a reversal pattern.It follows...
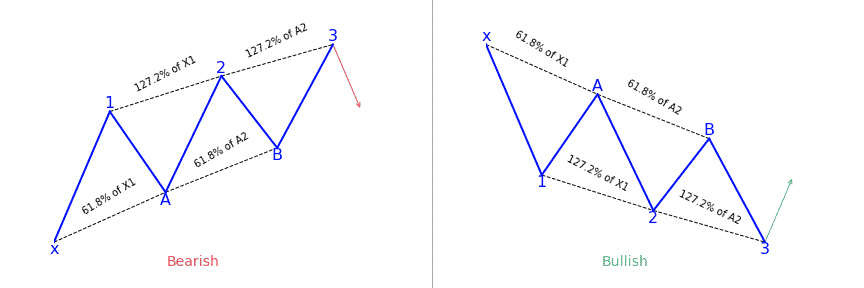
Trading with technical analysis demands traders to depend mostly on a mixture of technical indicators and trade based on the signals from this approach. Apart from using technical indicators, traders also utilize chart patterns to base their trading decisions, whether...
![Key Reversal Bar Pattern: Complete guide [2022]](https://patternswizard.com/wp-content/uploads/2020/06/keyreversalbar.png)
Most times, traders take a 'ready, fire, aim' process to trade which is a backward way of trading. Trade is different from a trade trigger. A trade setup that most traders are always on the lookout for is a key reversal bar pattern combination. It forms when prices...
![5-0 Harmonic Pattern: Complete guide [2022]](https://patternswizard.com/wp-content/uploads/2020/06/5-0.png)
The 5-0 pattern is a reversal harmonic pattern.It follows specific fibonacci ratios (which you can read more below) Interested in learning more about harmonics pattern in general and you prefer videos to text?You'll love this two courses I shortlisted for you on...
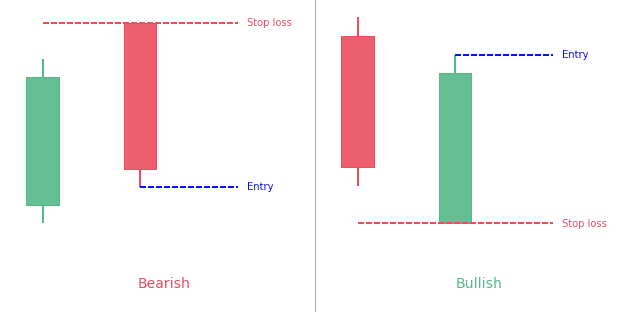
All patterns have a unique tale to tell about market forces that lead to its formation. And traders might benefit by trying to identify what drove the market to where it is now. Knowing exactly why a market carried out a particular move is almost impossible. Having...
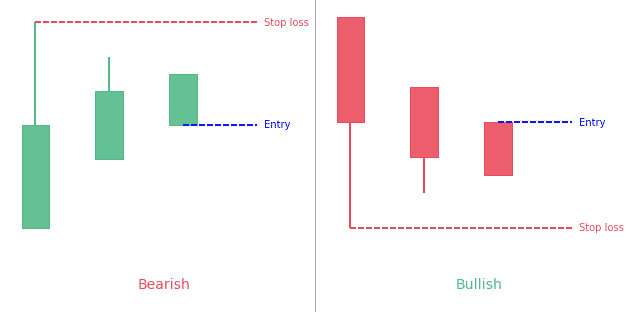
The Three Stars in the South candlestick pattern is a very rare pattern that doesn't typically precede large price moves.The bullish pattern forms with three black or red (down) candles of decreasing size. It usually follows a price decline.The bearish pattern forms...
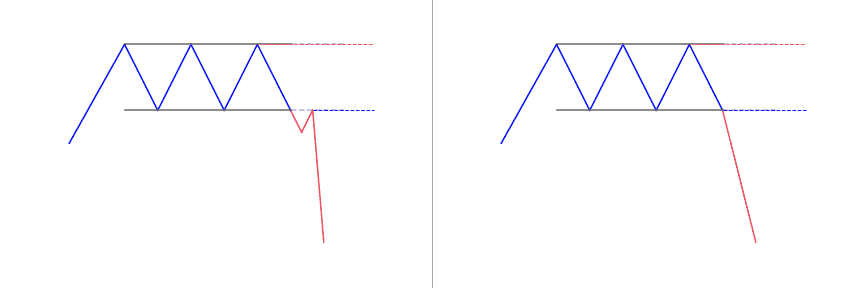
The triple top pattern is a bearish reversal pattern.It's created when price bounces off resistance 3 time at similar levels.It's a sign the sellers are coming in the market to avoid the security price to shoot higher. What is a Triple Top pattern? Triple top is a...
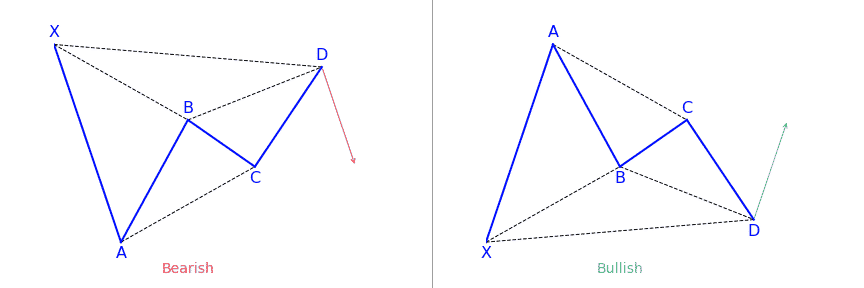
Chart patterns provide so many smart ways of applying harmonic patterns in your chart. Some of them are fully automated approaches and some of them are semi-automated approaches. One of them is using the XABCD harmonic chart pattern. The XABCD harmonic is a group of...
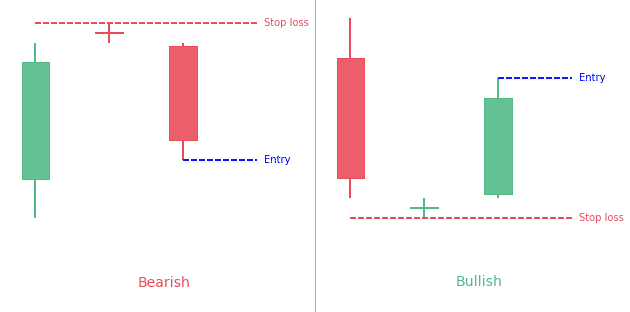
A Doji Star candlestick pattern is a three-bar pattern. It is considered as a signal of a potential upcoming reversal of the current trend of the market. It is a versatile candlestick pattern that is found in two variants, bullish and bearish. Its variants depend on...
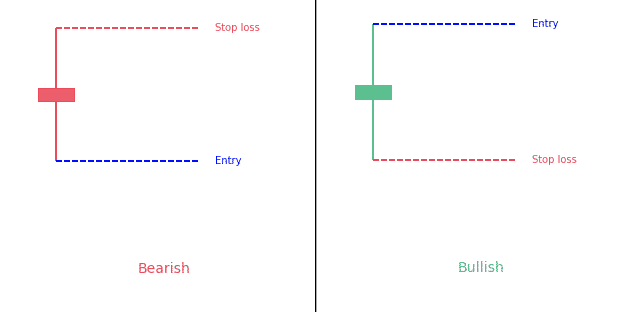
Candlestick patterns that have the same opening and closing price are known as "Doji candlestick pattern". There are four basic types of Doji candles: Four-Price DojiLong-legged DojiDragonfly Doji Gravestone Doji The Doji Candlestick is a 1-bar neutral...
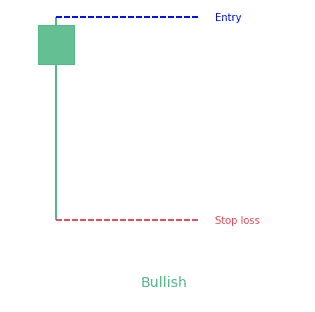
The Hammer candlestick pattern is a bullish reversal pattern that indicates a potential price reversal to the upside. It appears during the downtrend and signals that the bottom is near. After the appearance of the hammer, the prices start moving up. Hammer...
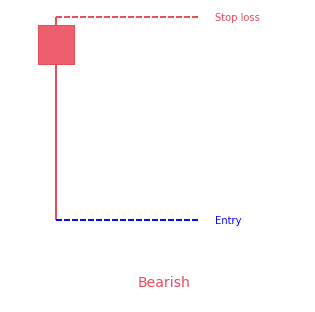
As the name suggests, the Hanging Man candlestick pattern is a bearish sign that appears in uptrends. On occasions, it also tells traders about the upcoming price reversal. The experts of the domain suggest that the Hanging Man pattern must be taken as a warning, not...
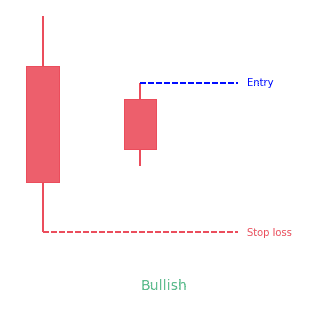
The Homing Pigeon candlestick pattern is a two-line candlestick pattern. Traditionally, traders consider it a bullish reversal candlestick pattern. However, testing has proved that it may also act as a bearish continuation pattern. This new development proves it to be...
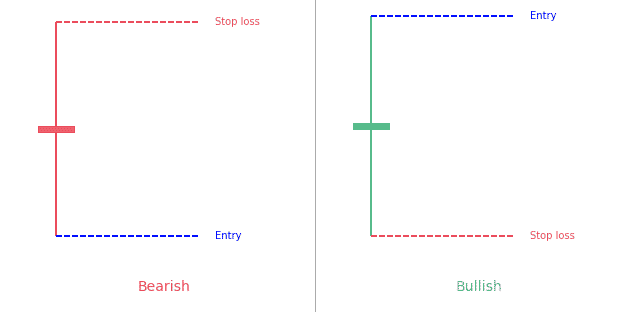
Candlestick patterns are becoming more and more popular these days for charting prices. They are easy to detect with their colorful bodies and black wicks and easy to observe the ways and the behavior of the market. One such popular candlestick pattern is the...
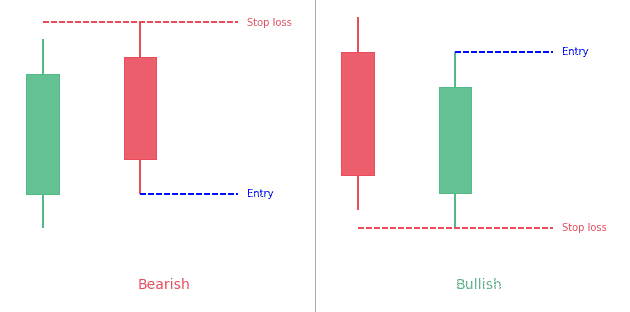
A Piercing line candlestick pattern is a two-day bullish candlestick reversal pattern that appears in a downtrend. It signals a potential short term reversal from downwards to upwards. It consists of two major components, a bullish candle of day 2 and a bearish candle...
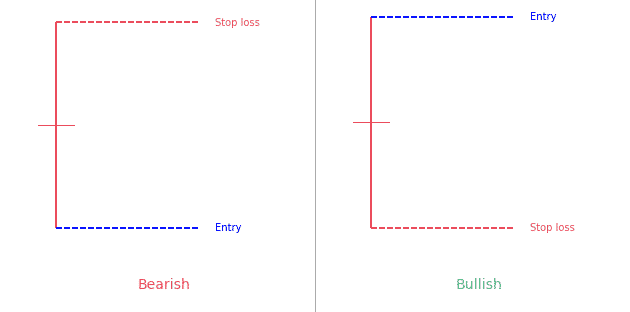
The Rickshaw Man candlestick pattern is very similar to the Long-Legged Doji pattern. A Long-Legged Doji pattern is the one that has a closing and opening price happening at or in the middle of the shadows. The high and low prices are far apart and make very long...
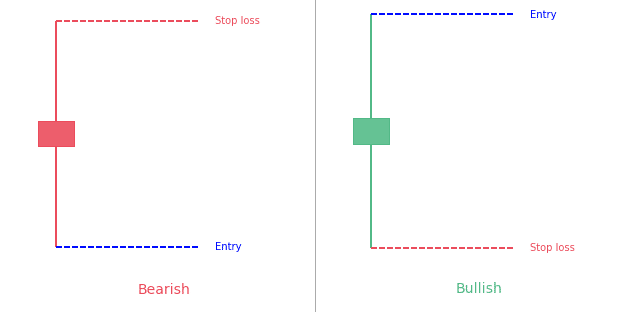
The Spinning Top candlestick pattern is a versatile single candle pattern. It is versatile and mysterious because of its formation that can occur at the peak of an uptrend, in the very middle of a trend, or at the bottom of a downtrend. It is a small candlestick...
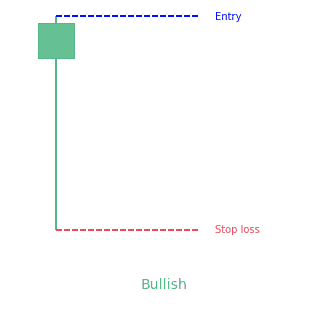
The Takuri candlestick pattern is a single candle bullish reversal pattern. It has a very small body with a much longer lower wick and without an upper wick. This pattern illustrates how a downtrend is opposed by the bulls and the candle eventually closes near its...
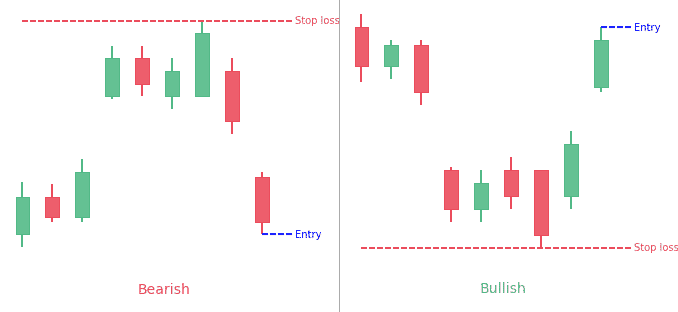
An Island Reversal Pattern appears when two different gaps create an isolated cluster of price.It usually gives traders a reversal biais. What is the Island Reversal candlestick pattern? The Island Reversal candlestick pattern is a fantastic candlestick pattern that...
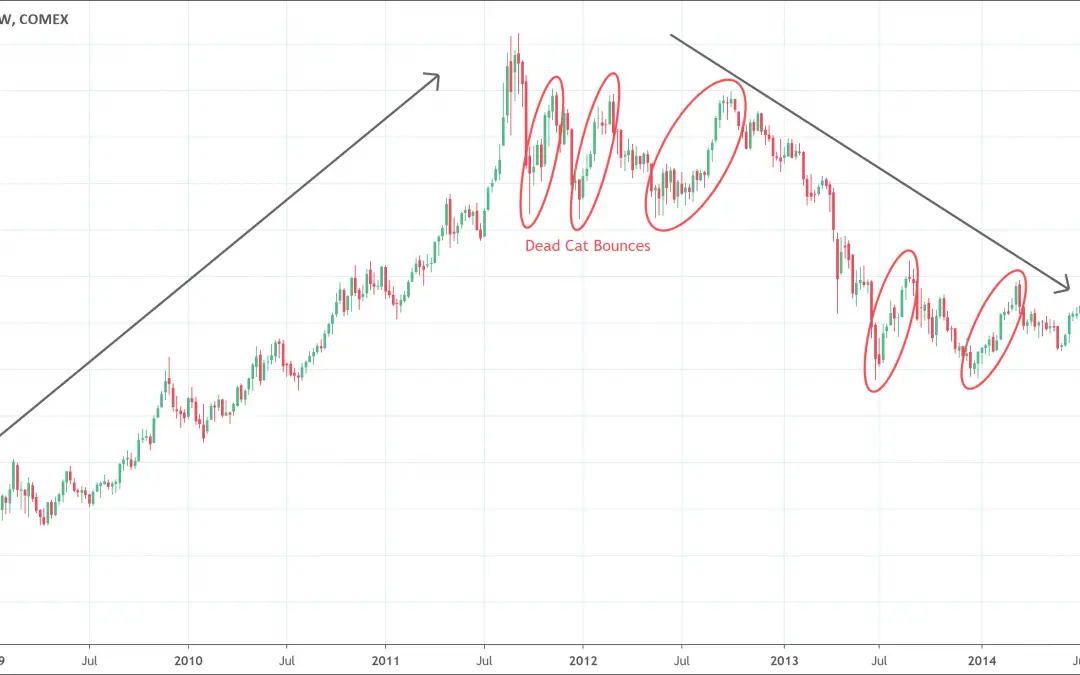
The dead cat bounce pattern is a specific stock chart phenomenon that occurs during a long downtrend.It is a short term reversal bounce that takes place in the context of a very long downtrend.In simple words, the pattern is a correction of a long bearish trend. The...
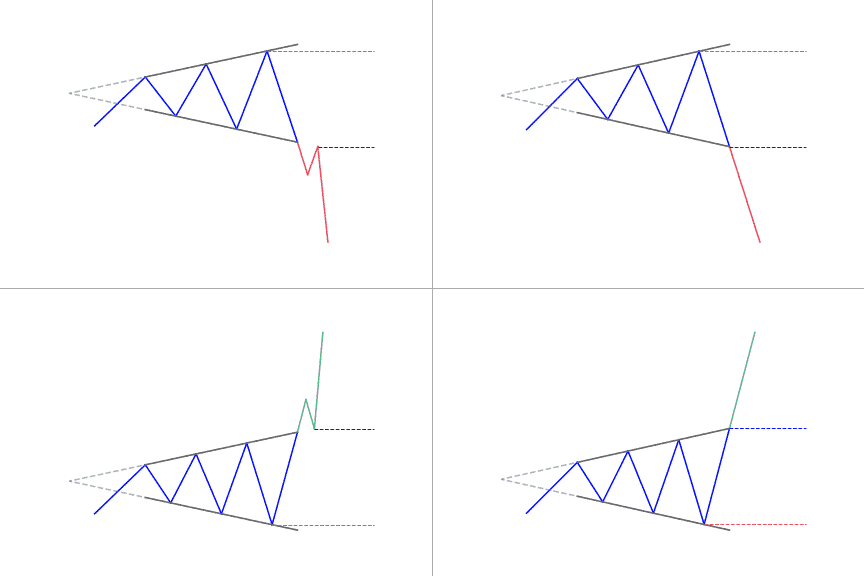
The broadening top pattern is a bearish reversal pattern.It's tougher to trade than other classical patterns as lows and highs get taken out one by one.It can also be called the "megaphone pattern". What is the broadening top pattern? The broadening top pattern...
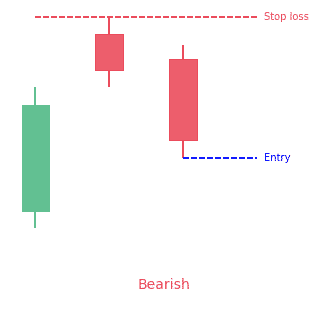
The Two Crows candlestick pattern is a three-line bearish reversal pattern.How to identify the pattern:The market must be in an uptrend. The first candle must be a long white candle. The second candle is a short black candle that starts with an...
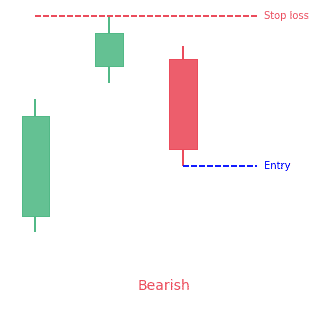
The upside gap three methods candlestick pattern is a 3-bar bearish continuation pattern.It has 2 green candles and a red one.The second candle gaps above the first one. Statistics to prove if the Upside Gap Three Methods pattern really works [displayPatternStats...
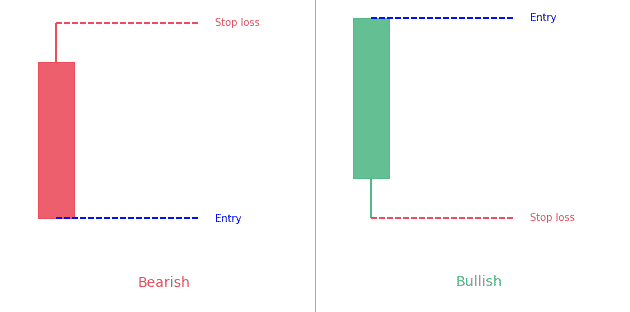
The Closing Marubozu is a 1-bar continuation candlestick pattern.It's a long candle close at it's high (bullish) or low (bearish). Statistics to prove if the Closing Marubozu pattern really works What is the Closing Marubozu...
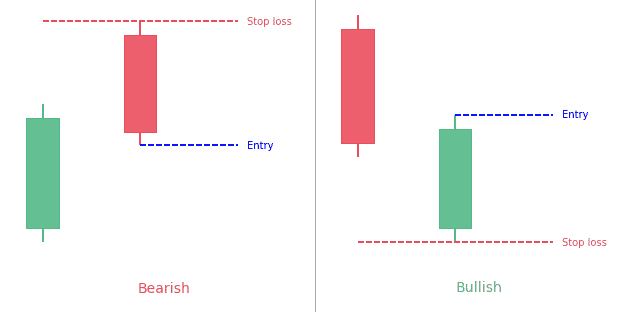
The Thrusting candlestick pattern is a two-bar pattern.The second candle gaps up/down and then retrace to close within the 1st candle's body. Statistics to prove if the Thrusting pattern really works What is the Thrusting...
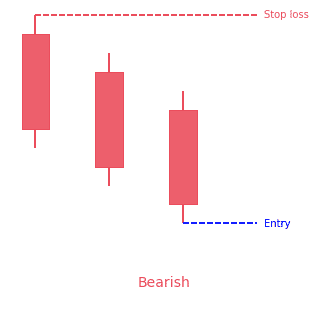
The identical three crows candlestick pattern is a 3-bar bearish reversal pattern.It occurs during an uptrend.It is made of three consecutive bearish candlesticks. Statistics to prove if the Identical Three Crows pattern really works [displayPatternStats...
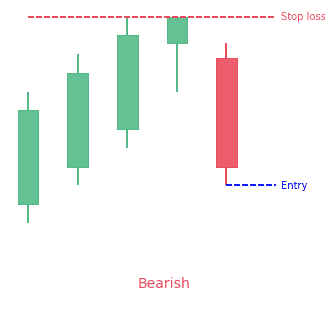
The Ladder Top candlestick pattern is a 5-bar bearish reversal pattern that appears at the end of a bullish trend.You can identify it with the following characteristics: The first three candles are always white with long real bodies opening and closing above the open...
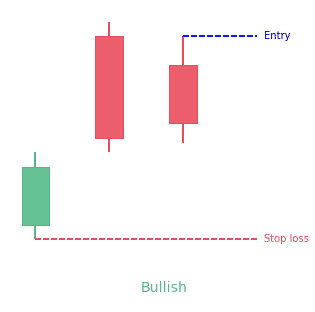
The up-gap side by side white lines candlestick pattern is a 3-bar bullish continuation pattern.The first and second lines are separated by a bullish gap. Statistics to prove if the Up-Gap Side By Side White Lines pattern really works [displayPatternStats...
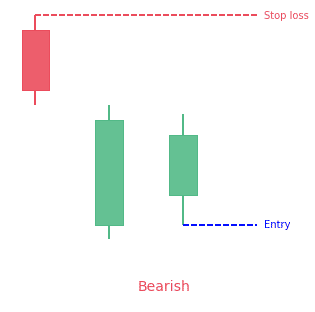
The down-gap side by side white lines candlestick pattern is a 3-bar bearish continuation pattern.It appears during a downtrend. Statistics to prove if the Down-Gap Side By Side White Lines pattern really works What is the...
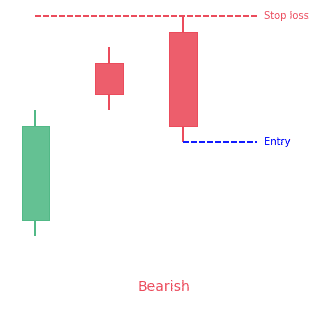
The upside gap two crows candlestick pattern is a 3-bar bearish reversal pattern.It appears during an uptrend. Statistics to prove if the Upside Gap Two Crows pattern really works What is the upside gap two crows candlestick...
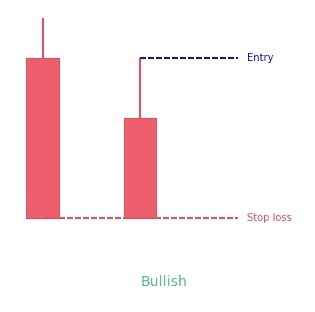
The matching low candlestick pattern is a 2-bar bullish reversal pattern. It occurs during a downtrend.As his name suggests, both lows from the 2 candles are equal. Statistics to prove if the Matching Low pattern really works ...
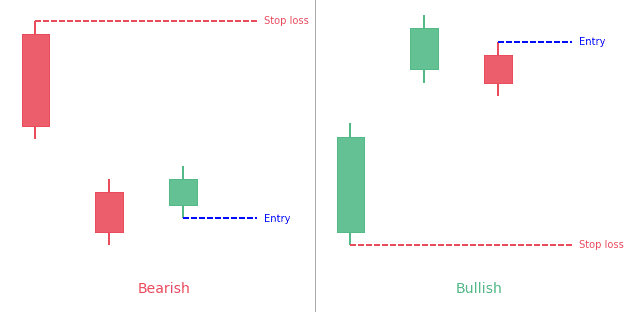
The Tasuki gap candlestick pattern is a three-bar continuation pattern.The first two candles have a gap between them.The third candle then closes the gap between the first two candles. Statistics to prove if the Tasuki Gap pattern really works...
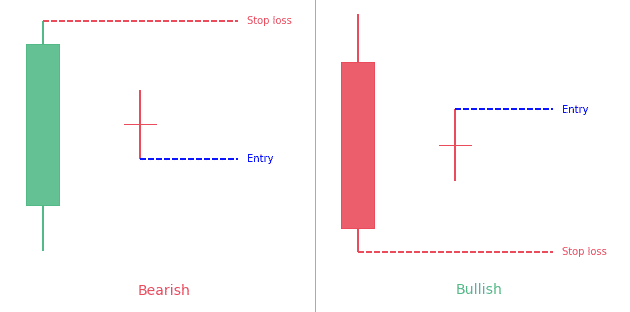
The harami candlestick pattern consists of two candlesticks.The first candle is a big one and the second candle is a doji, contained within the first one's body. Statistics to prove if the Harami Cross pattern really works What...
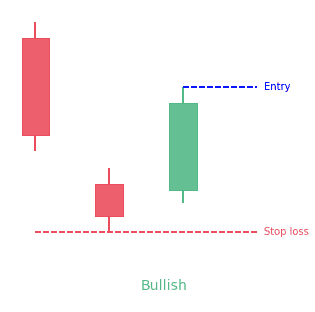
The downside gap three methods is a 3-bar candlestick pattern.It appears during a downtrend.The first two candles have a gap down between them while the third candle covers the gap between the first two. Statistics to prove if the Downside Gap Three Methods pattern...
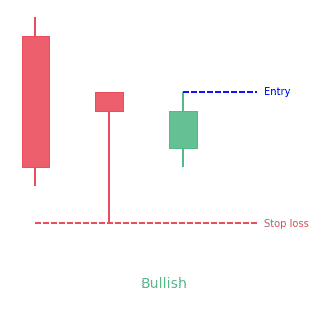
The unique three river bottom candlestick pattern is a bullish reversal pattern.It occurs during a downtrend in the market. Statistics to prove if the Unique Three River pattern really works What is the unique three river...
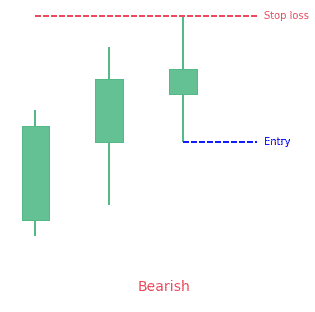
The advance block candlestick pattern is a 3-bar bearish reversal pattern.It has three long green candles with consecutively higher closes than the previous candles.Each candle has a shorter body than the previous one. Statistics to prove if the Advance Block pattern...
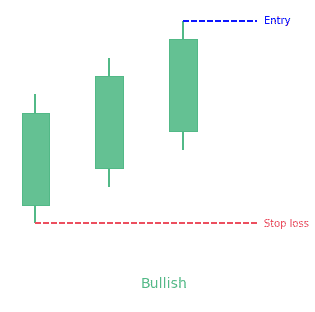
The three white soldiers candlestick pattern is a 3-bar bullish pattern.It has 3 long green candles, each making new higher high.Each candle's body should be approximately the same size. Statistics to prove if the Three White Soldiers pattern really works...
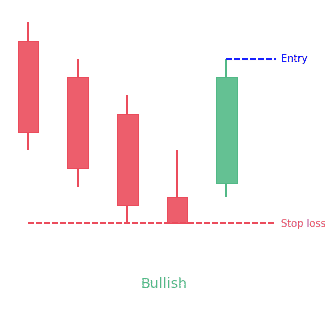
The ladder bottom candlestick pattern is a 5-bar bullish reversal pattern.It forms following these characteristics:The first three long black candlesticks, resembling three black crows formation, with successive lower opens and closeThe fourth is also a black...
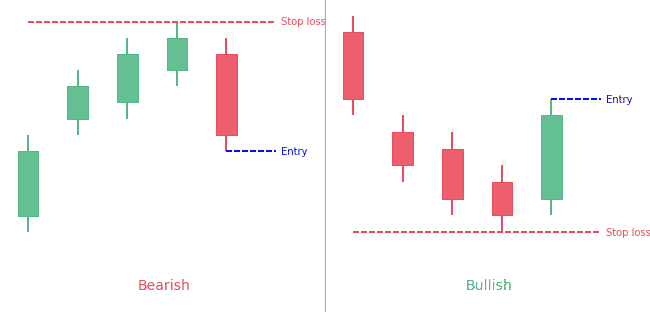
The breakaway candlestick pattern is a five bar reversal candlestick pattern.It can be bullish or bearish.The first candle must be a long candle.The next three candles must be spinning tops. The second candle must also create a gap between the first and...
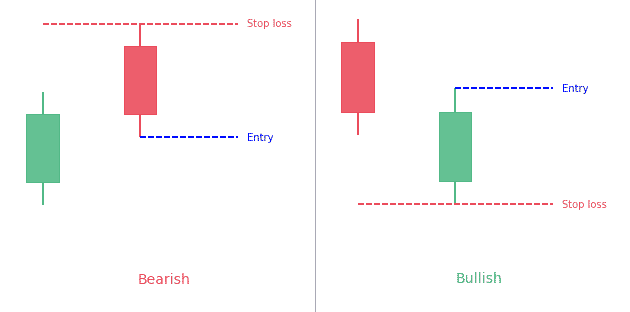
The counterattack candlestick pattern is a reversal pattern that indicates the upcoming reversal of the current trend in the market. There are two variants of the counterattack pattern, the bullish counterattack pattern and the bearish counterattack pattern. The...
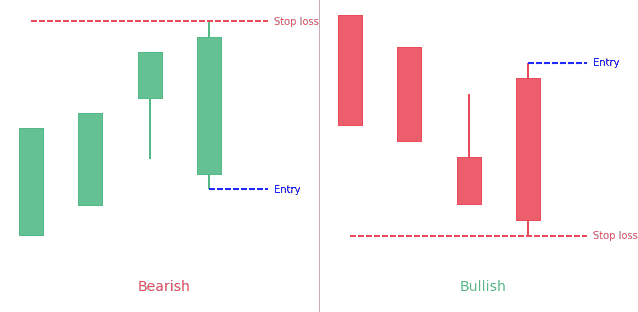
The concealing baby swallow candlestick pattern is a 4-bar bullish reversal pattern.The first candle must be a Marubozu which appears during a trend. The second candle must also be a same color Marubozu. It opens within the body of the previous candle and closes...
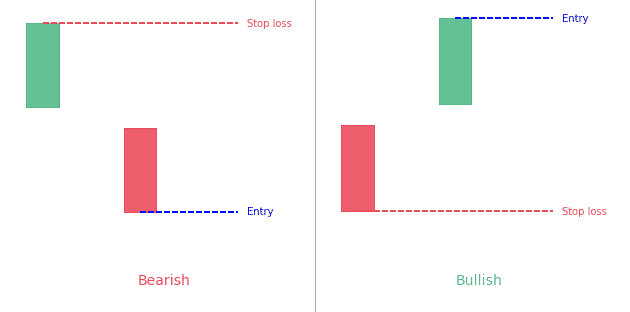
The kicking candlestick pattern is a 2-bar reversal pattern.It is made of two opposite side marubozus separated by a price gap. Statistics to prove if the Kicking pattern really works The kicking candlestick pattern is a two-bar...
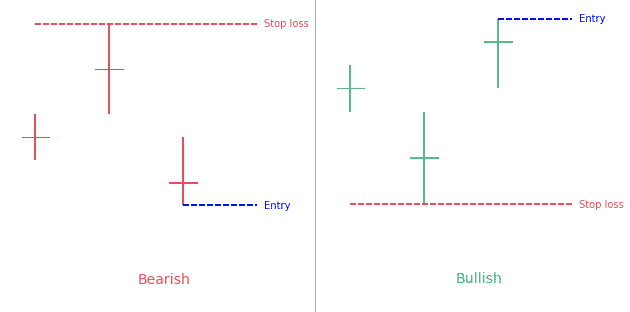
The tri-star candlestick pattern is a 3-bar trend reversal pattern.There must be a clear and defined trend in the market. Three consecutive Doji candles must appear. The second Doji candle must create a gap below the first and third Doji candles creating a...
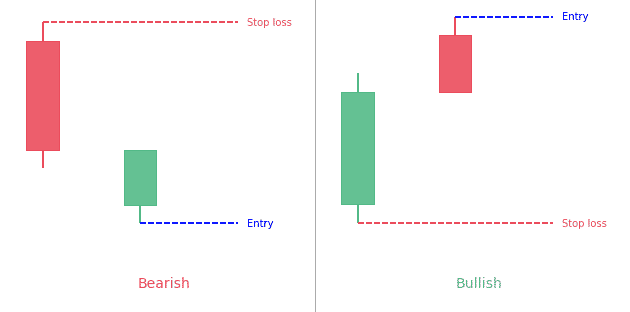
The in-neck candlestick pattern is a 2-bar continuation pattern.Closing prices of both candles are the same or nearly the same forming a horizontal neckline. Statistics to prove if the In-neck pattern really works The in-neck...
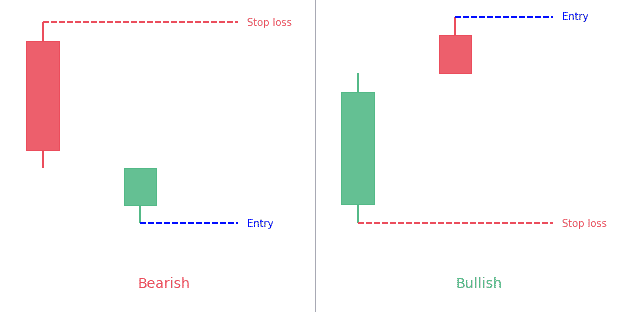
The on-neck candlestick pattern is a 2-bar continuation pattern.Closing prices of the second candle is nearly the same than first candle high/low forming a horizontal neckline. Statistics to prove if the On-neck pattern really works ...
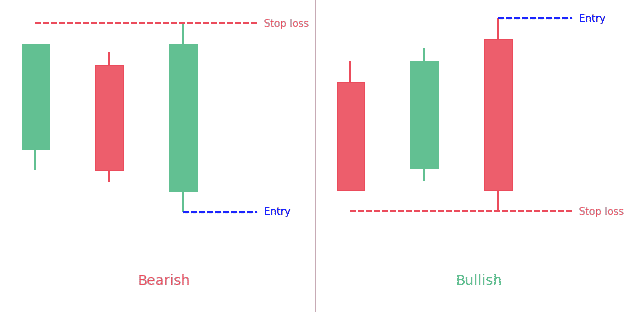
A stick sandwich is a 3-bar pattern.The closing prices of the two candlesticks that surround the opposite colored candlestick have to be the same. Statistics to prove if the Stick Sandwich pattern really works What is the Stick...
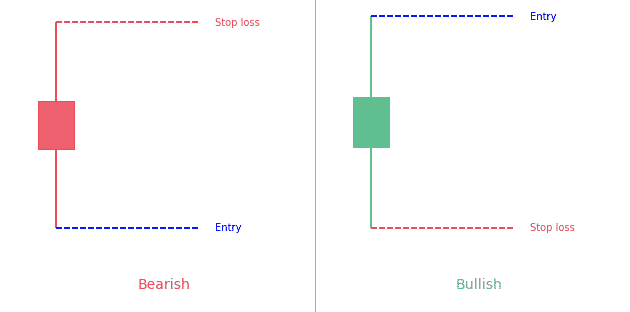
High wave is a 1-bar candlestick pattern that has very long upper and lower shadows and a small real body.It shows indecision in the market. Statistics to prove if the High Wave pattern really works A lot of candlestick traders...
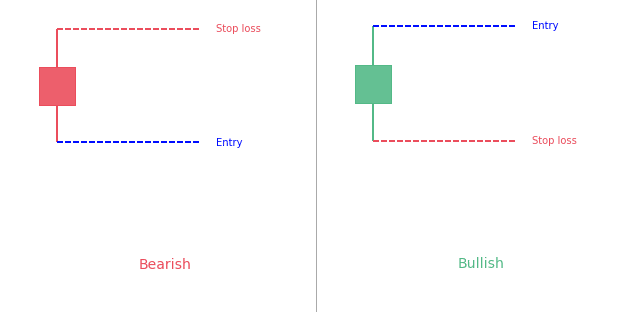
The Short Line candlestick pattern is a 1-bar very simple to understand pattern.It simply consists in a candle with a short body.There are various kind of specific variations of the short line pattern (doji, hammer, hanging man, shooting star). Let's go in-depth about...
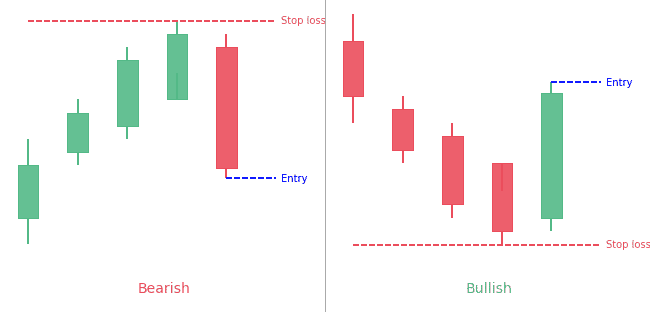
The modified Hikkake candlestick pattern is the more specific and upgraded version of the basic Hikkake pattern.The difference with the normal pattern is that the "context bar" is used prior to the inside price bar. It consists of a context bar, an inside bar, a fake...
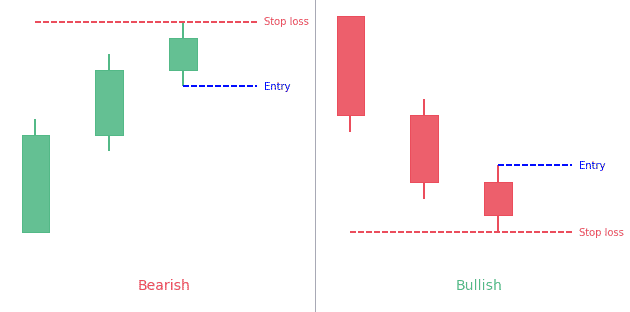
The stalled candlestick pattern is a three-bar pattern that predicts an upcoming reversal of the trend in the market. Although it is usually a bearish reversal pattern, yet there are strong possibilities that a bullish variant of the stalled pattern may also appear...

The Alternate Bat pattern is popular for incorporating the 1.13XA retracement.Firstly, an important factor is the B point retracement that must be 0.382 retracements or it must be less of the XA leg. Furthermore, it only utilizes a 2 or more BC...

The Flag pattern is a continuation pattern. Its formation is a strong sign of consolidation (price stops to trend for a while to build back momentum).It is identifiable with 3 components: the flagpole, the flag (the consolidation part) and the continuation. The flag...
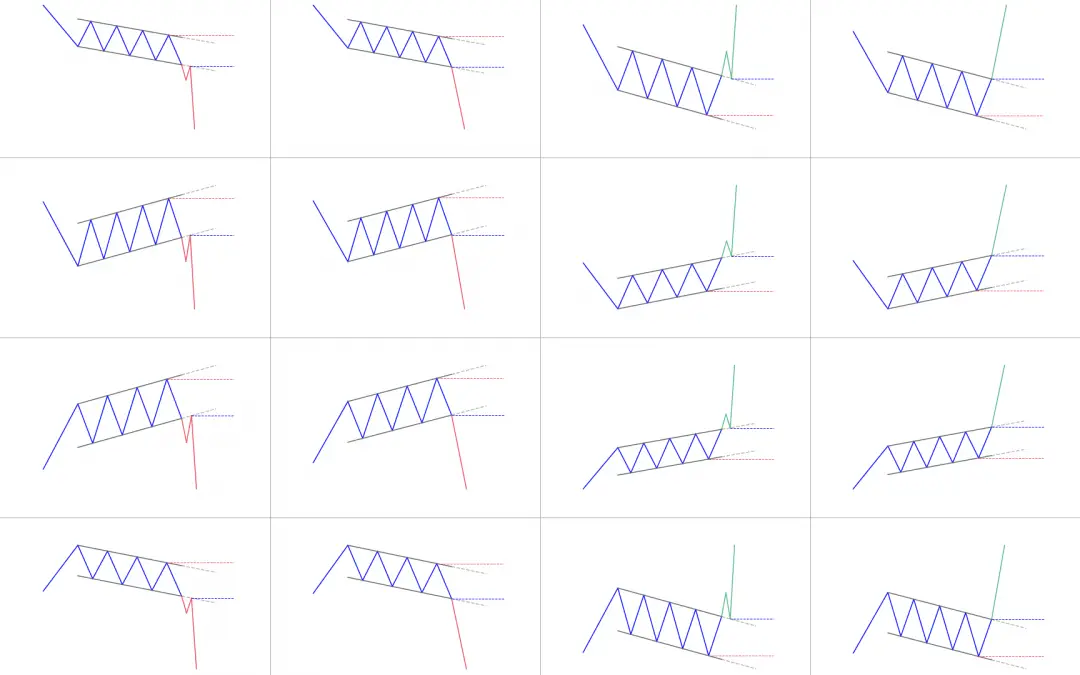
The channel pattern is a technical analysis pattern that capitalizes on the trending tendencies of the market.It is also known as price channel.This pattern appears in the market when price oscillates between two lines with the same slope.It can be a rising channel or...
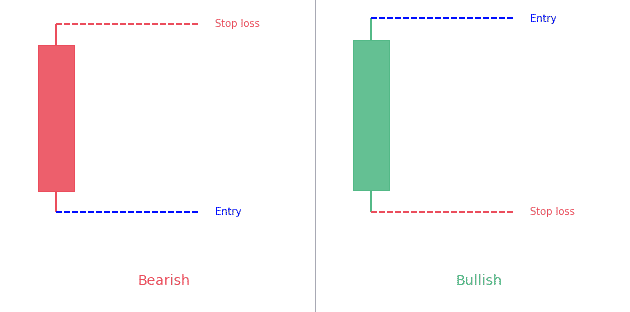
The Long Line candlestick pattern is a 1-bar pattern.It simply consists of a long body candle.It can be bearish or bullish. What is a long line candle? Candlesticks provide different visual hints on the trading charts for a better and easy understanding of the...
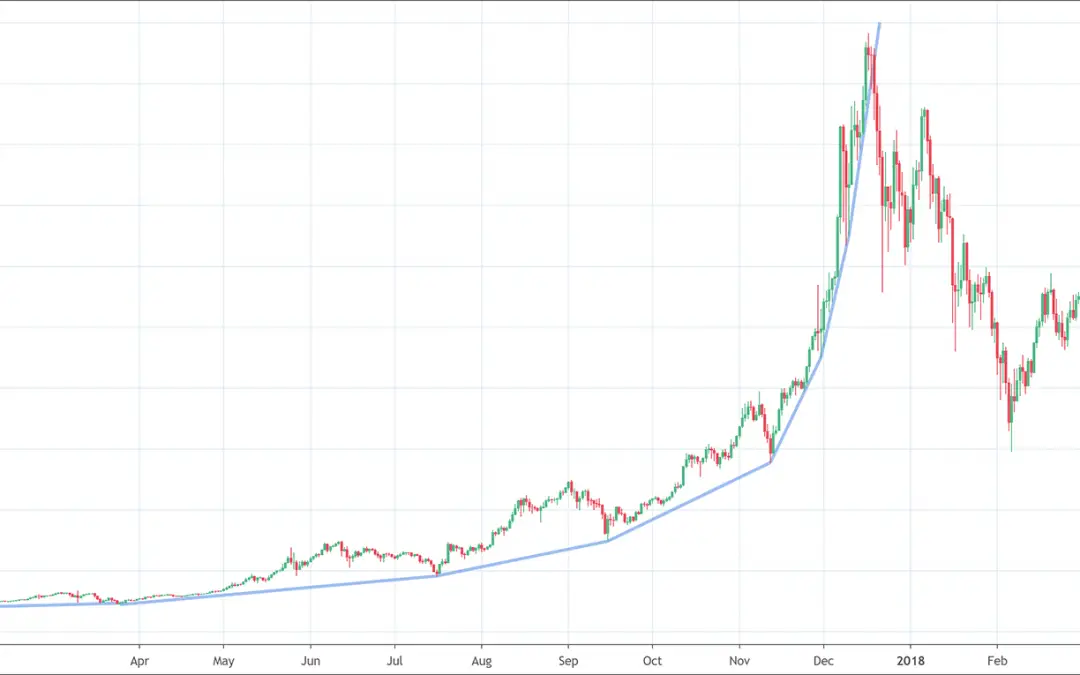
The Parabolic curve pattern is a curved trend line looking like an arc, or an elliptical shape.It appears when price accelerate its rise. The more it rises, the quicker it rises.This growth is often not sustainable so price often dumps when it breaks the parabolic...
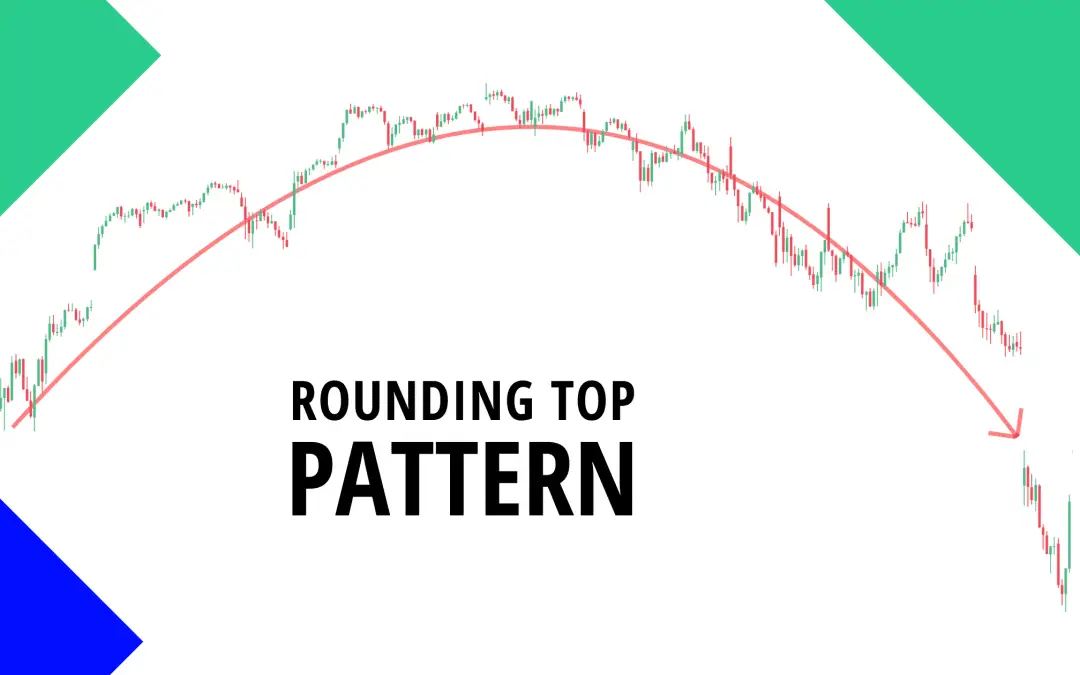
What are Rounded Top Pattern? The rounded top are reversal patterns used to signal the end of a trend. It notifies traders a likely reversal point on a price chart. Rounded top pattern is represented in form of an inverted ‘u’ shape and is also known as an ‘inverse...
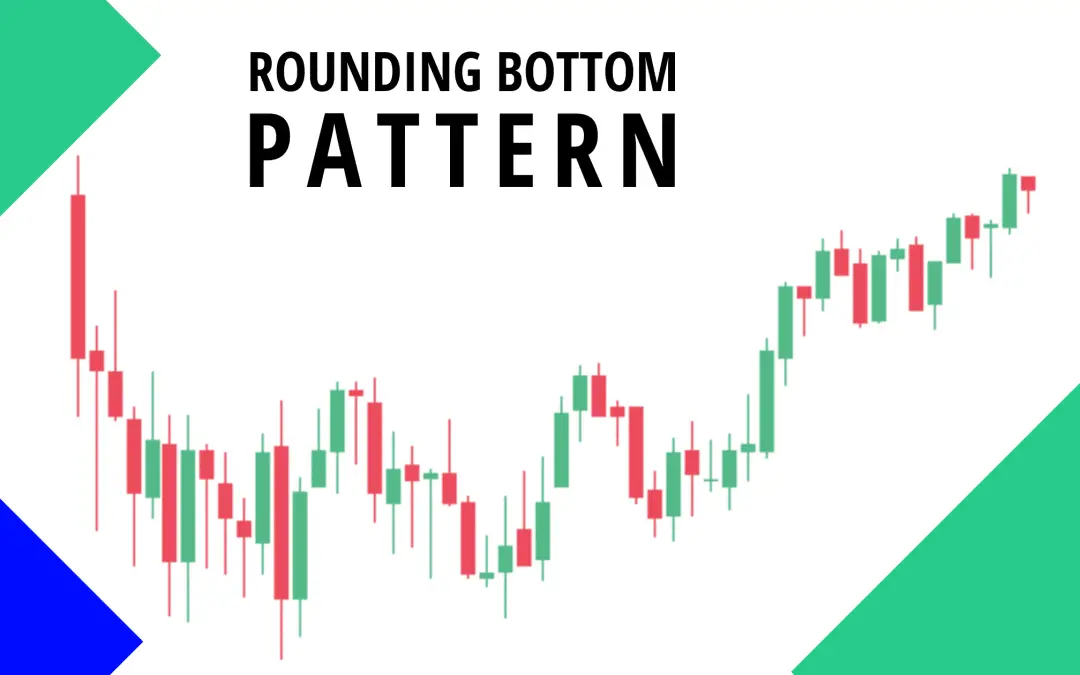
What is Rounding Bottom? A rounding bottom is a chart pattern used in technical analysis. It can be recognized by various price movements that graphically makes up a U-shape. Rounding bottoms are situated at the close of an elongated downward trend. They signify a...
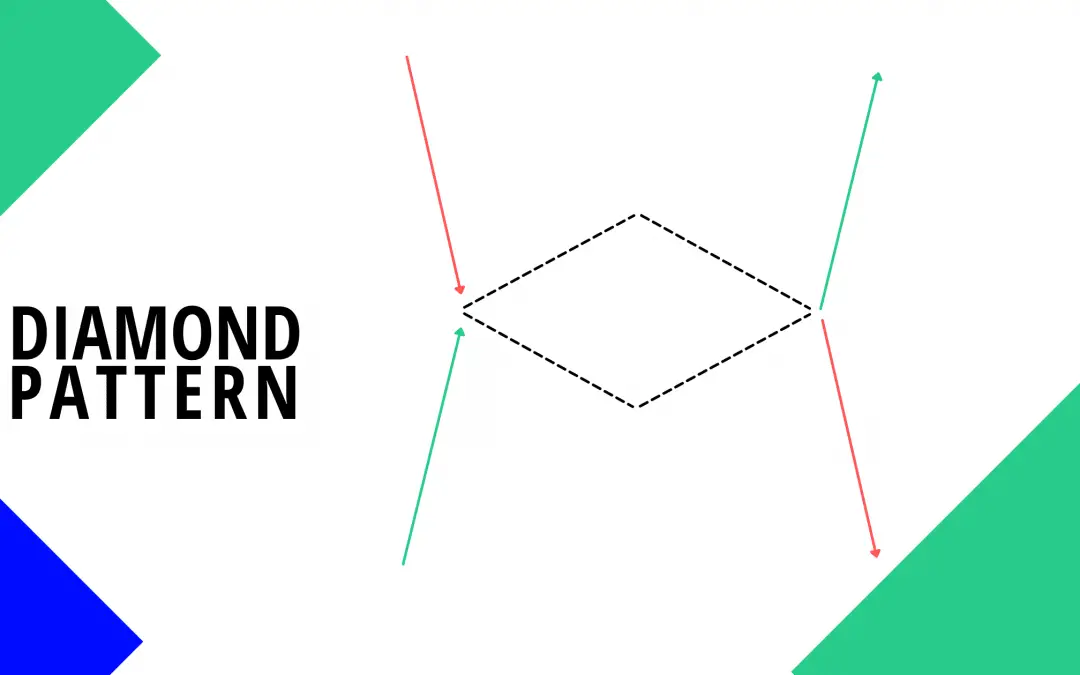
What is Diamond Chart Pattern? The diamond chart pattern is an advanced chart development that takes place in the financial market. It is not very popular among investors and technical traders. Only very few traders are knowledgeable about its structure and trading...
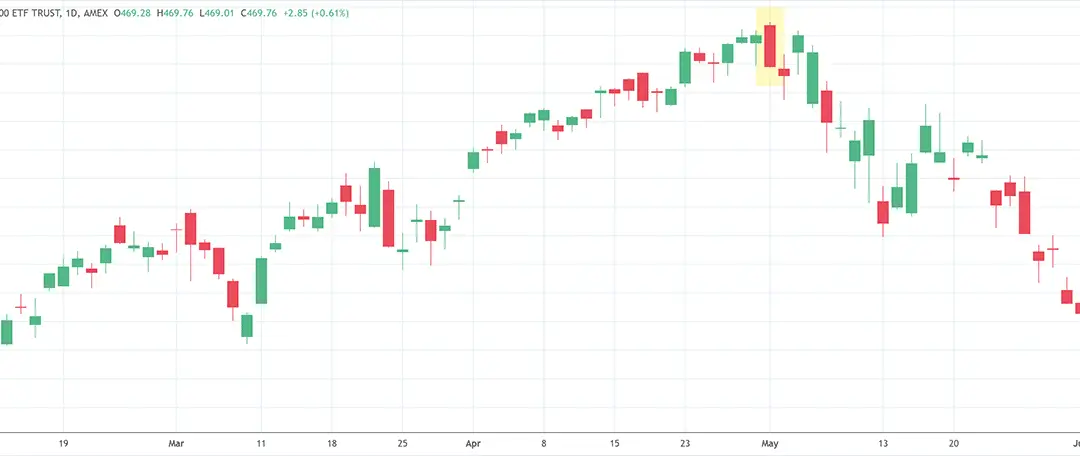
Introduction Candlestick charts are technical tool that put together data for numerous time periods into single price bars. This enables them to become more important than traditional open-high, low-close bars or simple lines...
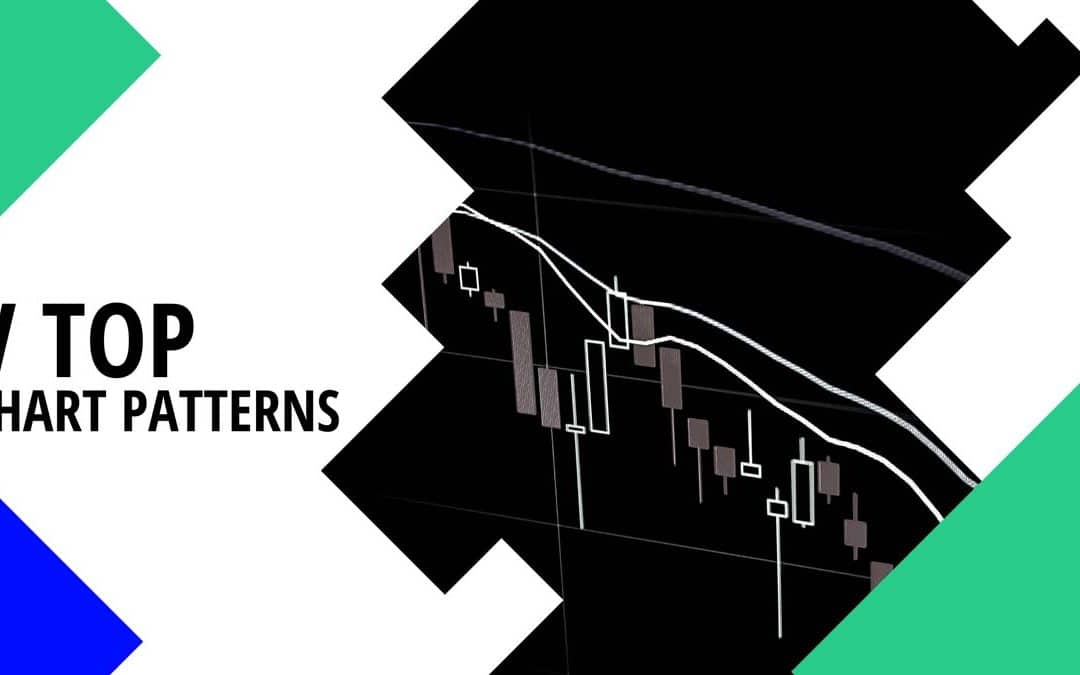
What is V Top Chart Pattern? The V-top derives its name from the inverted V-shaped pattern. It comes up when price momentum changes from an aggressive purchase to an aggressive selling state. This formation is a powerful bearish reversal chart pattern and shows up in...
What is the Cradle Pattern? To adequately understand candlestick patterns, you must have had a good understanding of Japanese candlesticks and all their attributes. Ideally, cradle patterns should be an indication of reversal of the recent trend. It usually takes...
What is a V-bottom Chart Pattern? The v-bottom pattern got its name from the v-shaped pattern. This pattern comes up when price momentum moves from an aggressive selling to an aggressive buying condition. Quick signal that a v-bottom is appearing would be the...

The world of trading presents very difficult as well as tricky puzzles that traders are required to solve. Now, traders who don't know how to solve those puzzles far more than often end up losing their money. Conversely, the gurus and master puzzle solvers can...
We are here to make your investment more predictable. What is the j hook pattern? We are going to tell you over here. A vast benefit to the investors is by Candlestick signals. It helps the investors when they pinpoint the finest trades in the marketplace. The...

Bart Simpson Pattern has emerged as a very unpleasant but important pattern in cryptocurrency trading. In fact, any discussion regarding Bitcoin price doesn't conclude without this mystic pattern. But what is this Bart Simpson Pattern? Why do we observe this Bart...
There are different types of candlestick patterns. But when we talk about above the stomach evolves over a period of almost two sessions. In this pattern, the existing downtrend is there. And it appears at the bottom of any downtrend. Brief Review about Above the...
What is Failed Head and Shoulders Pattern? This article has answers to all your questions over here. A piece of exchanging productively is to work out the gamble and likely prize of each exchange that you make. A few exchanges simply don't offer sufficient potential...
Are you a trader with a small capital and looking to capitalize on the first green day pattern? Or, are you just enticed by the first green day pattern and want to know all about it? Whatever it is, you are on the right platform. We are going to share with you what...

Do you want to know about flat top breakout? We will tell you about it over here. Active investors use Breakout trading for taking place within a trend's early stages. The strategy is of starting point for foremost moves in prices. Moreover, it adds the growths...
Cat’s Ears Pattern is a double top pattern and also considers as one of the rarest patterns. The traders often confuses about the trades and make the most accurate predictions. They try to focus on making the possible scenarios for trading. At the beginning of...

In this article, we are going to discuss all about the Wolfe Wave trading pattern. Keep reading to learn this pattern’s definition, its formation, and ultimate trading strategy. Wolfe Wave trading pattern is among the most effective chart patterns. Therefore,...
Trading Volatility Contraction Pattern is one of the most popular trading strategies. This pattern is among the most reliable patterns for trading and it has proved itself timeless. Given the importance of the Volatility Contraction Pattern in trading, we...

PS: Get 20% off with the code SAVE20
Get “Every Candlestick Patterns Statistics”, The Last Trading Book You’ll Ever Need! 📖

Pre-register now and receive the candlestick patterns statistics ultimate ebook for free before anyone else!
"All you need is one pattern to make a living."
- Linda Raschke