
 Good Trading requires the Best Charting Tool!
- The triple bottom pattern is a bullish reversal pattern.
- It’s created when price bounces off support 3 time at similar levels.
- It’s a sign the buyers are coming in the market to avoid the security price to drop lower.
What is the Triple Bottom pattern?
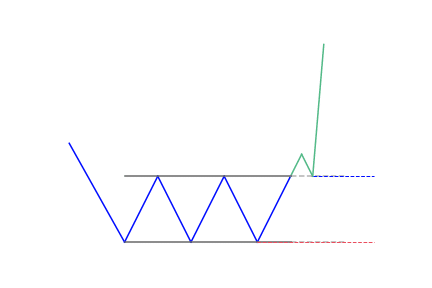
The Triple Bottom chart pattern is used in technical analysis. It’s characterized by three equal lows followed by a breakout above the resistance level.
Typically, the pattern follows a prolonged downtrend where bears are controlling the trading market. While the first bottom could simply be normal price movement, the second bottom shows that the bulls are gaining momentum and preparing for a possible reversal. The third bottom shows that there is strong support in place. Bears may capitulate when the price breaks through resistance levels.
A triple bottom pattern is made up of many candlesticks that make three support levels or valleys that are either of equal or near-equal height. When the third valley forms, it is unable to hold support above the first two valleys and results in a triple bottom breakout.
These patterns are bullish reversals created in bearish trends. Technical traders are always looking for patterns for their entry and exit points. The triple bottom pattern is made up of three equal bottoms, then a breakout above resistance.
It is comprised of a group of candlesticks. Each candlestick tells a story by itself, but when grouped, they paint a bigger picture. Patterns are created through a tug of war between sellers and buyers. This push and pull between the two have been going on for a long time.
Viewing the pattern, it is correct to conclude that the third bounce indicates demand for the stock at this level and since it was able to hold it three times, it increases the chances that prices will turn around and head higher. This typically means there are a lot of buyers at those prices which is what is holding up the stock.
How to identify the Triple Bottom pattern?
The pattern looks similar to the inverse head and shoulders pattern, in that it is represented by three high highs and lows. The difference is that all three highs of the triple bottom chart pattern will be almost the same height, while in the inverse head and shoulders pattern, the second low is lower than the first and third highs.
The triple bottom shows that a downtrend exists, and it is currently in the process of reversing into an uptrend. Selling pressure is reducing, so the downtrend is running out of strength. As with a triple top, it is generally assumed that the longer a particular trend takes to fully develop, the stronger the change in price once a breakdown occurs.

Context
Generally, this pattern is found within low trading ranges preceding downtrends and the break of resistance which confirms this pattern is what makes it a reversal pattern.
Appearance
They are found at the end of downtrends where price makes three attempts at a new low. These attempts are spaced apart often by various weeks. The support area in which price fails to penetrate does not have to be the same price, and various attempts to decline into the same area may be seen as a potential triple bottom.
During this period, a support level is made which forms a trading range between the lows and overhead resistance. The upside break of this resistance confirms this pattern, which is a technical signal to buy.
Breakout Expectation
Breakouts in triple bottoms will often make at least a measured move higher. To know the upside price projection from this pattern, measure the height of the trading range during the triple bottom pattern and add it to the resistance level once it is penetrated to the upside.
Some rules that are commonly used to qualify triple bottoms, they are:
- There should be a current downtrend before the pattern occurs.
- The three lows should be almost equal in price and spaced out from each other. While the price doesn’t have to be exactly equal, it should be close to the same price, such that a trend line is horizontal.
- The volume should drop throughout the pattern to indicate that bears are losing momentum, while bullish volume should increase as the price breaks through the final resistance.
Components of the Triple Bottom
- Three troughs: Also known as the three lows, they are equally spaced and help to mark vital points on the pattern. It is necessary to know that the lows don’t have to be equal but they have to be in the same range.
- Volume: This usually reduces when the pattern develops. There are instances when it will increase, particularly near the lows. Once the third low is achieved, the volume will expand at the resistance breakout.
- Price target: The distance calculated from the lows to the resistance breakout can be included in the resistance break. If the pattern has a longer development, it will lead to the ultimate breakout.
- Resistance break: This is the highest point on the pattern.
- Broken resistance: Broken resistance is equal to the potential support.
What does the Triple Bottom pattern tell traders?
Triple bottom patterns can look like other patterns as they develop. It is therefore important to be able to see patterns within patterns. As it forms, you can notice a double bottom pattern before the third bottom forms. It can also be inside a descending triangle pattern. The support line is horizontal, while the resistance level makes the angle. Being able to draw support and resistance lines, as well as trend lines is very important.
This chart pattern formation is similar to that of the double top. But three peaks are created in the triple top pattern. The price keeps fluctuating between the support and resistance of these three peaks. The traders assume that stock is expensive. Due to this, they sell stocks at the resistance levels.
How to trade when you see the Triple Bottom pattern?
It’s a strong bullish reversal pattern
The triple bottom is similar to the double bottom chart pattern and may also look like descending or ascending triangles. Traders always look for confirmation of a triple bottom by applying other chart patterns or technical indicators. For instance, traders might note that the stock has an oversold RSI before a double bottom is formed, or look for a breakout to confirm that it is a triple bottom and not a descending triangle or another bearish pattern.
By now, you are already aware that this chart pattern is a bullish reversal pattern. It means that a particular asset is trading in a downtrend and has found a strong support level.
When the downtrend gets to the third low, it will lead to an uptrend followed by more pressure on the traders to sell the stock. Due to this, the price will get back to the initial low. Buyers will start moving back into the asset, causing the price to experience an uptrend.
If the situation above happens again for the third time and the price falls to a new low, then the chart pattern can be said to be complete once it gets to a higher position than the resistance level.
The pattern comes to life after the confirmation
If the trader has confirmed the triple bottom pattern, he/she is supposed to set the trade trigger at the resistance line. The trader can measure the potential breakout target which allows opening the long position.
At this point, traders have the liberty of buying the underlying security, thus benefiting from the downtrend. As the pattern closes, it will experience a price high which will lead to more selling pressure among the traders. Selling the security at this point will make it possible for short term traders to profit.
The best exit point for triple bottoms is using the width of the respective formation added to the high or low point. However, to reap the most profits on your trading position; tighten your stops once the target is hit.


 We loved Marwood Research’s course “Candlestick Analysis For Professional Traders“. Do you want to follow a great video course and deep dive into 26 candlestick patterns (and compare their success rates)? Then make sure to check this course!