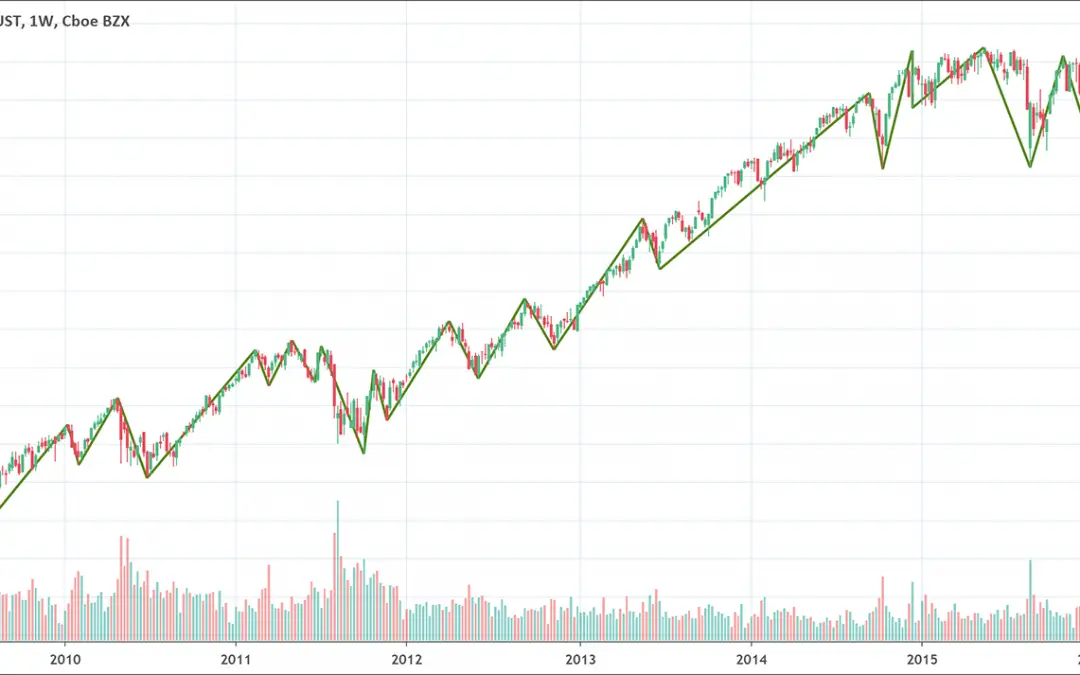
 Good Trading requires the Best Charting Tool!
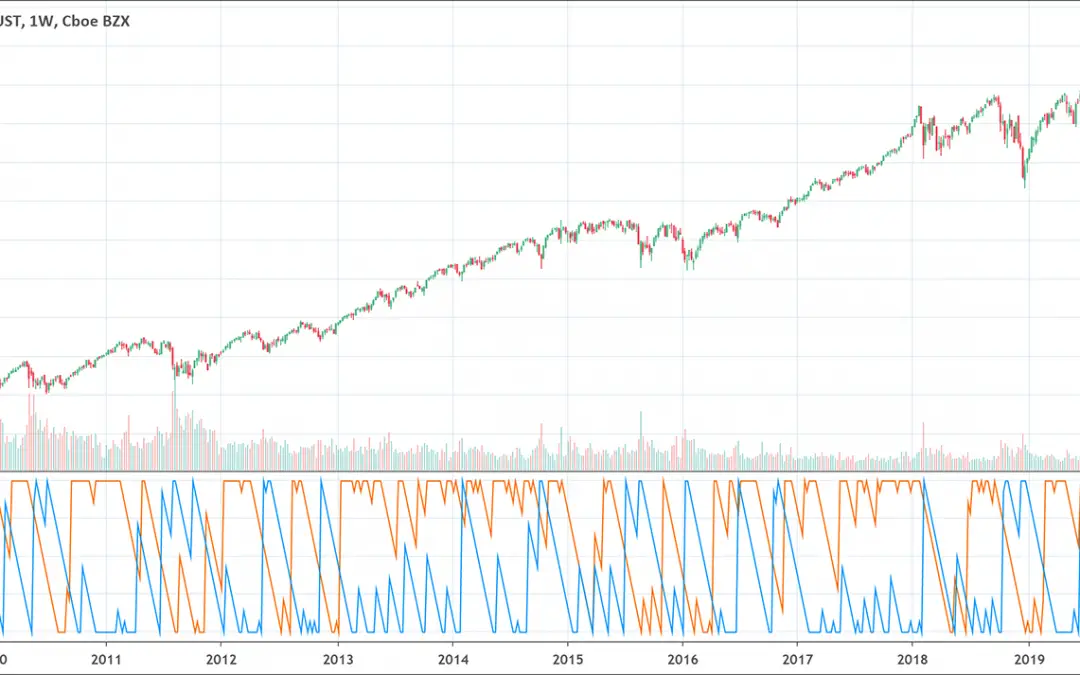
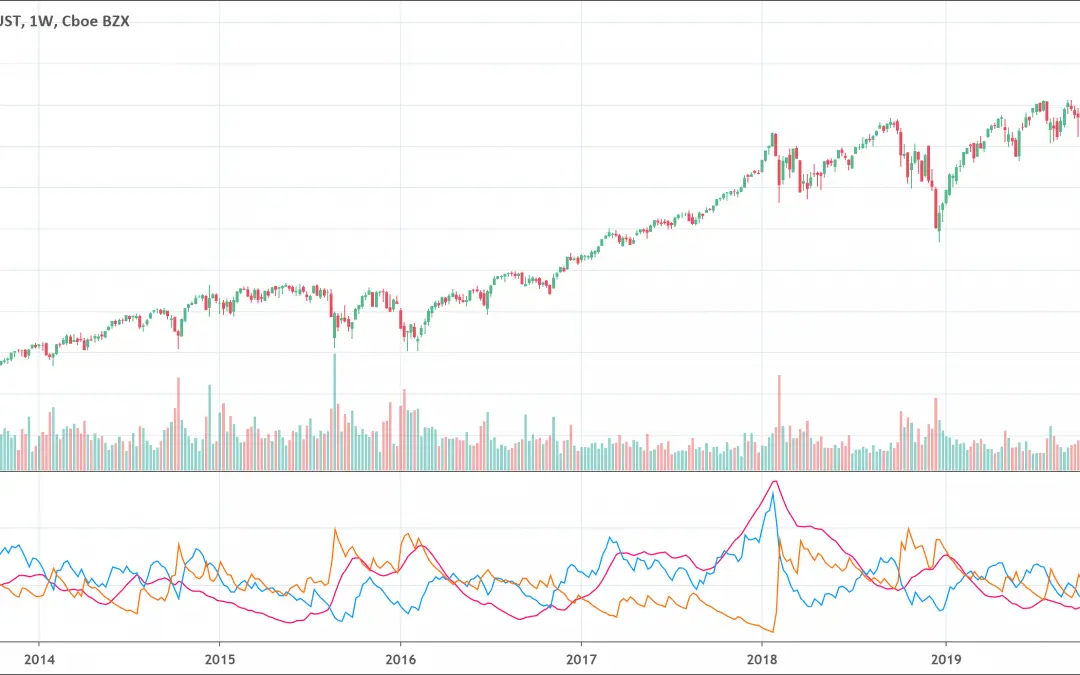
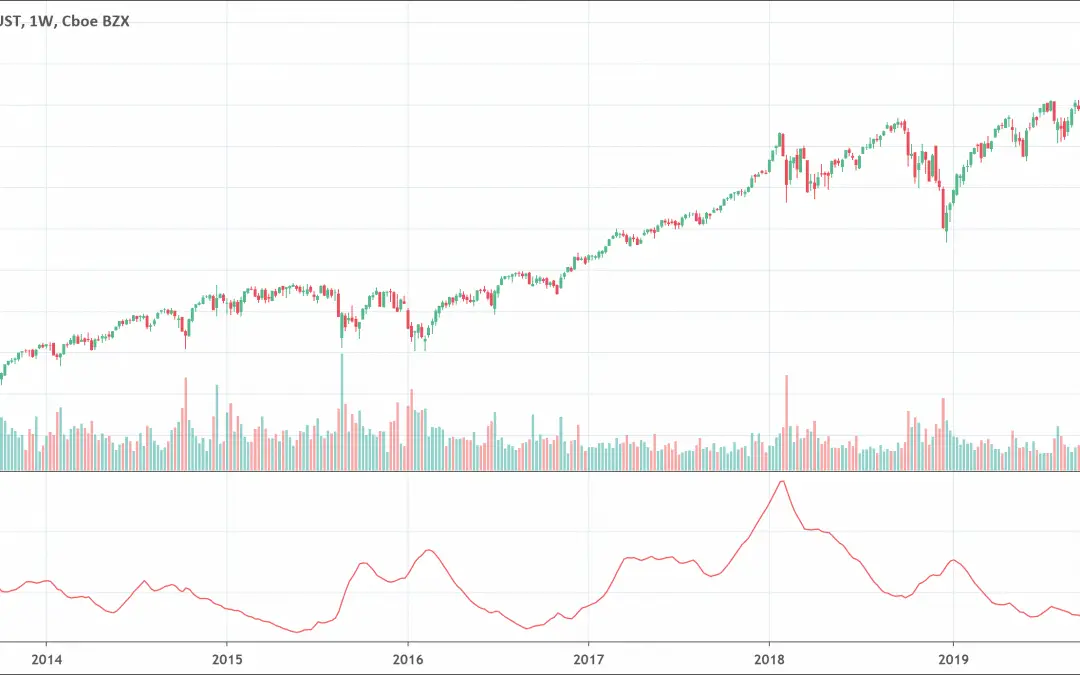
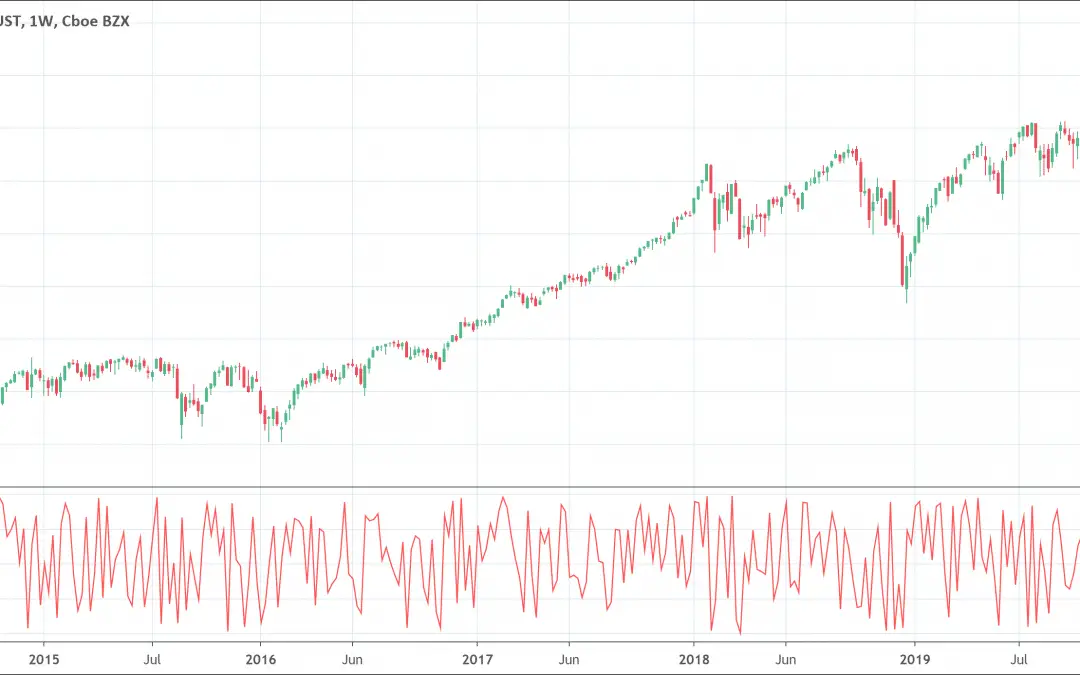
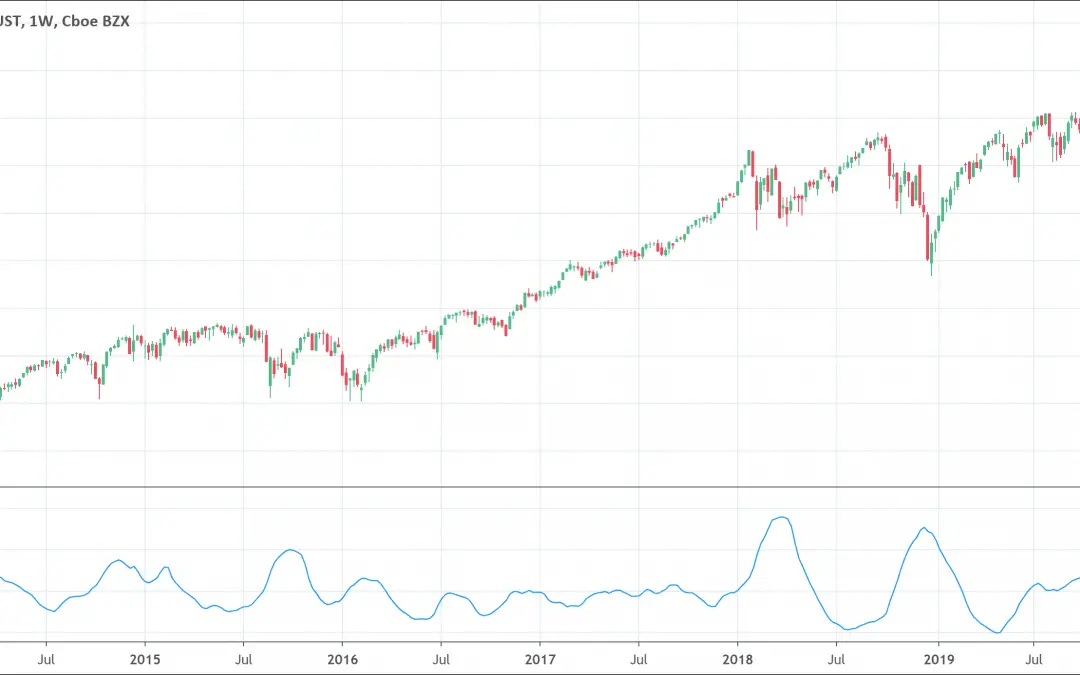
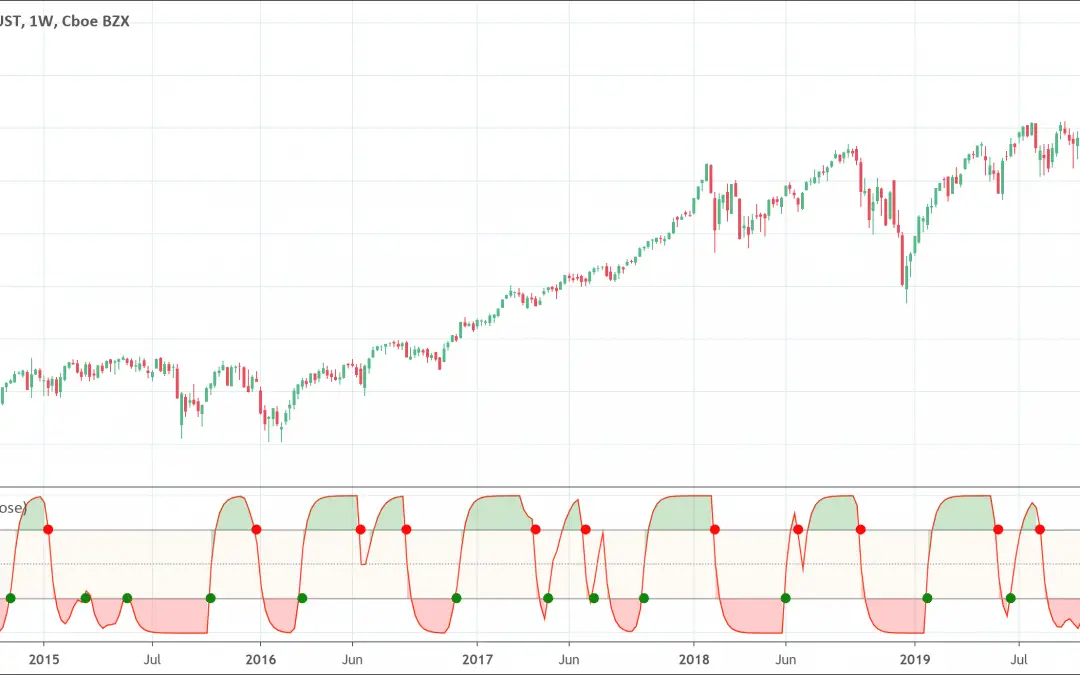
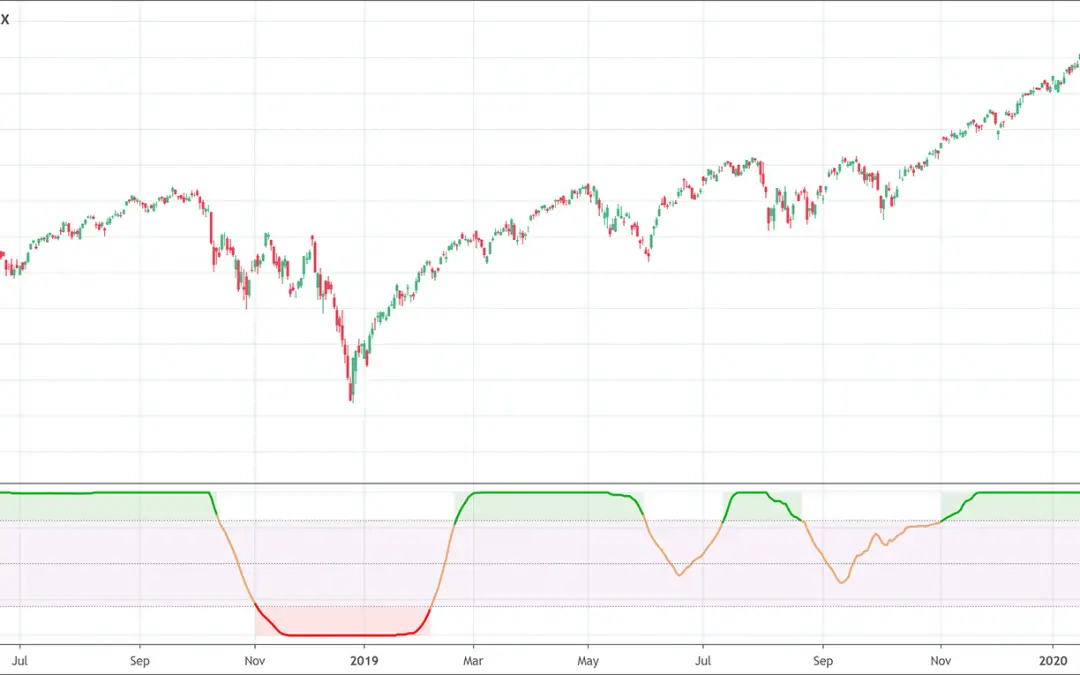
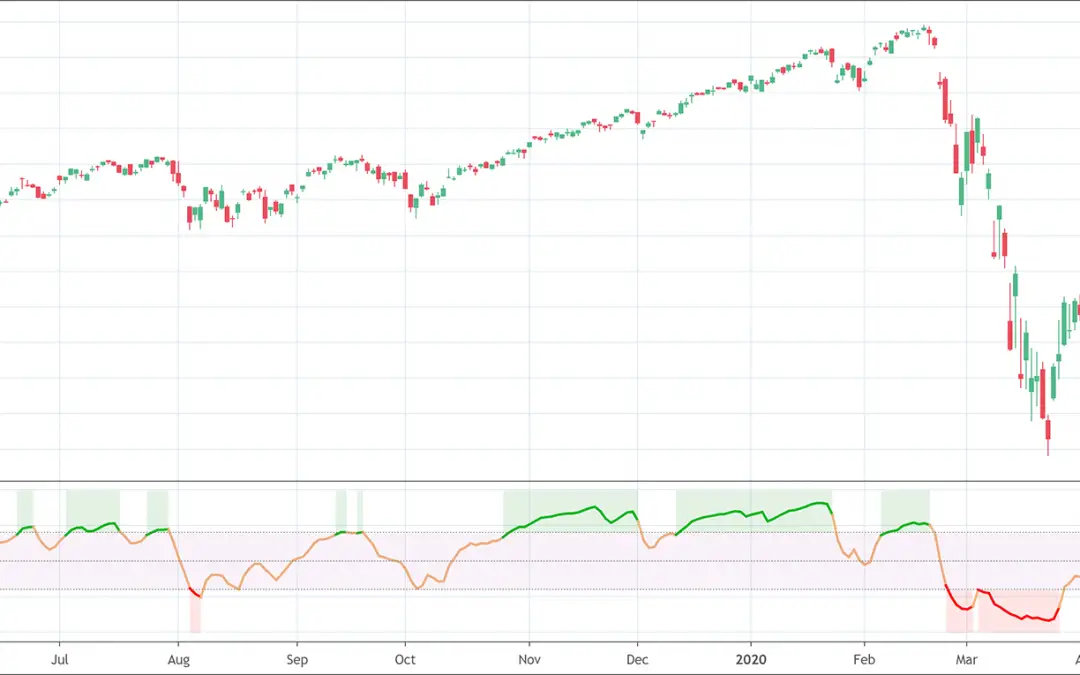
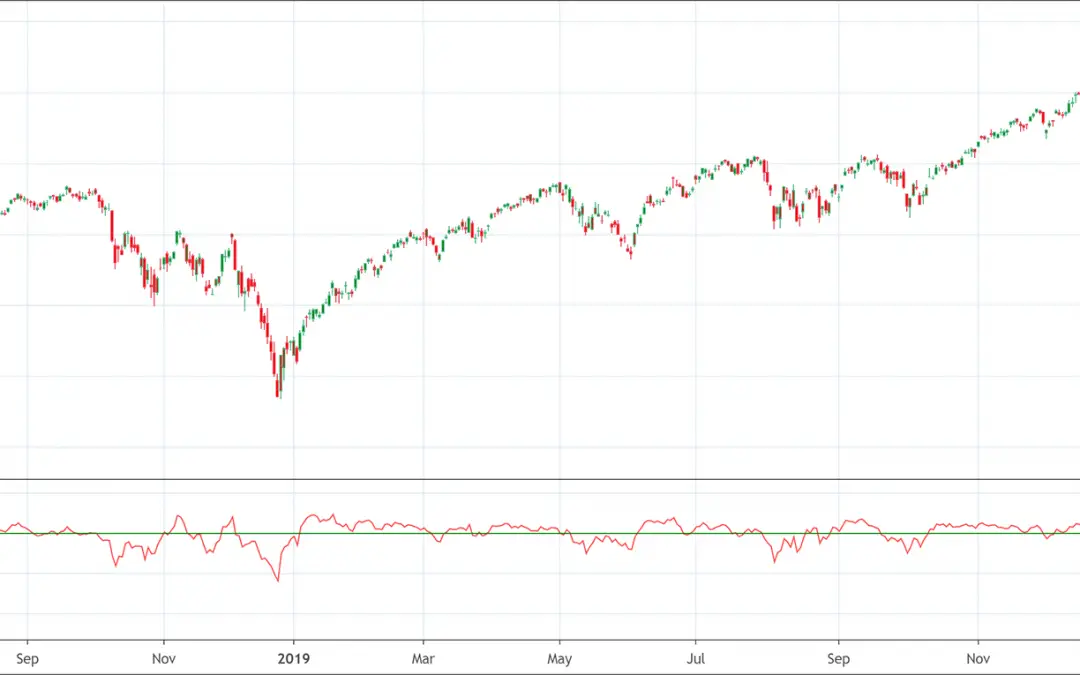
The Moving Average Convergence Divergence (MACD) is both a momentum and trend following indicator.It is calculated by subtracting the 26-period EMA (Exponential Moving Average) from the 12-period EMA.There are several ways to read it:When the lines crossWhen the...
![MACD Indicator: The Ultimate Guide [2022]](https://patternswizard.com/wp-content/uploads/2020/06/MACD-1080x675.png)
MACD Indicator: The Ultimate Guide [2022]
read more
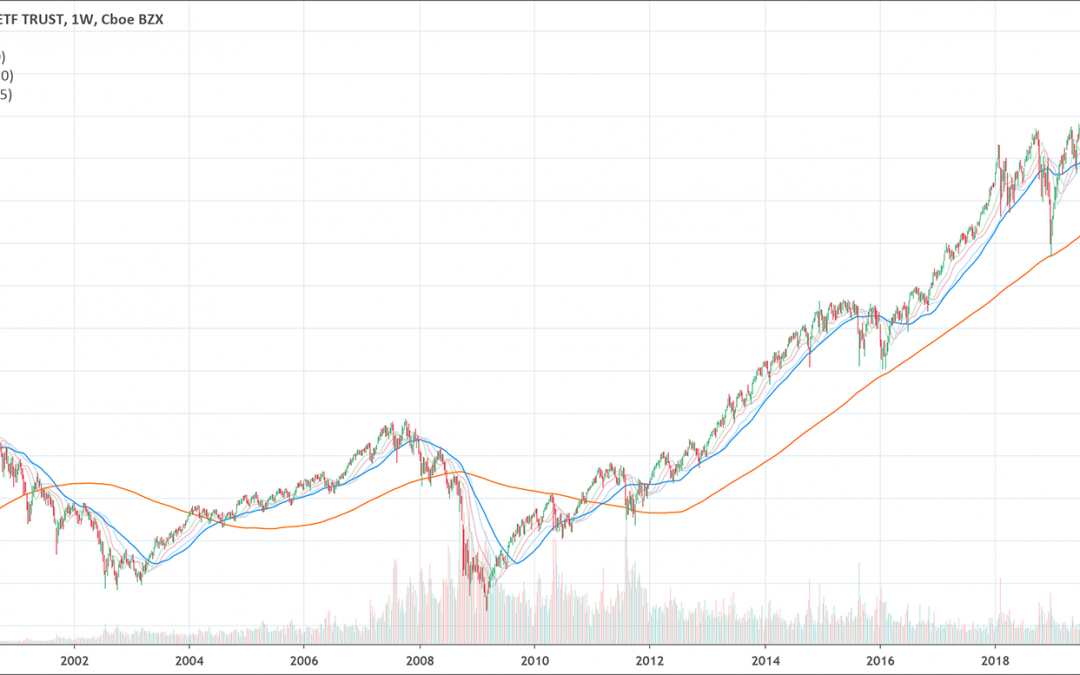
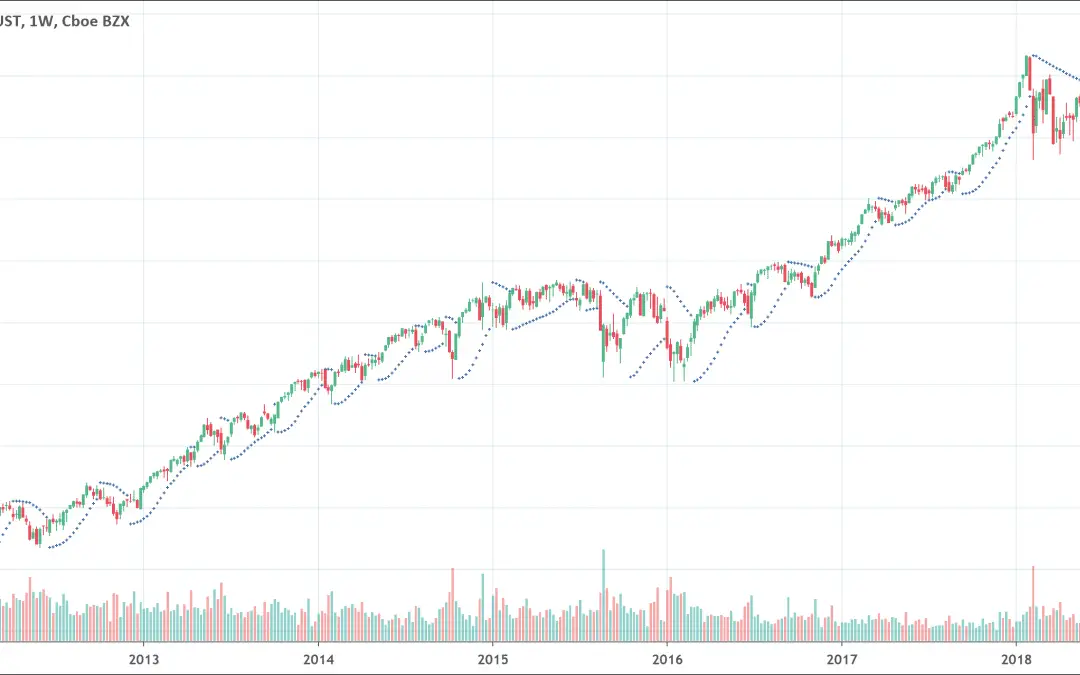
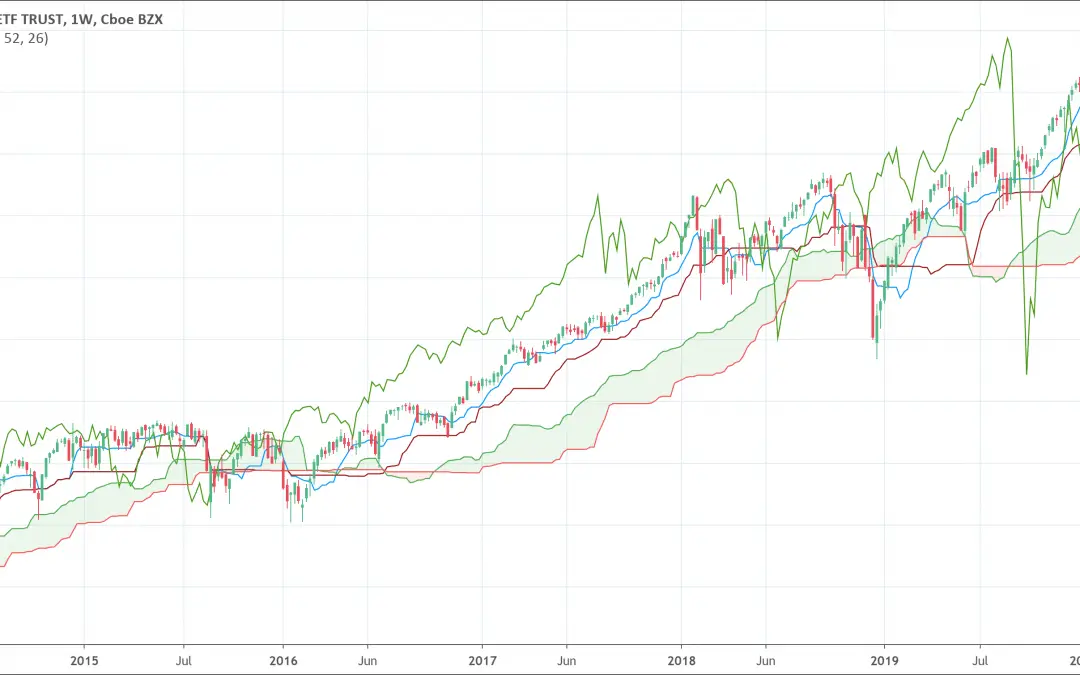
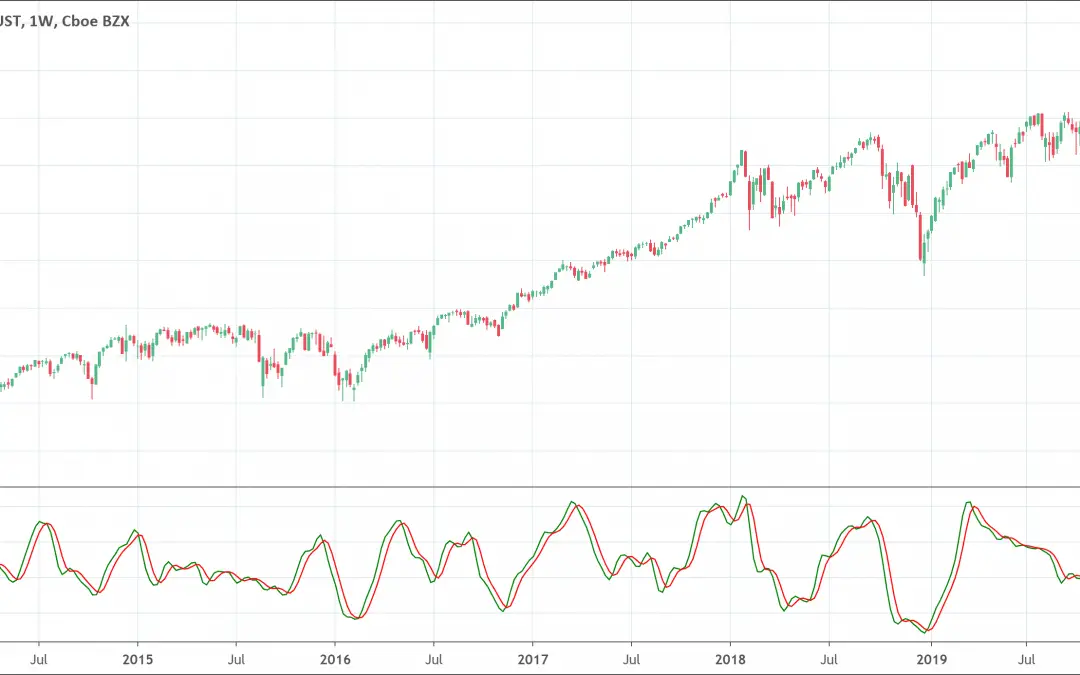
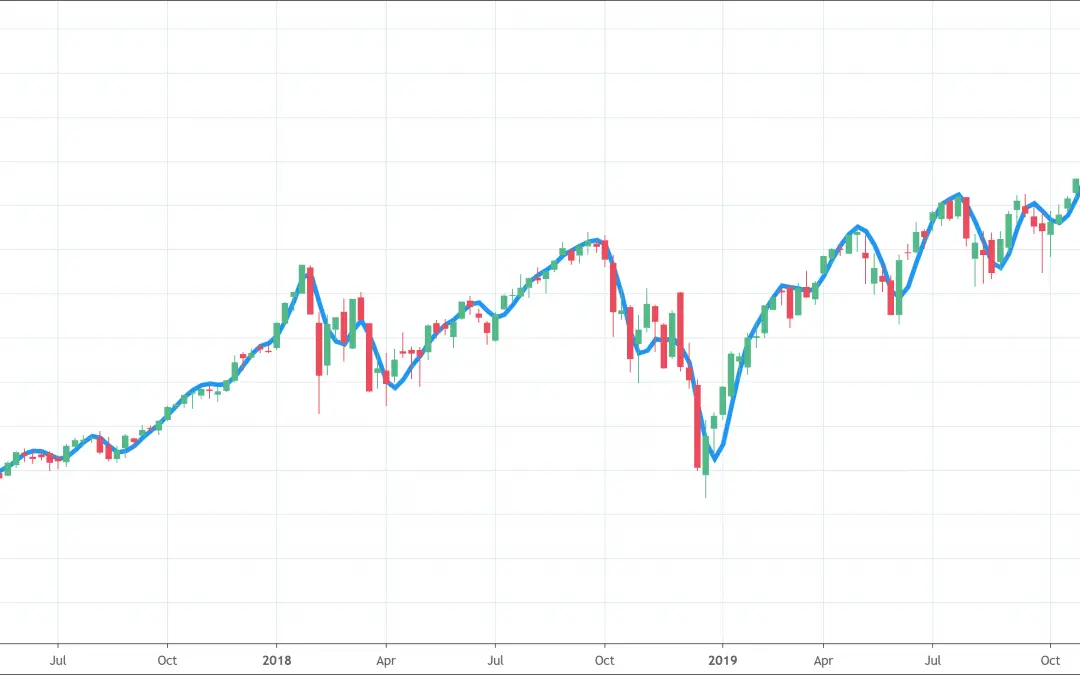
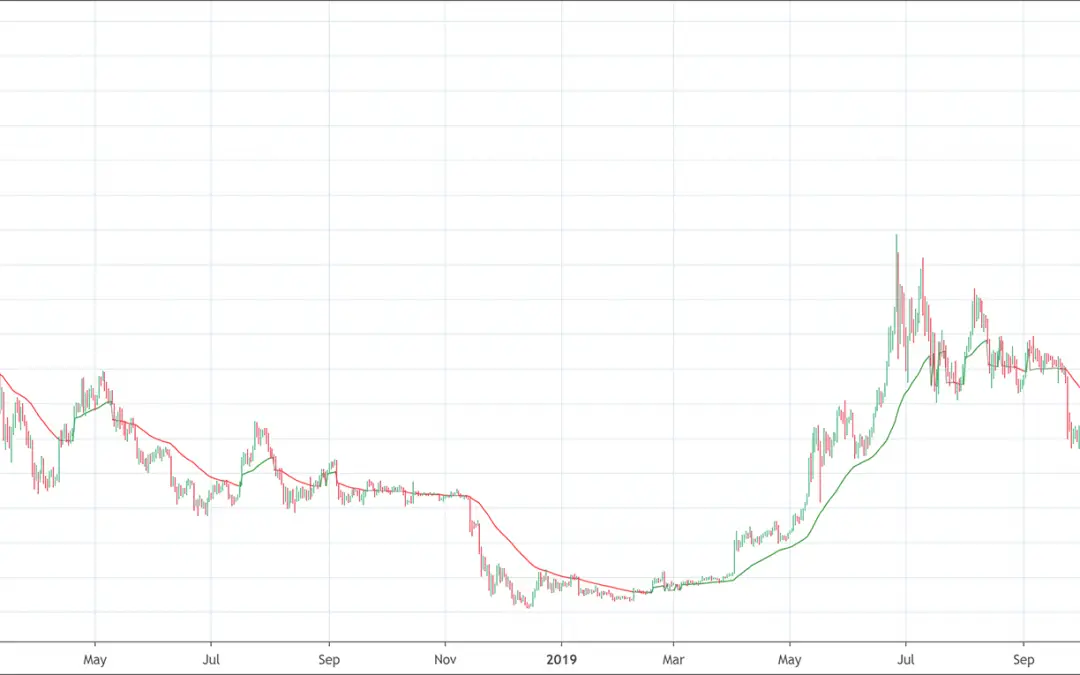
![McGinley Dynamic Indicator: Full Guide [2022]](https://patternswizard.com/wp-content/uploads/2020/07/mcginleydynamic-1080x675.png)
 We loved Marwood Research’s course “Candlestick Analysis For Professional Traders“. Do you want to follow a great video course and deep dive into 26 candlestick patterns (and compare their success rates)? Then make sure to check this course!
