Volatility indicators

Volatility with the market can be measured in various ways. Several indicators let traders chart volatility so they can encompass it in their trading.

Average True Range (ATR) Indicator

Average True Range (ATR) Indicator

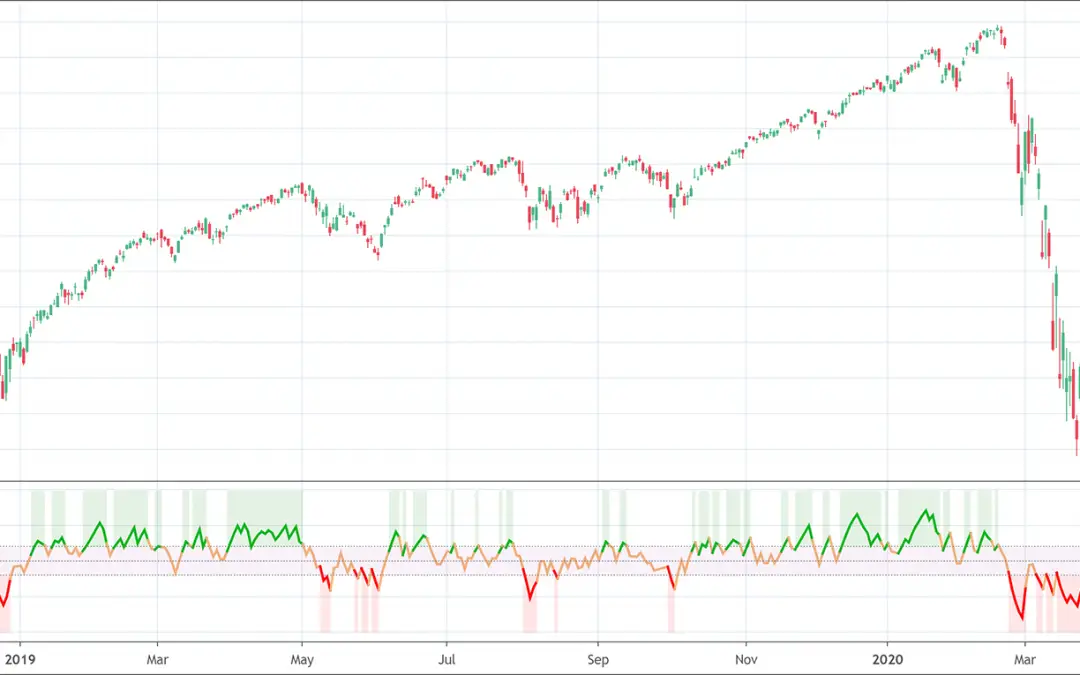
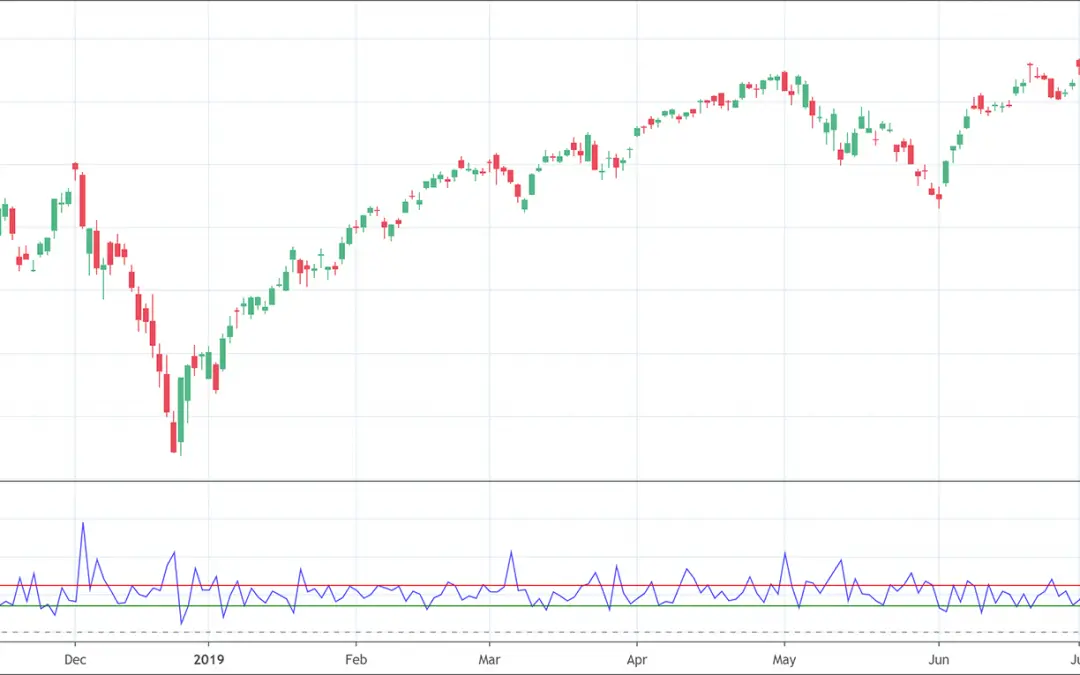
Average True Range (ATR) indicator is one of the most influential technical analysis tools that track volatility in a predefined period of time. Unlike most of the indicators, ATR does not identify trends and only focuses on measuring volatility in a particular...
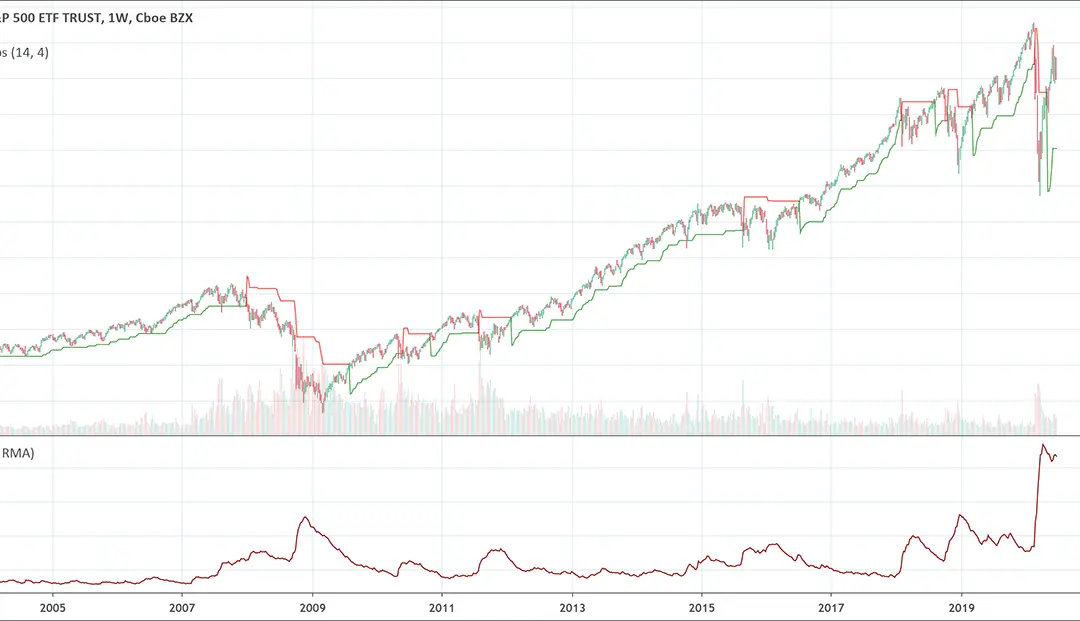
read more
Donchian Channel: Definition & Secrets

Donchian Channel: Definition & Secrets

The Donchian Channel indicator is an intraday trend following indicator that allows you to identify trends. As we all know that trade breakouts is a popular trend following strategy. Breakouts can be conveniently measured through the lowest low and highest high. It...

read more
Bollinger Bands Indicator: The Complete Guide

Bollinger Bands Indicator: The Complete Guide

John Bollinger created the technique of using a moving average with two trading bands below and above it. He introduced this technique in the 1980s and he trademarked this term in 2011. Bollinger was a long-time technician of the markets. Previously, it was known as...

read more
Choppiness Index Indicator: How to trade it?

Choppiness Index Indicator: How to trade it?

The Choppiness Index indicator is a volatility indicator.It determines whether the market is following a trend or the market is choppy and trading sideways. The Choppiness Index indicator is a volatility indicator that determines whether the market is following a...

read more
Keltner Channel Indicator: Definition & Secrets

Keltner Channel Indicator: Definition & Secrets

The Keltner Channel is a volatility based indicator.It indicates whether the market's trend is likely to continue or it may change direction.It is generally built with a 20-period EMA as the center line and two lines above at a 2 Average True Range distance. The...

read more
Implied Volatility (IV): What is it?

Implied Volatility (IV): What is it?

Implied volatility (IV) is a measure that helps traders to understand the chances of changes in the prices of a given security.In options, IV is the underlying instrument’s volatility. Implied Volatility? What is it? Implied volatility (IV) is a measure that helps...

read more
Bollinger Bands Width & %B: Tactics

Bollinger Bands Width & %B: Tactics

Both the Bollinger Bands Width and the Bollinger Bands %B are indicators based on the Bollinger Bands.The Bollinger Bands Width indicator shows the width of the bands (how wide they are at any moment).The Bollinger Bands %B indicator shows the relative position of the...

read more
Full Explanations of the Historical Volatility

Full Explanations of the Historical Volatility

Historical Volatility is a measure of movements of prices over a specified period of time.It deals with measuring the level of price fluctuations of stock prices from its average price over a specified period of time.It helps trader quantify how volatile a stock is...

read more
Relative Volatility Index: How to trade it?

Relative Volatility Index: How to trade it?

The Relative Volatility Index (RVI) is a volatility indicator.It is best to use it in conjunction with other momentum or trend following indicators to confirm trends. The Relative Volatility Index (RVI) is a volatility indicator that helps to identify the direction of...

read more
Arms Index & TRIN indicator: What is it?

Arms Index & TRIN indicator: What is it?

Arms Index and TRIN indicators are two names for the same indicator.The Arms Index is an oscillator which measures market volatility.It helps to gauge the overall sentiment in the market. The Arms Index is an oscillator and a leading indicator that helps to measure...

read more
TTM Squeeze Indicator Explained [Full Trading Guide]

TTM Squeeze Indicator Explained [Full Trading Guide]

Introduction The squeeze strategy has been adopted for trading and has been in use for many years. Carter developed the TTM Squeeze indicator. It is currently in use by many top and well-known charting software platforms, such as Thinkorswim and TradeStation. TTM...

read more

Are Candlestick Patterns Reliable

candlesticksWe loved Marwood Research’s course “Candlestick Analysis For Professional Traders“. Do you want to follow a great video course and deep dive into 26 candlestick patterns (and compare their success rates)? Then make sure to check this course!
PS: Get 20% off with the code SAVE20

Get “Every Candlestick Patterns Statistics”, The Last Trading Book You’ll Ever Need! 📖

PatternsWizard book - Every Candlestick Patterns Statistics

"Every Candlestick Patterns Statistics", the last trading book you'll ever need!

Pre-register now and receive the candlestick patterns statistics ultimate ebook for free before anyone else!

"All you need is one pattern to make a living."
- Linda Raschke

Awesome move! We are giving the last touch to the "Every Candlestick Patterns Statistics" book. We are very excited to send it to you right when it's ready. In the meantime, we'd like to gift you our trading roadmap and its best 55 resources. You'll shortly receive an email with the link. Don't miss it ;) Stay tuned 📈