Momentum is the key feature for movement. The same is true for trading.
It’s easier to push a moving wagon than to make it start. The same is true for trading.
Momentum traders need tools to understand if an asset is likely to start to move, continue it’s move or reverse and go the opposite direction.
What are momentum indicators?
Momentum indicators are technical analysis tools to help traders understand if price has the energy to move (hence momentum). They often are computed using price movement, closing price and current price.
The most popular momentum indicators are RSI, Stochastic Oscillator, MACD Indicator and many more are available (more than 20 different indicators).
Each of these technical indicators are very easy to add to your price chart using TradingView. As you likely noticed, most of the price charts visible on our site are taken from this tool.
Click here if you want to test TradingView for free!
How to use momentum indicators?
Momentum indicators can be used in 2 principal ways:
- Standalone as their value reaches overbought or oversold conditions. It happens for example when price moves down for a long period of time. Indicators would then reach oversold levels
- In conjunction with the price with bearish or bullish divergence. It happens for example when the price made a new high but the indicator did not. It here creates a bearish divergence and hints as a sell signal and a trend reversal.
Keep in mind that although very powerful, as everything else in technical analysis, it remains based on probabilities and can create false signals.
Momentum indicators allow traders to better understand the speed at which the price of a given security changes. They are a great hint to understand the strength of price movements.
What are the current market trends?
Is it a strong trend or will the current trend likely to reverse?
You need good tools to figure out!
There are many different momentum indicators
Here, you’ll find more than 20 momentum indicators described here. Each of them can greatly integrate with chart patterns so you can increase your chance of a trade going your way.
Want to go into the details of a specific volume indicator? You’re at the right place!
Feel free to discover the detailed article for each and every volume indicator right below :
 Good Trading requires the Best Charting Tool!
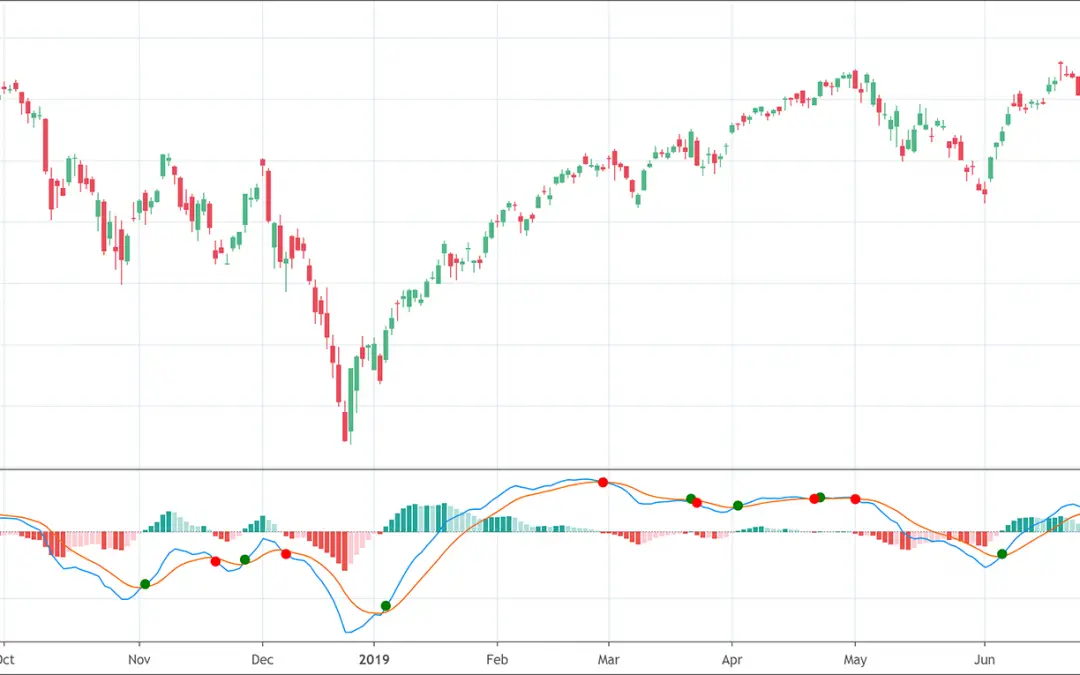
![Stochastic Oscillator: Full Trading Guide [2022]](https://patternswizard.com/wp-content/uploads/2020/06/Stochastic-1080x675.png)
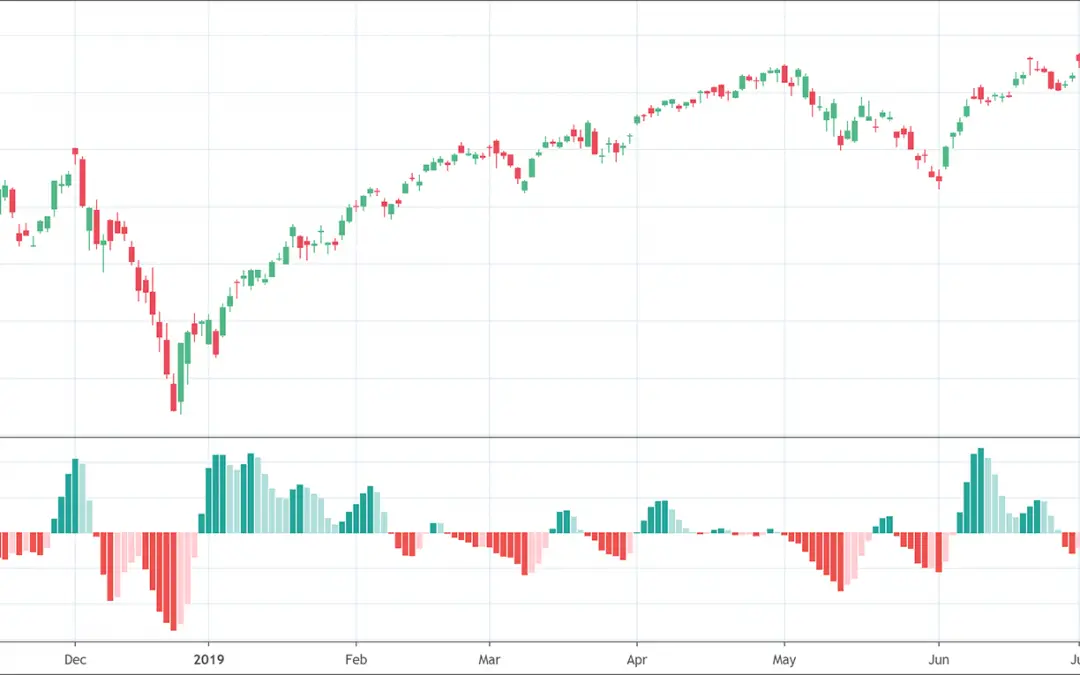
![MACD Indicator: The Ultimate Guide [2022]](https://patternswizard.com/wp-content/uploads/2020/06/MACD-1080x675.png)
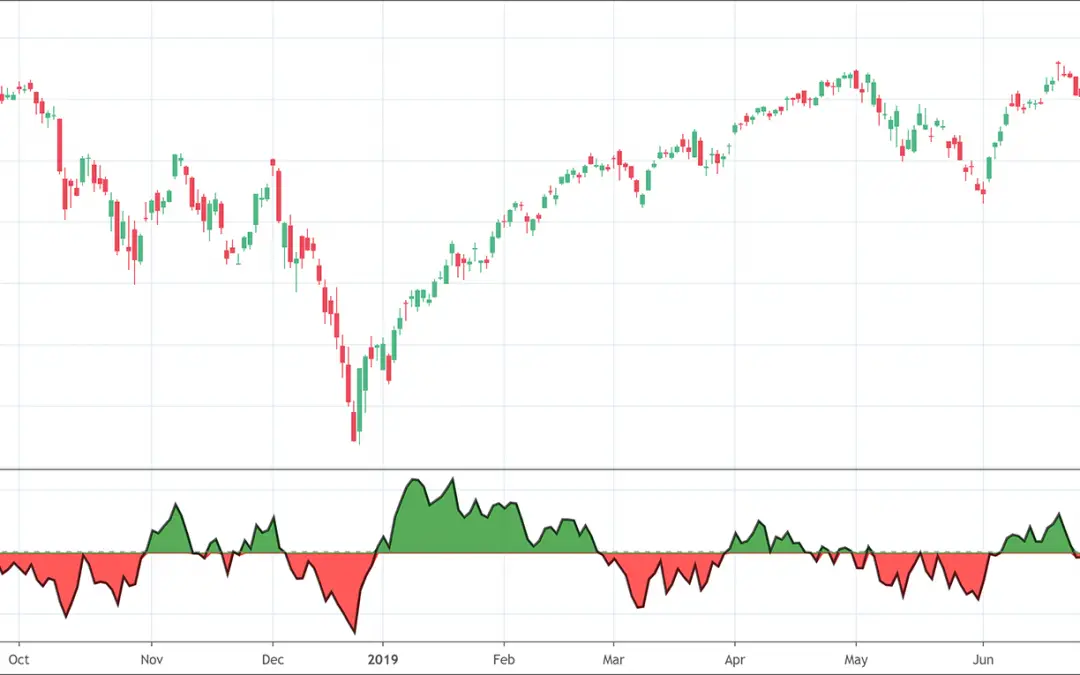
![Rate of Change Indicator: Complete Guide [2022]](https://patternswizard.com/wp-content/uploads/2020/07/rateofchange-1080x675.png)
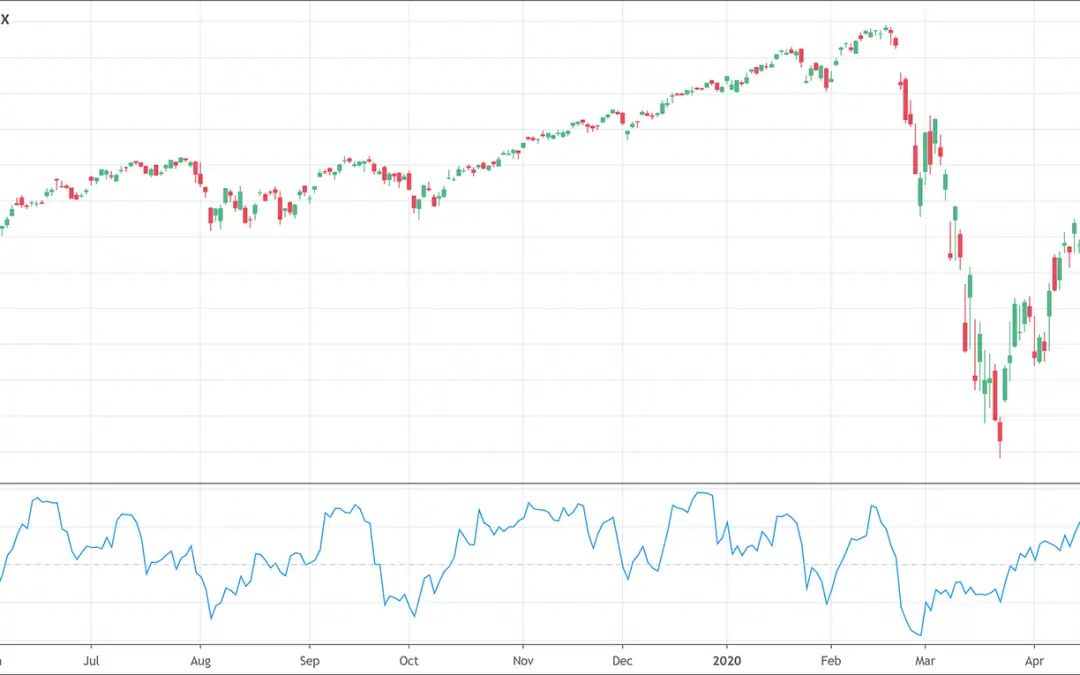
![Stochastic RSI indicator: Full Guide [2022]](https://patternswizard.com/wp-content/uploads/2020/07/stochrsi-1080x675.png)
![TTM Squeeze Indicator Explained [Full Trading Guide]](https://patternswizard.com/wp-content/uploads/2021/10/TTM-Squeeze-1080x590.png)
 We loved Marwood Research’s course “Candlestick Analysis For Professional Traders“. Do you want to follow a great video course and deep dive into 26 candlestick patterns (and compare their success rates)? Then make sure to check this course!
