Chart types

Securities’ price can be charted in different ways.
Learn each chart specificities in our articles.

Heikin Ashi Chart: Learn how to highlight trends

Heikin Ashi Chart: Learn how to highlight trends

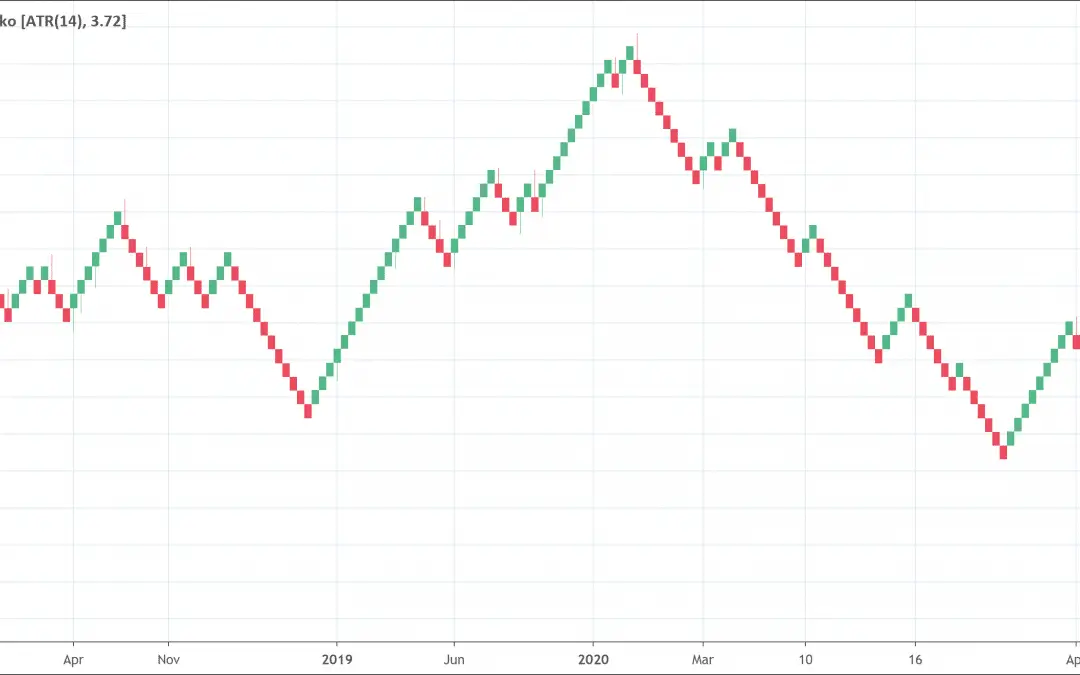
The Heikin-Ashi chart helps traders filter out market noise.Rather than using the open, high, low, and close like standard candlestick charts, this technique uses a modified formula based on two-period averages.Traders use the Heikin Ashi technique traders to easily...
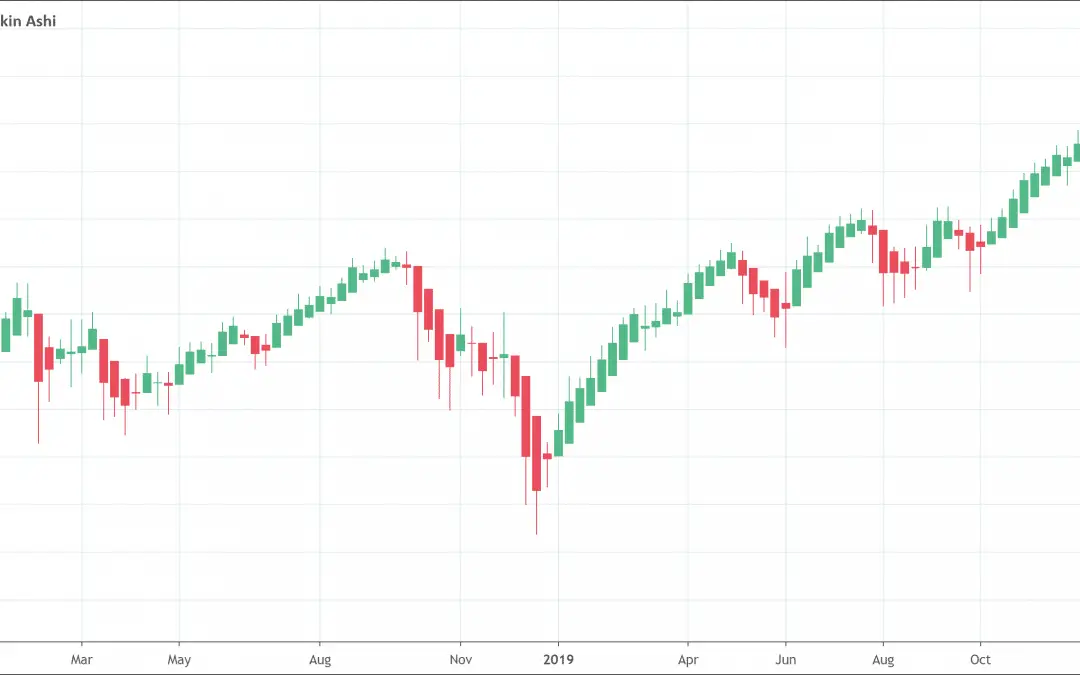
read more
How to best use the Kagi Chart?

How to best use the Kagi Chart?

Kagi chart is a kind of chart that tracks the price movements of a security. While price and time appear on traditional charts, with Kagi charts, only the price is important.A Kagi chart plots price like a snake, continuously. When the price falls, the line appears...

read more
Candlestick Chart: All traders shoud know

Candlestick Chart: All traders shoud know

Candlestick charts are very popular.It shows 4 prices for every fixed period:Open priceClose priceHighest price for the sessionLowest price traded during the sessionTraders use the candlestick chart to determine where price is heading based on previous patterns. What...

read more
Point and Figure (P&F) Chart: Complete Guide

Point and Figure (P&F) Chart: Complete Guide

If the price of an asset moves up by a certain amount, then it will form an X.If the price of an asset moves down by a certain amount, then it will form an O. Xs and Os stack on top of each other, and will often form a series of Xs or Os. The size of the box is...

read more
Renko Chart: A way to capture big moves

Renko Chart: A way to capture big moves

Charts are important in forex trading. It is possible to effectively trade forex today without using a chart. One of the most popular forex charting styles is the Japanese chart, Renko. Renko charts are great in analyzing the market from a completely different point...

read more
Line Chart: Why is it useful for traders?

Line Chart: Why is it useful for traders?

A line chart is the simplest and most basic type of stock chart used to analyze financial markets.The line chart only plots the closing price of the underlying security.It has a line connecting the dots created by the close price. A line chart is the simplest and most...

read more
Hollow Candlesticks: Glance at Trend Strength

Hollow Candlesticks: Glance at Trend Strength

There are two types of candlesticks, hollow candlesticks and filled candlestick.Candlesticks also tell us about the strength of a trend in the market.The hollow candlesticks tell us that the trend is strengthening as prices move higher after the open. Different types...

read more

Are Candlestick Patterns Reliable

candlesticksWe loved Marwood Research’s course “Candlestick Analysis For Professional Traders“. Do you want to follow a great video course and deep dive into 26 candlestick patterns (and compare their success rates)? Then make sure to check this course!
PS: Get 20% off with the code SAVE20

Get “Every Candlestick Patterns Statistics”, The Last Trading Book You’ll Ever Need! 📖

PatternsWizard book - Every Candlestick Patterns Statistics

"Every Candlestick Patterns Statistics", the last trading book you'll ever need!

Pre-register now and receive the candlestick patterns statistics ultimate ebook for free before anyone else!

"All you need is one pattern to make a living."
- Linda Raschke

Awesome move! We are giving the last touch to the "Every Candlestick Patterns Statistics" book. We are very excited to send it to you right when it's ready. In the meantime, we'd like to gift you our trading roadmap and its best 55 resources. You'll shortly receive an email with the link. Don't miss it ;) Stay tuned 📈