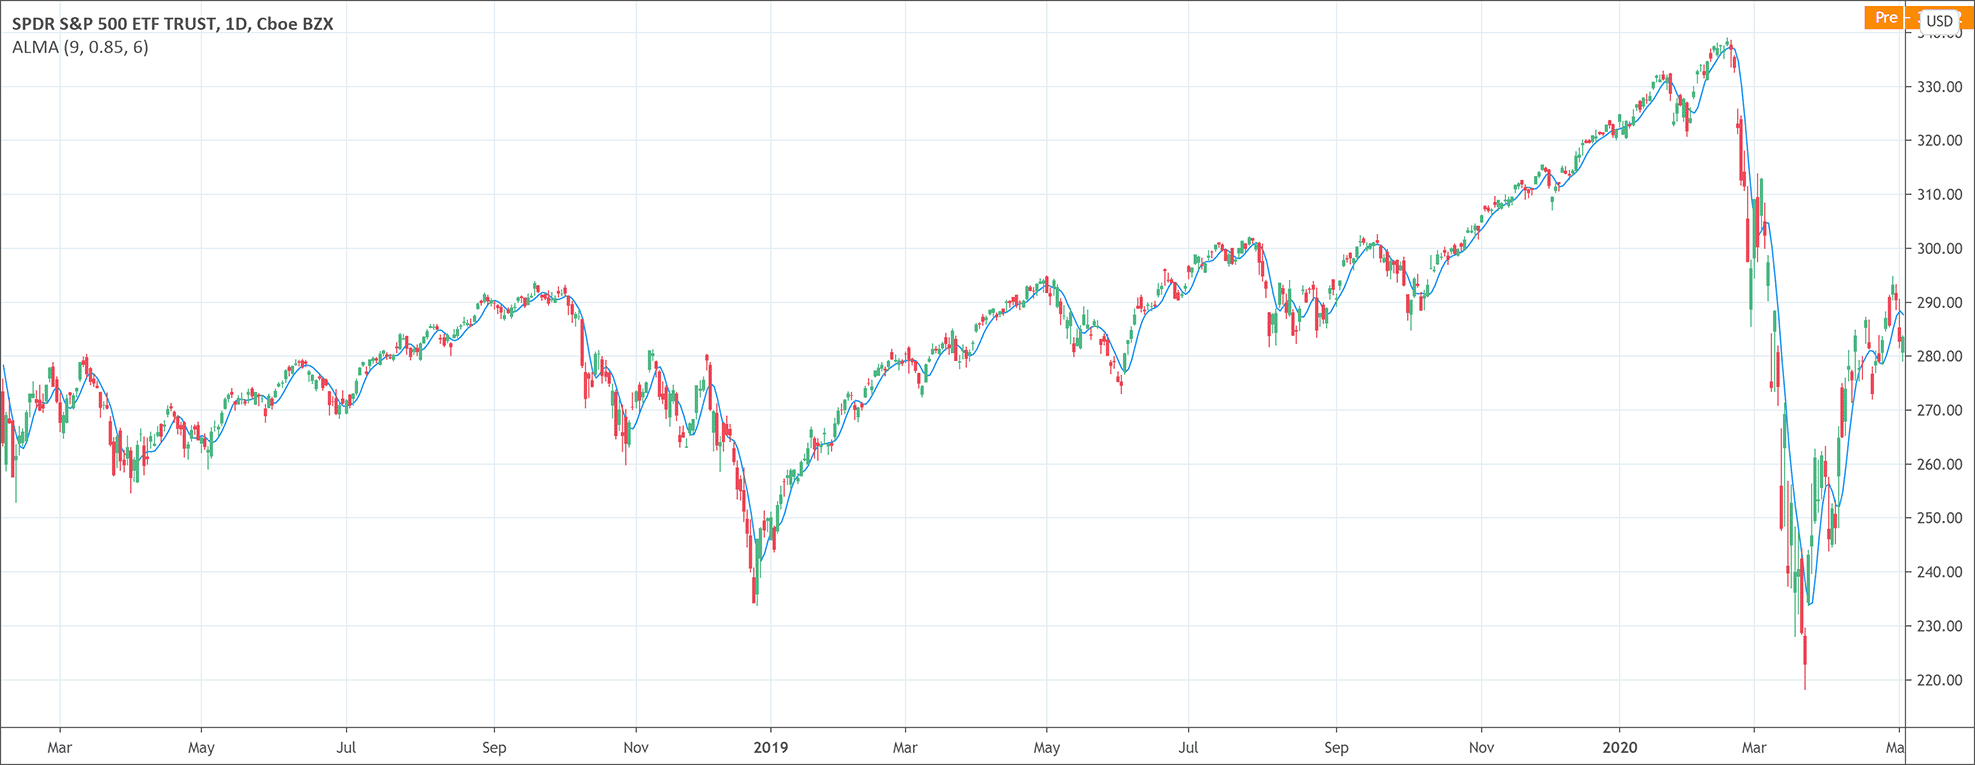
- The Arnaud Legoux moving average (ALMA) indicator filters out noise from the market to help the trend stand out.
- It uses Moving Averages to filter minor variations from the price.
Arnaud Legoux moving average (ALMA) indicator is a technical analysis tool that eliminates minor price fluctuations and enhances the trend of the market. It lessens the noise through zero-phase digital filtering and creates signals that are more reliable than the signals generated by other conventional moving averages. ALMA indicator applies a moving average twice, one from left to right and one from right to left, to enhance the trend. At the end of the ALMA process, price lag, normally associated with the other moving averages, also gets reduced.
We can say that Arnaud Legoux moving average is much superior to the conventional moving averages. The reasons are simple. The exponential moving average closely aligns with the prices, moves very fast, and hence it may generate many false signals. The simple moving averages is prone to move slowly and gives a signal very late. Arnaud Legoux moving average indicator offers no such problems. It makes a combo line by applying moving averages in two directions. Afterward, it adjusts the combo signal with a Gaussian Offset that can adjust the combo line to the standard deviation and the current price.
Three elements of the Arnaud Legoux moving average indicator
Arnaud Legoux moving average indicator has the following three elements.
- Window: Represents the time period and by default time period is 9 periods. Traders can adjust the time period according to their own trading style and policies.
- Offset: Offset is the Gaussian applied to the combo line and it is 0.85 by default. Setting offset at 1 makes it fully aligned to the current price just like the exponential moving average. While setting it to zero makes it just like a simple moving average. Traders may try offset combinations according to their own needs and preferences.
- Sigma: The standard deviation applied to the combo line. It makes the combo line sharper. Sigma has a value set to 6 by default.
Before you keep looking down this article, you should check 2 of courses I shortlisted in the New Trader University from Steve Burns (a very famous trader with about 400k followers on Twitter)!
- Moving Averages 101: this professional video series that will teach you how to use moving averages to be more profitable with less stress.
- Moving Average Signals: this course will illustrate how trading moving average signals with confidence and consistency can lead to profitability; consistently creating bigger wins and smaller losses.
How to interpret the Arnaud Legoux moving average indicator
ALMA indicator is a very useful tool that helps traders to identify trend direction, trend reversals, breakouts, and levels of support and resistance. It is a trend following indicator. ALMA trends upwards when the market is trending upwards. ALMA trends downwards when the market is trending downwards. When the price and ALMA are both moving upwards and the price rises above the ALMA, it indicates an upcoming reversal or breakout. As a result, the price and the ALMA start to move downwards. When both are trending downwards and the price moves below the ALMA, it suggests an upcoming upwards reversal. As a result, both of them start moving upwards.
How to trade with the ALMA indicator?
There are multiple ways to use the ALMA indicator for trading. For example, the asset price will remain above ALMA during a strong uptrend. Similarly, the asset price will remain below ALMA during a strong downtrend. Trading based on retracement and breakouts is also possible with the Arnaud Legoux moving average. Traders may also include Stochastic in the trading system to trade on the basis of overbought/oversold market conditions. However, experts always suggest using the Arnaud Legoux moving average indicator in conjunction with other technical analysis tools to increase the odds of maximizing the profits.

Before you go, check this two tremendous courses to expand your understanding of the moving averages: Moving Averages 101 & Moving Average Signals.
They both are created by Steve Burns. You surely saw him on Twitter as he has about 400000 followers. These courses will teach you how to use moving averages to be more profitable with less stress.

 Good Trading requires the Best Charting Tool!

 We loved Marwood Research’s course “Candlestick Analysis For Professional Traders“. Do you want to follow a great video course and deep dive into 26 candlestick patterns (and compare their success rates)? Then make sure to check this course!