
 Good Trading requires the Best Charting Tool!
Recognizing chart patterns is one of the most reliable techniques for trading the market. There are various chart formations that traders can observe and apply to their arsenal. Today, we will go through one of the most dependable chart patterns: the head and shoulders pattern.
It is easy to spot the head and shoulders chart pattern in technical analysis. It indicates a baseline having three peaks, the central peak is the tallest. The head and shoulders chart shows a bullish to bearish trend reversal. It indicates that an upward trend is coming to a close. The pattern can be used by novice and experienced traders to predict both forex and stock markets.
- The Head and Shoulders (H&S) top pattern is composed of three peaks.
- The two outside peaks are about the same height, and the middle one is the highest.
- It is a reversal pattern, from bullish to bearish.
What is the Head and Shoulders pattern?
The head and shoulders pattern is a chart figure that has a reversal character. As you can imagine, the name of the pattern comes from the visual characteristic of the pattern. It appears in the form of two shoulders and a head in between. The pattern begins with the creation of a top on the chart. The price action then makes a second top, which is higher than the first. A third head and shoulders top forms afterward, but lower than the second top and is approximately at the same level as the first top.
The pattern always comes up and can be used by all kinds of investors and traders. Its entry points, stop-loss levels, and price targets make it easy to apply. The chart pattern offers clear and simple levels.
How to identify the Head and Shoulders?
Identifying the head and shoulders pattern on both stock and forex charts entail the exact same actions; making it a versatile tool to include in any trading strategy.
When this pattern fully forms, it is seen as a major reversal pattern. There are five components to the head and shoulders pattern. They have to be present in order to confirm the pattern has formed.
Uptrend
This is the first part of a head and shoulders chart pattern. It is the higher extended move that eventually causes exhaustion. As a general rule, the longer the uptrend lasts, the more likely the reversal is to occur.
Left shoulder
As the market declines to form a higher low, things are beginning to come together, but we don’t quite have enough to draw the neckline. The left shoulder forms when traders pushing commodities higher lose enthusiasm temporarily.
Head
Now that the left shoulder has formed, the market makes a higher high which forms the head. But despite the bullish rally, buyers are not able to make a substantially higher low.
At this point, we have the left shoulder and the head of the structure. The neckline is also beginning to take shape, but the right shoulder is needed before we can draw the neckline on our chart.
Right shoulder
The right shoulder is where stock price rallies once again but fails to reach its initial high before it falls again. It shows that buyers are getting tired and that the market may be gearing up for a reversal.
As soon as it forms, we have enough to start plotting the neckline. But because the pattern isn’t complete yet, it is best to think of it as a rough draft rather than a final version.
Neckline
The neckline is considered the most important component in trading the H&S pattern because the H&S neckline acts as the trigger line for trading the pattern.
It is formed by drawing a line beneath the troughs made just before and after the head. When the price of stocks depreciates below this trend line, it is usually a good indication that the pattern has broken and it is time to sell.
The neckline support level is a vital component when getting into how to trade the breakout. Consider the neckline as the line in the sand between buyers and sellers.
What does the Head and Shoulders pattern tell traders?
Head and shoulders pattern is made up of three components:
- Price rises after a long bullish trend to a peak and subsequently goes down to form a trough.
- The price rises for a second time to make a second high, substantially over the previous peak and goes down again.
- Again, the price rises, but only to the level of the first peak, before it declines.
The first and third peaks form the shoulders, and the second peak forms the head. The line that connects the first and second troughs is known as the neckline.
Most traders believe that the head and shoulders pattern is one of the most accurate trend reversal patterns. It is one of several top patterns that indicate with different degrees of accuracy, that an upward trend is close to its end. Not only is it known for trend reversals, but also for its dandruff reversal.
A true head and shoulders pattern does not often occur, but when it does, most traders believe it indicates that a huge trend reversal has occurred. A standard head and shoulders pattern is considered to be a bearish setup.
How to trade when you see the Head and Shoulders?
Once a trader knows how to identify the standard and inverse head and shoulders patterns, it’s relatively simple to apply it for technical analysis in both equity and forex markets.
It is important for traders to wait for the pattern to complete, because a pattern may not develop at all or a partially developed pattern may not complete in the future. Partial or nearly completed patterns should be watched, but no trades should be made until the pattern breaks the neckline.
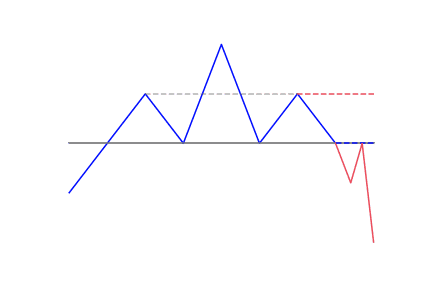
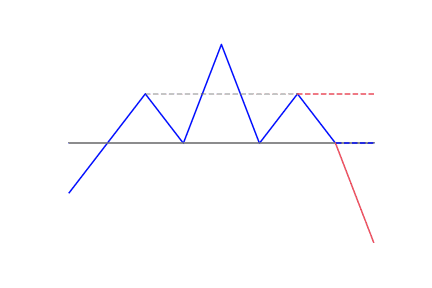
In the head and shoulders pattern, wait for price action to go lower than the neckline after the peak of the right shoulder. When applying the inverse head and shoulders, wait for price movement above the neckline after the right shoulder is formed.
A trade can be initiated when the pattern is completed. Plan the trade beforehand by writing down the entry, stops-loss, and profit targets, as well as taking note of all variables that could change your stop or profit target.
The most common entry point is when a breakout occurs – the neckline is broken and a trade is taken. Another entry point needs more patience and comes with the possibility that the move may be missed altogether. This method involves waiting for a pullback to the neckline after a breakout has already occurred. This is more conservative in that we can see if the pullback stops and the original breakout direction resumes, the trade may be missed if the price keeps moving in the breakout direction.
Stop-loss placement and risk control
Despite being a straightforward process, placing a stop-loss when trading the head and shoulders is a controversial topic – some traders prefer a stop above the right shoulder, while others choose a more aggressive placement. Like everything you do in the forex market, it comes down to what works best for you. The key point in trading is managing your risk!
Stop orders, in particular, can be used for trading head and shoulders patterns, both for preventing losses from downward price moves and for initiating purchases when the stock breaks higher. But be aware that there is no guarantee a stop order will be executed at or near the stop price.


 We loved Marwood Research’s course “Candlestick Analysis For Professional Traders“. Do you want to follow a great video course and deep dive into 26 candlestick patterns (and compare their success rates)? Then make sure to check this course!