
 Good Trading requires the Best Charting Tool!
- The triple top pattern is a bearish reversal pattern.
- It’s created when price bounces off resistance 3 time at similar levels.
- It’s a sign the sellers are coming in the market to avoid the security price to shoot higher.
What is a Triple Top pattern?
Triple top is a bearish pattern
A triple top or triple peak is a bearish chart pattern. It is very dependable in stock chart patterns used in technical analysis. It is straightforward and it is defined by three clear peaks that form about the same level in the market. This pattern is a specific form of the head and shoulders pattern. Just that the three peaks top around the same price levels the same way the double top does.
The first peak in this chart pattern is made when the prices fall back after a trending period in the market. Prices rise again to the same level as the first peak but buyers will not get sufficient momentum to drive prices up through the resistance. The third peak forms in the same way.
There’s a chance that prices can fall short or go beyond the previous highs, as long as they all top at the same price levels. No matter what happens, every peak has to be on a decreasing volume.
Triple top is an important pattern
The triple top is used in technical analysis to determine the reversal in the movement of the price of an asset. Made up of three peaks, a triple top indicates that the asset may no longer be coming up. Lower prices may be on the way.
This chart pattern can be present on all time frames. But for the pattern to be termed as a triple top, it has to be found after an uptrend. The triple bottom is the opposite of a triple top. It shows that the price of an asset is no more falling and could get higher.
The trading strategy aims to take advantage of a simple yet very dependable chart pattern. One of the major advantages of a reversal trading strategy is that it offers traders the chance to be part of a new trend right from the start.
The triple top chart patterns can take a long period to spread out over time, but it is about viewing the battle between the sellers and buyers. But on intraday times the triple top reversal can come up more often which is the reason why traders prefer day trading with the triple top chart pattern trading strategy.
Types of Triple Tops
Various types of triple tops that can be separated by three criteria:
- The shape of the peak: The peak can look like an inverted V (called Adam troughs) or an inverted U (Eve troughs)
- The level of the second peak: The second peak could be higher, at the same level or lower than the first peak
- The level of the third peak: The third peak could be higher, at a similar level or slightly lower than the second peak
How to identify the Triple Top pattern?
Some rules that need to be defined about this chart pattern:
Rule 1: To have a reversal, there has to be a prior trend in the background in order. In the case of the triple top reversal, look for a bullish trend that has finally gotten into a swing high area from where we got enough selling activity to prevent the bullish trend from continuing.
Rule 2: How strong the bullish trend is might determine the strength of the sell-off.
The triple top reversal tells traders
- that buyers are getting tired
- or they are not aggressive enough to drive the price higher.
In the same instance, the sellers are beginning to become a bit more aggressive as they are planning to pay the higher price and we get to a point of equilibrium between buying and selling power.
The pattern is a more powerful reversal pattern. By the third failed attempt to break above resistance, more sellers notice that buyers are weak and unable to drive the price higher, so they aggressively come in and then manage to drive the price lower.
What does the Triple Top pattern tell traders?
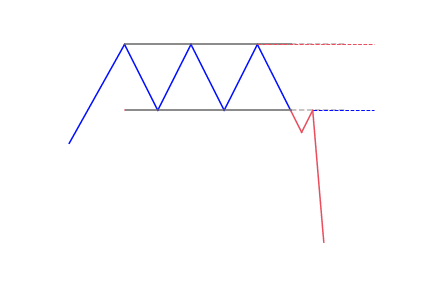
The triple top pattern comes up when the price of an asset makes three peaks at almost the same price level. The area of each peak is resistance. The pullbacks between the peaks are known as the swing lows. After the third peak, if the price goes down below the swing lows, the pattern is termed complete and traders lookout for a further move to the downside.
The three peaks create the triple top visually similar to the head and shoulders pattern; but in this instance, the midpoint is nearly the same as the other peaks rather than being higher. Also, this pattern is similar to the double top pattern, when the price gets to the resistance area twice, making a pair of high points before falling.
Significance of a Triple Top
A triple top pattern technically indicates that the price is not able to get to the area of the peaks. Applied into real-life events, it entails that, after various attempts, the asset is not able to get many buyers in that price range. As the price declines, it puts pressure on all the traders who bought during the pattern to begin selling.
If the price cannot rise above resistance there’s little profit potential in holding onto it. As the price goes below the swing lows of the pattern, selling may rise as former buyers leave losing long positions and new traders get into short positions. This is the psychology of the pattern, and what helps fuel the selloff after the pattern completes.
No pattern works all the time. At times, a triple top will form and complete, causing traders to believe the asset will keep on falling. But then, the price may then recover and move over the resistance level. For protection, traders could place a stop-loss on short positions above the latest peak, or above a current swing high within the pattern. This move reduces the risk of the trade if the price doesn’t go down and rather rallies.
How to trade when you see the Triple Top pattern?
Traders could enter into a short position, or leave long positions when the price of the asset falls lower than the pattern support. The support level of the pattern is the most current swing low after the second peak. Alternatively, a trader might connect the swing lows between the peaks with a trend line. When the price goes down below the trend line, the pattern is termed complete and a further decrease in price is expected.
To further confirm the pattern, traders will look out for huge volume as the price goes down through support. Volume should pick up indicating a strong selling interest. If the volume doesn’t increase, the pattern is more likely to fail (price rallying or not falling as it should).
The pattern gives a downside target similar to the height of the pattern subtracted from the breakout point. This target is an estimate. At times, the price will go down much lower than the target, other instances it will not reach the target. Other chart patterns and technical indicators may also be used together with the triple top.
The traditional trading strategy
- Entry Point: Open a short position after the neckline.
- Stop-Loss: The stop-loss is positioned over the neckline.
- Advantage: The trade has a high likelihood of success.
- Disadvantage: Pullbacks can overshoot the neckline due to this a stop-loss placed too close can be blindly hit. To prevent this, wait for the pullback on the neckline before opening a position. This makes it possible to place stop-loss better.
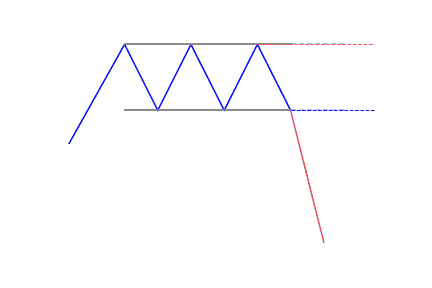
The aggressive trading strategy
- Entry Point: Open a short position after the second or third peak forms.
- Stop-Loss: The stop-loss is positioned over the highest peak.
- Advantage: There is a high gain and risk ratio as the stop-loss is positioned near the entry point.
- Disadvantage: The percentage loss is higher since the triple top pattern is not yet confirmed.
Anyway, make sure you include it to your plan before you use it live. Always follow your trading plan!


 We loved Marwood Research’s course “Candlestick Analysis For Professional Traders“. Do you want to follow a great video course and deep dive into 26 candlestick patterns (and compare their success rates)? Then make sure to check this course!