
 Good Trading requires the Best Charting Tool!
Chart patterns usually occur when the cost of an asset goes towards a direction that a common shape, like a rectangle, triangle, head and shoulders, or in this case, a cup and handle pattern. These patterns are great ways to trade visually. They offer a logical point of entry, a stop-loss place to manage risk, and a price target for leaving a profitable trade.
- The cup and handle pattern is called this way because it resembles a true cup and handle where the cup is in the shape of a letter “U” and the handle has a slight downward drift.
- It is considered a bullish signal extending an uptrend.
What is the Cup and Handle pattern?
The Cup and Handle is a bullish continuation pattern
The Cup with Handle is a bullish continuation pattern. William O’Neil created this pattern and introduced it in his book, How to Make Money in Stocks, in 1988.
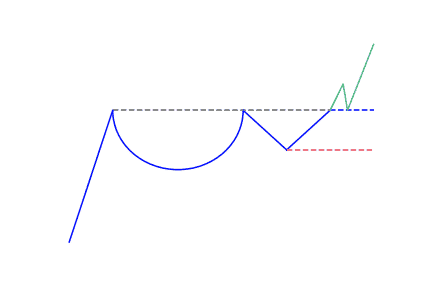
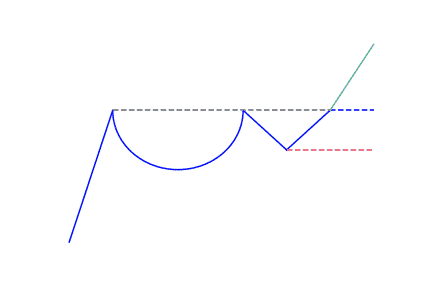
This pattern consists of two parts, the cup and the handle. The cup forms after an advance and looks like a bowl or an object with a round bottom. Trading range forms on the right-hand side as the cup is completed, and that makes the handle. A subsequent breakout from the trading range of the handle shows a continuation of the prior advance.
Technically, a cup and handle pattern on the price of a security is an indicator that looks like a cup with handle, where the cup has a ‘u’ shape and the handle having a slight downward drift. The cup and handle is considered as a bullish signal, with the right-hand side of the pattern having trades in low volume. The formation of the pattern may be as short as a few candles, or long as several weeks (or even months).
It comes with different shape and size
The pattern can be seen in both small timeframes, like a one-minute chart, and in big time frames, such as daily, weekly, and monthly charts. It occurs when there’s a wave down of price, followed by a period of stabilization, and then followed by a rally of approximately equal size to the prior decline.
The price drifts sideways or moves downward within a channel that forms the handle. The handle may also look like a triangle. With this chart pattern, the handle has to be smaller than the cup. It should not drop into the lower half of the cup; it should stay in the upper third.
A cup and handle chart may indicate either a continuation pattern or a reversal pattern. A reversal pattern can be seen when the price is in a long-term downtrend, then forms a cup and handle that reverses the trend as the price begins to rise. A continuation pattern on the other hand occurs when there’s an uptrend; the price rises and forms a cup and handle, and then continues to rise.
How to identify the Cup and Handle?
The markets smoothly draws the pattern
To identify the cup and handle pattern, begin by following the movement of price on the chart. The pattern forms when it notices a sharp downward price movement over a short period. This is followed by a time where the price remains quite stable. Subsequently, there’s a rally that is almost equal to the previous decline.
When the price gets to the top of the cup, it begins moving sideways or downwards to make the handle. If the handle drops below the lower half of the cup, it ceases to be a cup and handle pattern. Most times, the handle should not go lower than the top third of the cup for it to be considered a cup and handle pattern.
Quick guide to identify the pattern
It is slightly more difficult to understand the cup and handle pattern when compared to other chart patterns. Most traders find this tricky to identify. To help you successfully identify the pattern, here is a simple guide:
- It is seen as a bullish continuation pattern, due to this, it is essential to identify a prior uptrend. Traders can do this by making use of price action techniques or other technical indicators like the moving average.
- The cup usually forms a ‘u’ shape rather than a ‘v’, with the high points on either side of the cup being almost the same.
- The handle looks like a consolidation, which is in the form of a pennant pattern or a flag pattern. This should be sloping downwards, but it consolidates sideways at times, that looks like a rectangle pattern.
- Depending on their preference, traders see the breakout signal in various ways. Some traders view the level of resistance taken from the horizontal between the highs of the cup. When this level breaks up, traders can enter a trade. Other traders make use of a handle break trend line as a point to place a long entry.
What is an Inverted Cup and Handle?
This chart pattern shows a bearish continuation that triggers a signal to sell. It can be considered as a cup and handle that is upside-down.
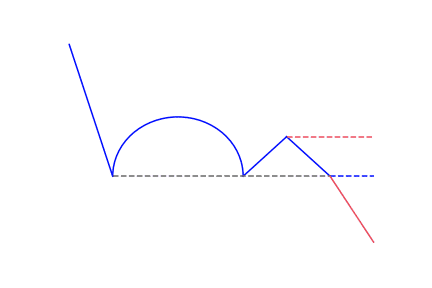
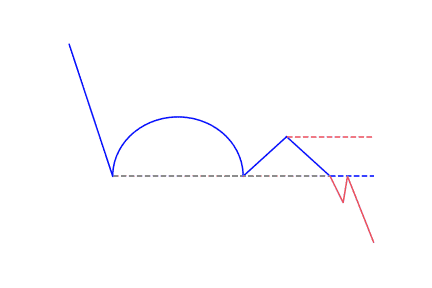
When looking at a regular cup and handle pattern, you’ll notice a distinct ‘u’ shape and downward handle, which is followed by a bullish continuation. This means an inverted cup and handle is the opposite of the regular cup and handle. Rather than it to form a ‘u’ shape, it makes an ‘n’ shape, with the handle slightly bending upwards on the chart.
What does the Cup and Handle pattern tell traders?
When a stock forming this pattern reaches old highs, it experiences selling pressure from investors who bought at those levels previously. Selling pressure will probably make price consolidate with a tendency toward a downtrend trend for a period of three days to five weeks, before going higher. A cup and handle is seen as a bullish continuation pattern and it tells traders the right opportunities to buy.
It is wise to consider these indicators when using a cup and handle pattern:
- Length: Generally, cups that have longer and more U-shaped bottoms give a better signal. Avoid cups with a sharp V-shaped bottom.
- Depth: Ideally, a cut shouldn’t be too deep. Keep off handles that are also too deep, because handles should form in the upper half of the cup.
- Volume: Volume should go down as prices decrease and remain less than average at the bottom of the bowl; it should then increase when the stock starts to move higher to test the former high.
It is not mandatory to test a previous resistance to come close to the old high; but the further the top of the handle is away from the highs, the more significant the breakout should be.
How to trade the Cup and Handle pattern?
Trading with the cup and handle pattern is slightly different when applying it in trading forex and equities. The volume function is often used in stock trading as a rise in volume shows the breakout which confirms the signal to enter the trade.
Forex trading does not normally make use of this; rather, it makes use of other more conventional breakout confirmation methods such as breaks over the resistance. The remaining process is similar when trading the cup and handle pattern.
- Opening a Trade: It is best to open a trade after confirming the appearance of the pattern.
- Stop Loss: Just as it is with a lot of patterns, traders need to set up a stop-loss when trading the cup and handle patterns.
- Take Profit: The take profit targets for the cup and handle is the same as the two targets mentioned above. The first take-profit target should be found on a distance equal to the size of the handle, beginning from the breakout point. If this target is completed, you can then begin pursuing the next target. The second target should be found at a distance the same as the cup’s size, applied again from the breakout time.
It is however advisable to remain in the trade as long as the price is trending favorably. You may not want to completely exit the trade, where the price move is having more potential to increase the profit of your trade. Therefore, you can observe clues in price action so as to increase the profits of the trade.


 We loved Marwood Research’s course “Candlestick Analysis For Professional Traders“. Do you want to follow a great video course and deep dive into 26 candlestick patterns (and compare their success rates)? Then make sure to check this course!