
 Good Trading requires the Best Charting Tool!
- The pennant pattern is a continuation pattern.
- The pennant shows a time of consolidation before to (likely) continue of the same trend with a breakout.
- The consolidation period should have lower volume and the breakouts should occur on higher volume.
What is the Pennant pattern?
Some traders use the pennant pattern as an entry pattern for continuing a current trend. It usually forms after a sharp price movement that can contain gaps (referred to as the mast or pole of the pennant). The pennant represents a time of indecision in the middle of the complete move, consolidating the prior leg. The price oscillates within a small symmetrical triangle that begins wide and converges to a point as the pattern forms. They appear in any market and traders use them to predict market movements in the future.
There are two types of pennant patterns:
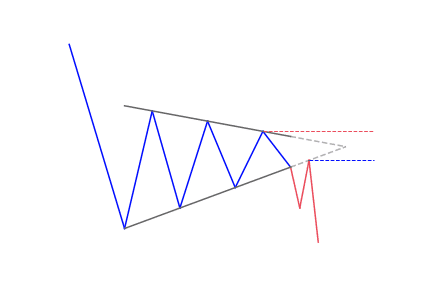
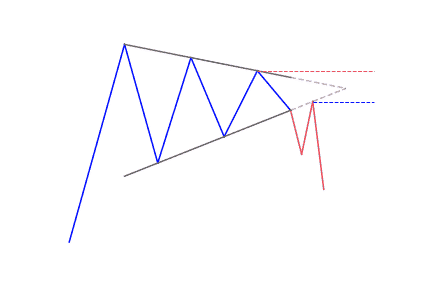
Bearish Pennants
They are continuation patterns that indicate a pause in the movement of a price halfway through a strong downtrend. It gives traders an opportunity to go short. The bearish pennant occurs just after a sharp drop in price and look like a triangular flag as the price moves sideways, gradually making lower highs and higher lows.
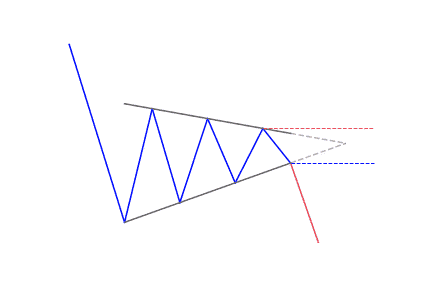
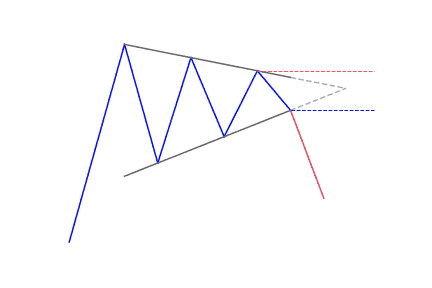
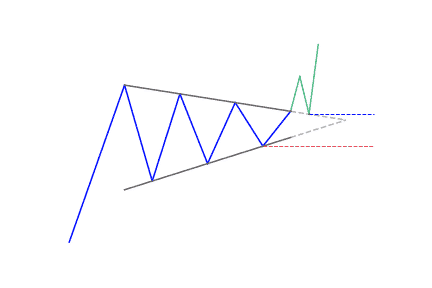
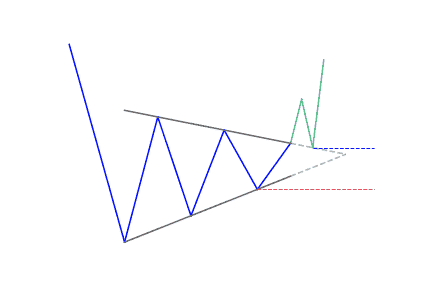
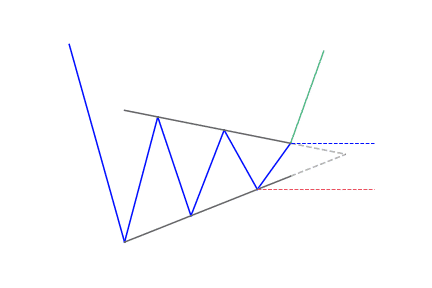
Bullish Pennants
It is the total opposite of a bearish pennant. It marks a pause in the movement of a price halfway through a strong uptrend. This allows traders to go long and profit from the rest of the price rise.
How to identify the Pennant pattern?
When looking at a pennant continuation pattern, you will notice the following attributes:
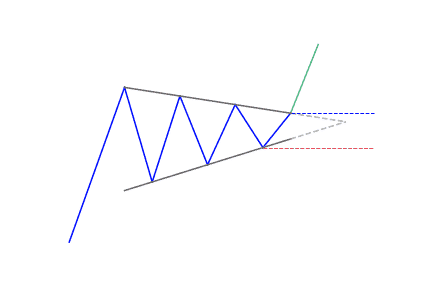
- A flagpole: A Pennant pattern always starts with a flagpole. This differentiates it from other types of patterns (like the symmetrical triangle). The flagpole is the initial strong move that comes after the symmetrical triangle.
- Breakout levels: There will be two breakouts, one at the end of the flagpole, and the other after the consolidation period, where the upward or downward trend continues.
- The Pennant itself: The Pennant is the triangular pattern. It forms when the market consolidates, between the flagpole and the breakout. The two converging trend lines form the triangle (the pennant).
What does the Pennant pattern tell traders?
Pennants can be seen when a security experiences a large upward or downward movement, followed by a short consolidation, before continuing to move in the same direction. The pattern resembles a small symmetrical triangle called a pennant, which is made up of numerous candlesticks.
Although it is similar to the triangle pattern, the pennant pattern has some vital differences that traders need to be aware of. Pennant patterns are usually described as being bearish or bullish, depending on the direction of the movement.
Pennants, which are similar to flags in terms of structure. They both have converging trend lines during their consolidation period and can exist with any duration should possess a weak volume. It should be followed by a huge volume increase during the breakout.
How to trade when you see the Pennant pattern?
A lot of traders like to enter new short or long positions after a breakout from the pennant chart pattern. For instance, a trader may see that a bullish pennant is forming and place a limit buy order just above the upper trend line of the pennant. When the security or commodity breaks out, the trader may look for above-average volume to confirm that pattern. They can hold the position until it gets to its price target.
Often, the price target for pennants is established by using the height of the previous flagpole to the point at which the price breaks out from the pennant. For example, if a stock rises from $50.00 to $100.00 in a sharp rally, consolidates to around $80.50, and then breaks out from the pennant at $90.00, a trader might look for a $140.00 price target on the position – or $50.00 plus $90.00. The stop-loss level is often set at the lowest point of the pennant pattern, because a breakdown from these levels would invalidate the pattern and could mark the start of a longer-term reversal.
Traders make use of pennants together with other technical indicators or chart patterns that serve as confirmation. For instance, traders may watch for relative strength index (RSI) levels to moderate during the consolidation phase and get to oversold levels which make it possible for a potential move higher. Or, the consolidation may occur near resistant levels of trend line. A breakout could make a new level of support.
Differences between Pennant Patterns and Symmetrical Triangles
Even though both pennant pattern and symmetrical triangle are continuation patterns with a good degree of accuracy, there are two key differences between the two when it comes to their formations.
Pennant Patterns
In technical analysis, a pennant is a continuation pattern. It forms when there is a big movement in a commodity or security. This is called the flagpole. Then there is a consolidation period with converging trend lines (the pennant). Then there is a breakout movement in the same direction as the initial big movement. This represents the second half of the flagpole.
Pennants, which are similar to flags in terms of structure, have converging trend lines during their consolidation period. The volume at each period of the pennant is also important. The initial move must be met with large volume while the pennant should have weakened volume, followed by a large increase in volume during the breakout.
Symmetrical Triangle
A symmetrical triangle chart pattern represents a consolidation time before the price is made to breakout or breakdown. A breakdown from the lower trend line indicates the beginning of a new bearish trend. On the other hand, a breakout from the upper trend line shows the beginning of a new bullish trend. The pattern is also referred to as a wedge chart pattern.
The price target for a breakout or breakdown from a symmetrical triangle is the same as the distance from the low and high of the earliest part of the pattern applied to the breakout price point.
Differences
The Flagpole
Both the pennant pattern and symmetrical triangle have conical bodies that form during a consolidation time. Price constantly gets to higher lows and lower highs, making two converging trend lines that make a conical shape. But the pennant has a flagpole at the start of the pattern. This is not present in the formation of the symmetrical triangle.
The flagpole is a vital quality of the pennant. It is created when price suddenly spikes dramatically in the direction of the occurring trend, forming a line that is almost vertical. This sharp move is followed by heavy volume and indicates the start of an aggressive move within the current trend. Price then pauses, forming the body of the pennant, before breaking out in the direction of the trend with renewed motivation.
Duration
A second difference between the pennant and the symmetrical triangle is their durations. The pennant is a short-term pattern that appears for days or possibly weeks. Ideally, a pennant pattern can last between one and thirty days. A triangle pattern can take much longer, at times coming up for months or years. If a pennant pattern drags on into its 12th or 13th week, it usually becomes a triangle.
The breakout after a pennant pattern should be present at or close to the point where the trend lines meet, called the apex. However, when dealing with a symmetrical triangle, price needs to break above or below the trend lines one-half to three-quarters of the way through the pattern.
This shows that the pattern often never gets to its apex, creating a flat-topped cone rather than an actual triangle. A breakout eventually occurs one way or the other as the price gets close to the apex. But a breakout too early or too late may indicate a weaker pattern and a less robust continuation.


 We loved Marwood Research’s course “Candlestick Analysis For Professional Traders“. Do you want to follow a great video course and deep dive into 26 candlestick patterns (and compare their success rates)? Then make sure to check this course!