
 Good Trading requires the Best Charting Tool!
- The Flag pattern is a continuation pattern.
- Its formation is a strong sign of consolidation (price stops to trend for a while to build back momentum).
- It is identifiable with 3 components: the flagpole, the flag (the consolidation part) and the continuation.
The flag pattern is a powerful pattern used in technical analysis. It is a continuation pattern and it also represents consolidation. Being a continuation pattern, it predicts that the market will continue in the same direction after the end of the pattern. The flag forms after a significantly large price movement as it represents market consolidation. After a strong up or down movement, the flag formation tends to embed consolidating prices. According to the flag, prices continue in the same direction after breaking out of the formation.
There are several trading patterns that traders use to identify moves but none of them is as efficient and effective as the flag pattern. It is also very easy to identify its characteristics. That makes it perfect for novices and beginners to begin with. The flag pattern is one of the most reliable patterns to predict an upcoming reversal of trends or breakouts after a consolidation period. Technical analysts and traders use the flag pattern to enter the market, set profit targets, and to set a stop-loss.
Components of the flag pattern
The working of the flag pattern is quite simple. It is named the flag pattern because its use reminds traders of a flag on a flagpole. This is because, in shorter time periods, it moves in the opposite direction of the current price trend in the market that we observe on the trading chart in a longer period of time. The flagpole, the flag, and the continuation are the three components of the flag formation. Both bullish and bearish flag patterns have the same components but are in inverse shape over the chart.
- The flagpole represents the initial price movement and it can represent both, uptrend or downtrend. The angle of the slope is irrelevant as far as the validity of the flag formation is concerned. The overall distance of the price movement is calculated by measuring the difference between the previous low or high and the current low or high.
- The flag represents the consolidation of the market after a strong price movement. The formation of the flag is the key to the flag pattern. The length of the time period is irrelevant but is important to note that more aggressive breakouts occur after longer periods of consolidation.
- The continuation is the point of the flag formation that shows the end of consolidation and indicates that the market is again trending in the original direction.
Bullish flag pattern
What is it?
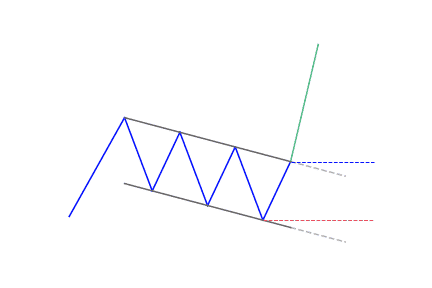
The bullish flag forms during a bullish trend. The bull flag starts with a strong, almost vertical, bullish trending move which then stabilizes and then turns into a minor bearish correction with parallel tops and bottoms. The upside breakout confirms the bullish flag pattern and traders prepare for a long position. The formation of the bull flag takes short-sellers of the guard as more buyers jump into the market. The price peaks eventually, prices rise and form a pullback while the lows and highs are parallel to each other. Hence, the bull flag chart pattern resembles a rectangle or downward sloping channel because of those parallel trend lines.
How to identify the bullish pattern?
There are three components of any flag pattern that makes it a bit difficult to identify the pattern. It is necessary to correctly identify the bull flag to make a move successful. The following are some hints to correctly identify the bull flag.
- Look for a preceding uptrend making flagpole as we know that a bullish flag pattern forms during a bullish trend
- Identify the formation of the bull flag as a result of downward sloping consolidation
- Generally, the retracement ends below the 38% threshold of the original trend. It may not be a flag pattern if the retracement goes below the 50%
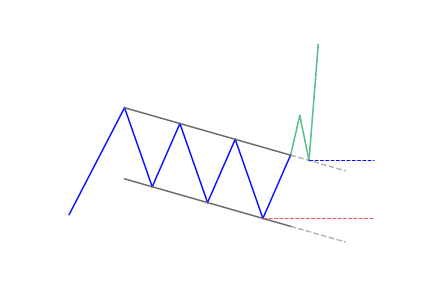
- Look to enter on the breakout above the upper channel’s high or at bottom of the flag
- Wait for the price break out high with height equal to the flagpole
How to trade when you see a bullish flag pattern?
To trade the bullish flag, traders can enter the market at the bottom of the price channel or show patience for price break above the high of the upper channel. Traders then seek profit by analyzing the flagpole length preceding the flag. However, the reliability of the bull flag pattern depends on the correct identification of the pattern. It is a formidable pattern for forex trading if it is correctly identified after locating all of its components on the chart.
Bearish flag pattern
What is it?
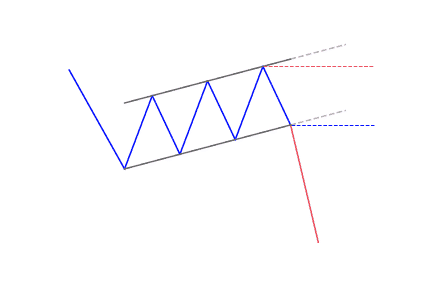
The bearish flag is exactly the inverse of the bullish flag pattern. The bullish flag formation forms down to upside while the bear flag forms upside down. It has all the components that a bull flag has, but are the only inverse. The bear flag forms during a bearish trend in the market as a result of the price drop as sellers take control of the market. After the bounce or consolidation channel in an upward direction, parallel upper and lower trend lines then form the bear flag.
How to identify the bearish pattern?
As we have discussed earlier that identification of a flag is not an easy one because of its components. If traders truly understand the pattern’s components, the identification gets easy. The following are some hints to correctly identify the bear flag.
- Look for a preceding downtrend making a flagpole as we know that the bear flag forms during a bearish or downward trend
- After the decline, the flag appears during a period of consolidation. After the consolidation, the prices may move upward retracing a portion of the initial decline
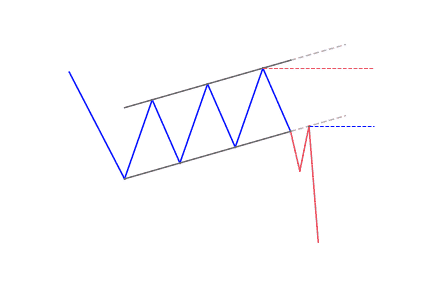
- Now look for the continuation component of the flag when the prices begin to fall to continue the original trend.
How to trade when you see the bearish flag pattern?
To trade the bearish flag pattern, traders may enter the market when a candle closes below the lower level of the bear flag pattern. Traders may also place the stop-loss above the highest high of the flag. Technical analysts and experts suggest taking profit at each target level as it will maximize the profits and reduce the risks. The bear flag pattern is considered an extremely reliable pattern if all of its components are correctly identified. The successful trading of the bearish flag depends totally on the correct identification of the pattern.
Conclusion
The flag formation is one of the most reliable patterns for consolidation and continuation. It has three components – flagpole, flag, and continuation. The flagpole represents the current trend before the formation of the flag. The flag represents the consolidation phase and the continuation represents the continuation of the original trend. The trading strategies vary from bullish flag to bearish flag. However, to trade the flag pattern successfully, it is imperative to correctly identify all the components of the flag pattern.


 We loved Marwood Research’s course “Candlestick Analysis For Professional Traders“. Do you want to follow a great video course and deep dive into 26 candlestick patterns (and compare their success rates)? Then make sure to check this course!