
- The channel pattern is a technical analysis pattern that capitalizes on the trending tendencies of the market.
- It is also known as price channel.
- This pattern appears in the market when price oscillates between two lines with the same slope.
- It can be a rising channel or a falling channel.
If you’re wondering where to go to chart your favorite markets and hunt for channel patterns, the best charting tool is TradingView. Click here to get started for free with TradingView!
What is the channel pattern?
The channel pattern, also known as price channel, is a technical analysis tool that capitalizes on the trending tendencies of the market. It is a continuation pattern that shows the bouncing of prices between parallel lines of resistance and support. The lower trend line indicates support while the upper trend line indicates resistance. The parallel lines of resistance and support can be sloping downward (forming falling channel), sloping upward (forming rising channel), or run horizontally. The main advantage of the channel pattern is that it works with any trading timeframe disregarding whether you are trading short or long.
The area between the two trend lines of the channel pattern is a channel. The trend line is a line that runs over pivot lows or highs to indicate the prevailing trend in the market. The upper trend line connects price highs while the lower trend line connects the price lows. Price highs and lows represent prices reached by security before going back to the other direction. Hence, the channel pattern forms by the combination of the upper trend line and the lower trend line. These lines always remain parallel to each other and form a channel between themselves when drawn on a chart.
The channel formation can be of two types, bullish channel and bearish channel. When the price channel pattern shows an upward movement, it is a bullish pattern or rising channel pattern. On the other hand, when the movement is downward, it is a bearish or falling channel pattern.
Drawing the channel pattern
It is important to draw the channel correctly for successful trading. The following are some key points that must be kept in mind when drawing a channel formation.
- Both trend lines must be parallel to each other
- Never force the price to the channels
- Sloping channel boundary at one angle while the other channel boundary sloping at another is not a correct channel pattern and it may lead to unsuccessful trades
Bullish or rising channel pattern
What is it?
A bullish or rising channel pattern forms when a price sets higher highs followed by the lower lows. The price remains within the channel support and channel resistance lines. Until the prices continue to advance and trade within the boundary of the channel, the trend remains bullish. When prices fall short of the resistance channel line, it signals an upcoming change in trend. A break below the support line provides further indication of the trend change. The break above the resistance channel line indicates the continuation of the bullish trends.
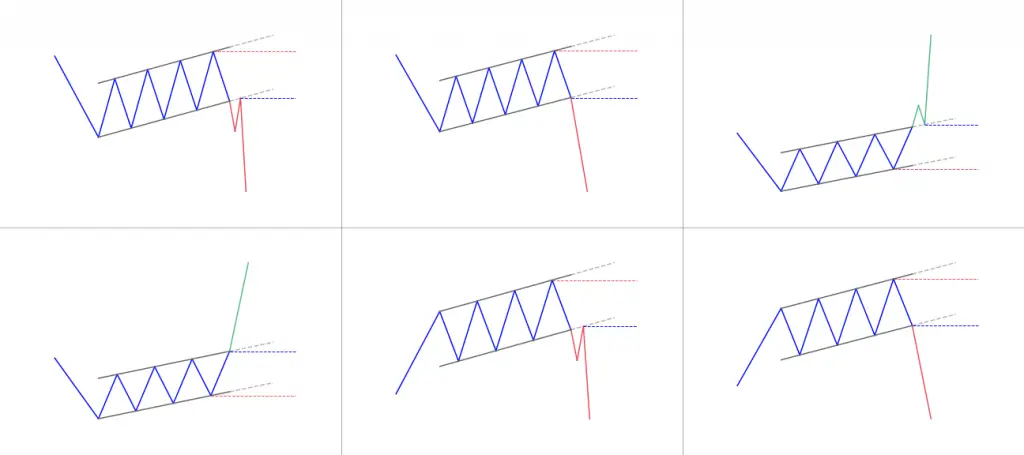
How to trade a rising channel?
In a rising channel, when prices touch the support trend line, some traders look to buy. Technical analysts advise taking a short position when the price breaks below the lower channel line of a rising channel. On the other hand, taking a long position is a viable option when the price touches the lower trend line of the rising channel and exit the trade when the price reaches the upper channel line. Traders can place stop-loss a little bit below the lower line to be on the safe side and avoid losses if the price abruptly reverses its direction.
Bearish or falling channel pattern
What is it?
A bearish or falling channel pattern forms when a stock’s price reaches lower lows followed by the higher highs. The price movement remains within the channel support and channel resistance lines. The trend remains bearish until the prices continue to decline and trade within the boundary of the channel support and channel resistance lines. When prices are not able to reach the support channel line, it is an indication of a change in trend. The price break above the resistance channel line further strengthens the indication of a change in trend. The price break below the resistance channel line indicates the continuation of the bearish trend.
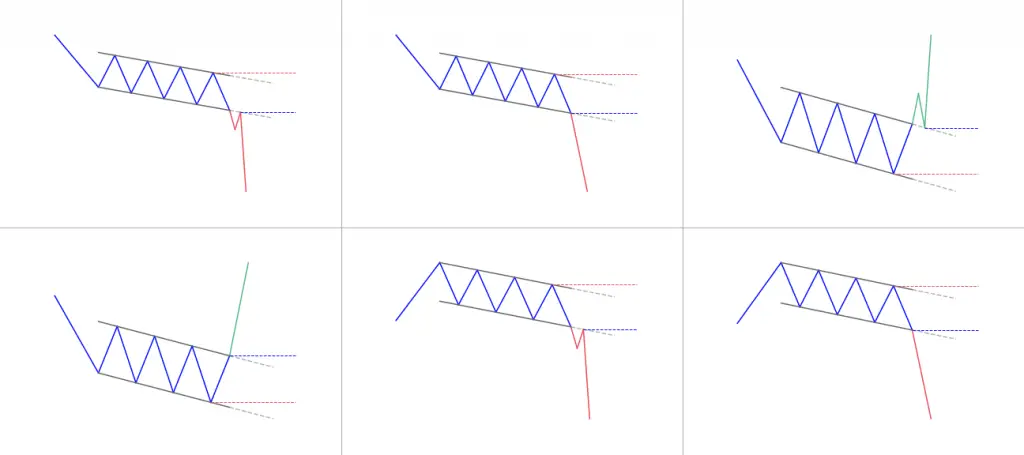
How to trade the falling channel?
Some traders prefer to sell or go short when the prices reach the resistance channel line in a falling channel pattern. A breakout strategy suggests buying when the price breaks above the channel. Traders suggest going short by placing stop-loss just below the highest high and go long by placing stop-loss just below the lowest low.

If you’re still looking for a trusted source to get your price charts, TradingView is the solution! Most of the charts you can see on the website come from there. It’s both user friendly, performant and very affordable. They let you freely chart almost any asset with all indicators you could think about.
Click here to get start on TradingView for free!
Conclusion
The channel pattern is one of the best continuation patterns that are useful for any kind of market condition. The channel pattern consists of two trend lines, upper and lower, and a channel between those lines.
For a channel to form, it is necessary for the trend lines to be parallel to each other. The upper trend line represents the higher highs while the lower trendline represents the lowest lows.
The channel formation tells traders is useful to look for breakouts, placing stop-losses, and taking profit strategies depending upon the overall trading strategy of an individual trader. However, it is also crucial to correctly identify the channel pattern. Furthermore, it is equally important to identify correctly whether it is a falling channel or a rising channel.
The channel formation is one of the most effective and powerful technical analysis tools that also can combine with other technical analysis tools to give traders precise information to enter or exit the market, place stop-loss, and take profits.


 We loved Marwood Research’s course “Candlestick Analysis For Professional Traders“. Do you want to follow a great video course and deep dive into 26 candlestick patterns (and compare their success rates)? Then make sure to check this course!