Breakaway candlestick pattern: Full Guide

Candlestick patterns

Breakaway candlestick pattern
  • The breakaway candlestick pattern is a five bar reversal candlestick pattern.
  • It can be bullish or bearish.
  • The first candle must be a long candle.
  • The next three candles must be spinning tops. 
  • The second candle must also create a gap between the first and itself. 
  • The fifth candle must be a long candle closing within the body gap of the first two candles.

Statistics to prove if the Breakaway pattern really works

Are the odds of the Break Away pattern in your favor?


How does the Break Away behave with a 2:1 target R/R ratio?

Success rate

From our research the Break Away pattern confirms 70.1% of the time on average overall all the 4120 markets we analysed. Historically, this patterns confirmed within 2.5 candles or got invalidated within 6.9 candles. If confirmed, it reached the 2:1 R/R target 37% of the time and it retested it's entry price level 96.5% of the time.
Not accounting for fees, it has an expected outcome of 0.109 $/$. It means for every $100 you risk on a trade with the Break Away pattern you make $10.9 on average.
Want to account for your trading fees? Have the detailled stats for your favorite markets / timeframes? Or get the stats for another R/R than 2:1?
🚀 Join us now and get fine-tuned stats you care about!

How to handle risk with the Break Away pattern?


We analysed 4120 markets for the last 59 years and we found 412 occurrences of the Break Away pattern.
On average markets printed 1 Break Away pattern every 37 869 candles.

For 2:1 R/R trades, the longest winning streak observed was 6 and the longest losing streak was 12. A trading strategy relying solely on this pattern is not advised. Anyway, make sure to use proper risk management.

Stack the odds in my favor NOW!

Keep in mind all these informations are for educational purposes only and are NOT financial advice.

If you want to learn more and deep dive into candlestick patterns performance statistics, I strongly recommend you follow the best available course about it. Joe Marwood (who's a famous trader with more than 45 000 Twitter followers) created an online course called "Candlestick Analysis For Professional Traders" in his Marwood Research University. There he will take you through the extensive backtesting of the 26 main candlestick patterns. He then summarizes which one is THE best pattern. Do you know which one it is?
Remember, don't trade if you don't know your stats. Click here to signup to the course now!

The breakaway candlestick pattern is a five bar candlestick pattern that predicts an upcoming reversal of the trend in the market. It is a rare candlestick pattern and traders do not consider it a reliable pattern. The breakaway pattern is found in two variants, the bullish breakaway, and the bearish breakaway. 

The bullish breakaway candlestick pattern 

The bullish breakaway candlestick pattern appears during a downtrend in the market that predicts the upcoming bullish reversal of the market. 

Bullish breakaway pattern

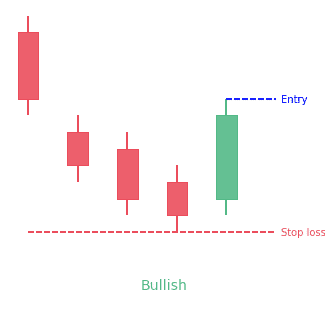
How to identify the bullish breakaway candlestick pattern? 

A pattern needs to meet the following conditions to be a bullish breakaway candlestick pattern. 

  • The first candle must be a long black candle.
  • The next three candles must be spinning tops having short real bodies while the second and fourth candles must be black that confirms the pattern. 
  • The second candle must also create a gap between the first and itself
  • The fifth candle must be a long white candle closing within the body gap of the first two candles.

What does the bullish pattern tell traders? 

The appearance of the first long black candle indicates the presence of a downtrend in the market. The next three small bearish candles suggest that the bears are losing control and bearish price swing is losing strength. The appearance of the last candlestick shows that bulls have the power to push through prior bearish price gains. Hence, the traders hope that the bulls will maintain their power in the next trading session and the trend will eventually change from bearish to bullish. However, traders should wait for confirmation provided by the candlestick appearing in the next trading session.

The bearish breakaway candlestick pattern 

The bearish breakaway candlestick pattern appears during an uptrend that predicts the upcoming reversal of the trend in the market.

Bearish breakaway pattern

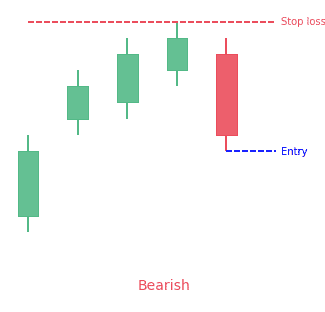
How to identify the bearish breakaway candlestick pattern? 

The bearish breakaway candlestick pattern has the following characteristics that can help to identify it.

  • The first candle must be a long white candle.
  • The next three candles are small spinning tops with short real bodies. The second candle opens higher creating a gap. The third candle maybe a black or white. 
  • The fifth candle must be a long black candle. 

What does the bearish pattern tell traders?

The appearance of the first white indicates the presence of the current bullish in the trend that is further confirmed by the upward gap between the first two candles. The next three candles are small bullish candles suggesting that the bulls are losing control of the market. The appearance of the fifth candle shows that the bears have taken control of the market. The fifth candle closes below the prior three candles, however, the gap between the first and second candles is not filled by the fifth candle. At this stage, traders hope that the bears will continue to dominate the market in the next trading session and hence, the current uptrend in the market will reverse to a bearish downtrend. However, the bearish breakaway pattern requires a confirmation provided by the candles appearing in the next few days. 

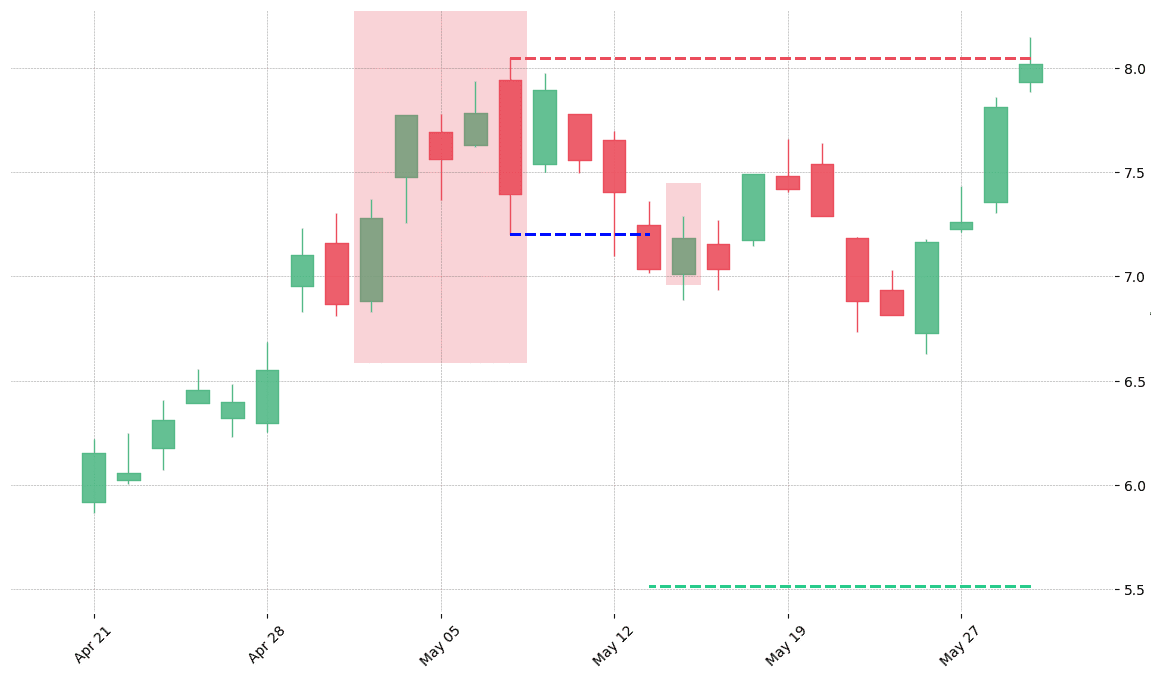
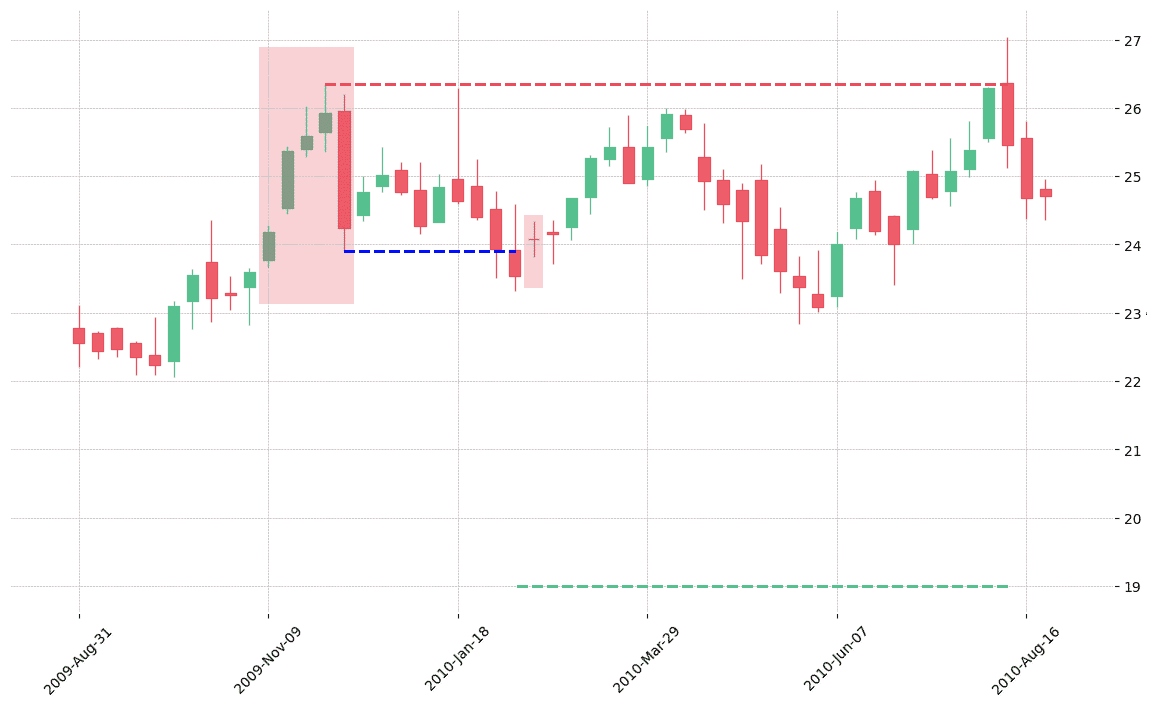
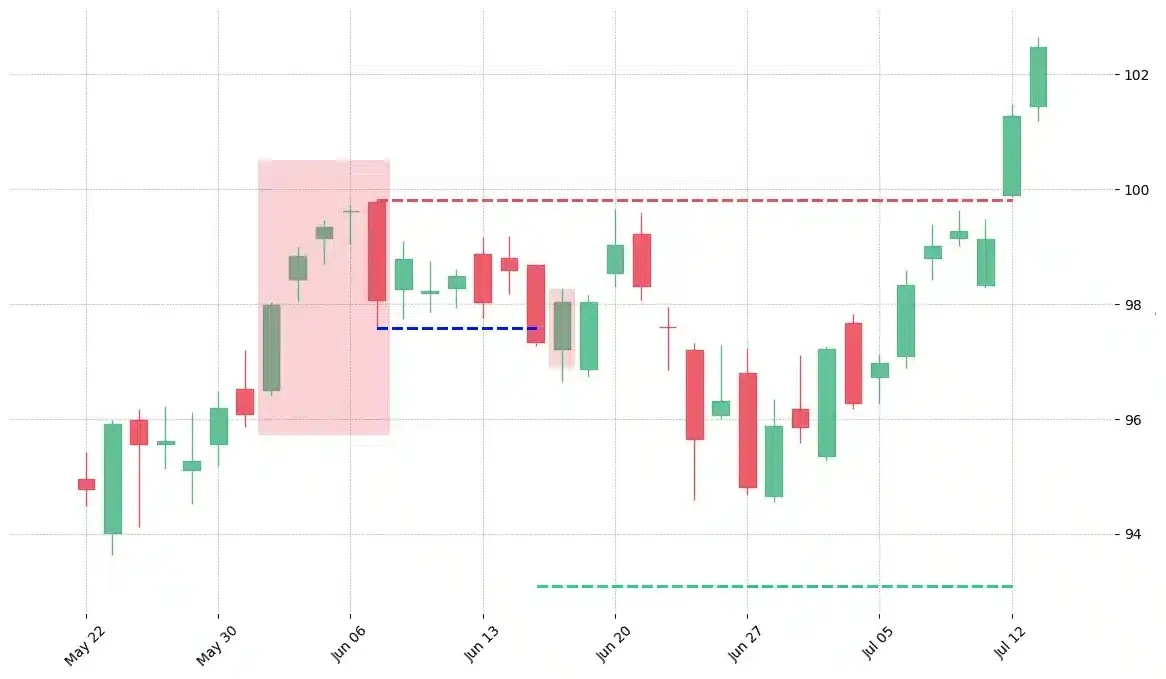
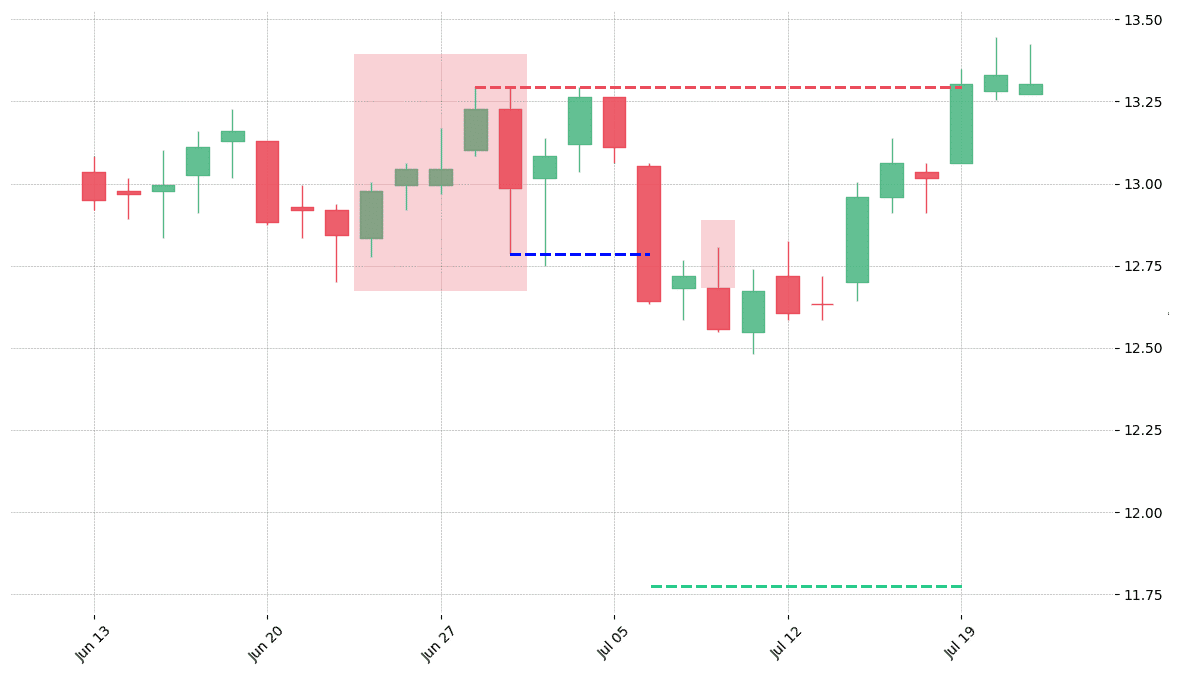
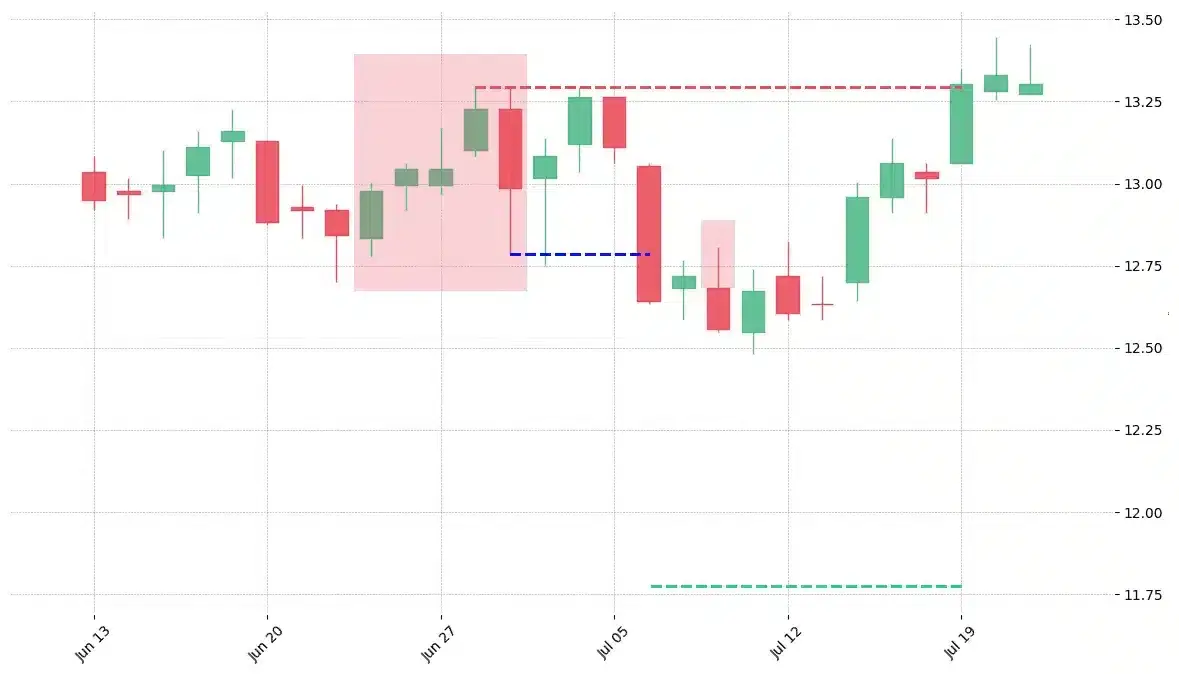
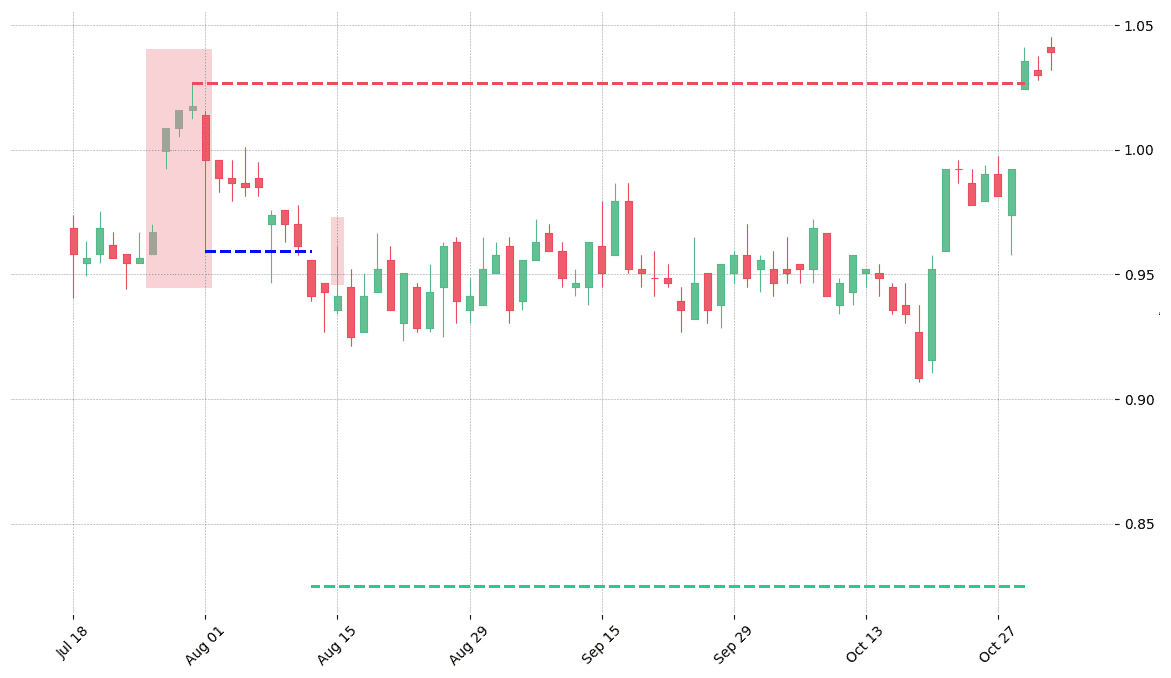
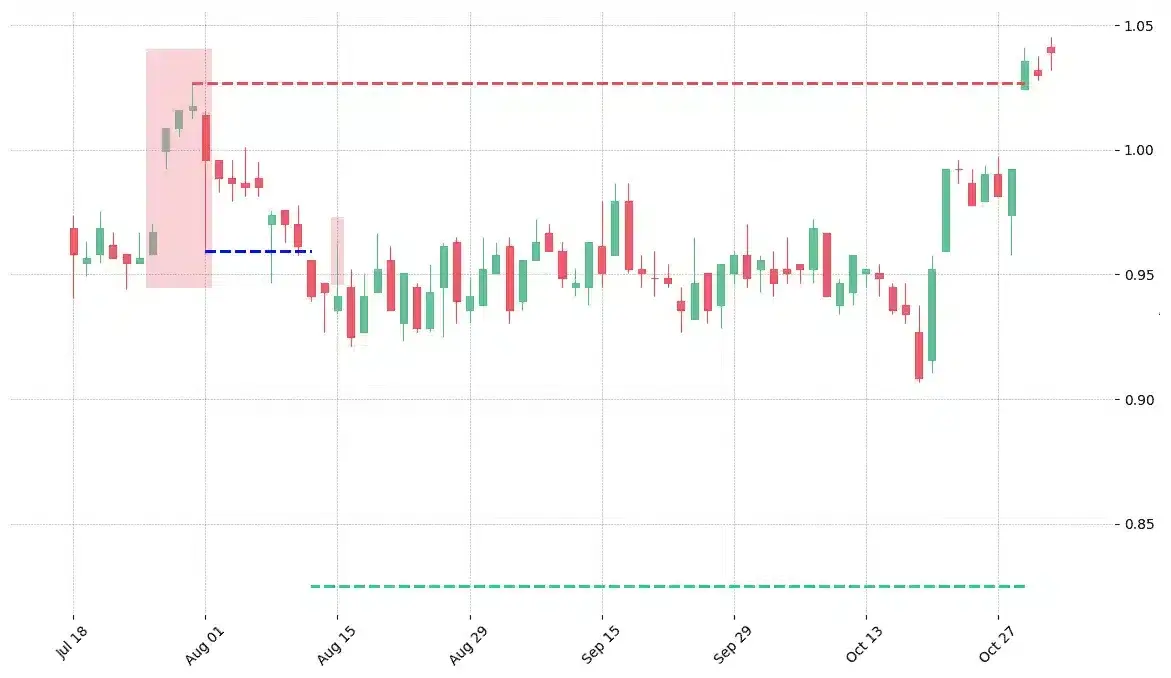
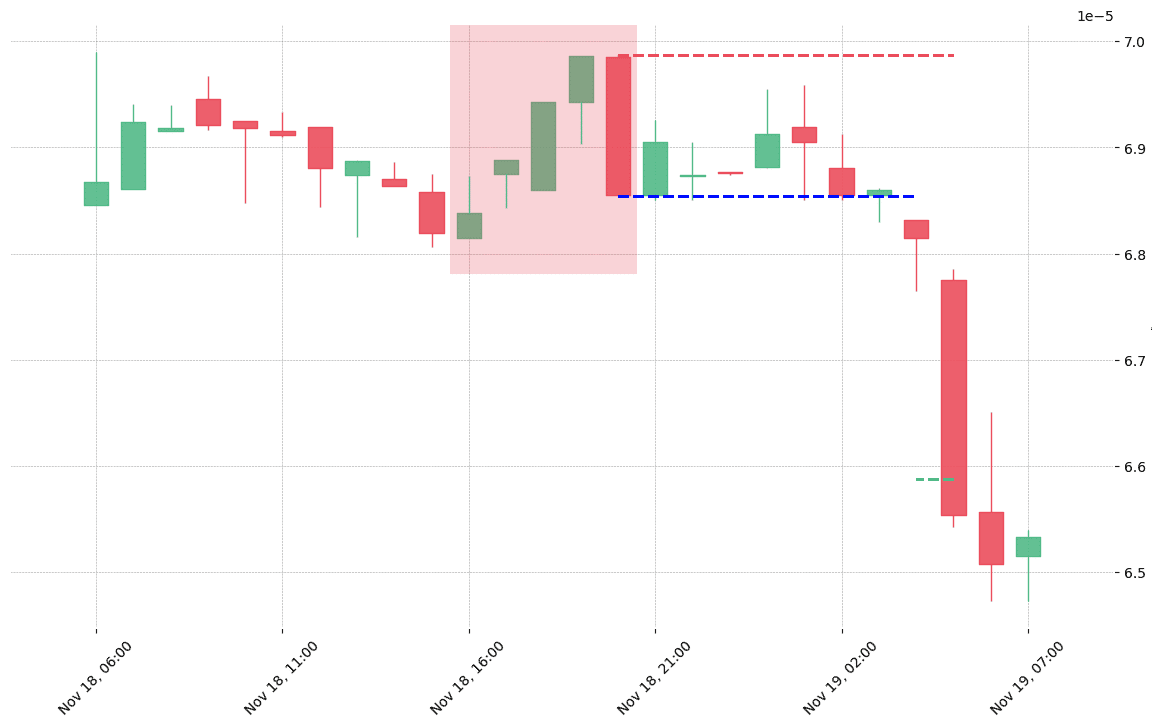
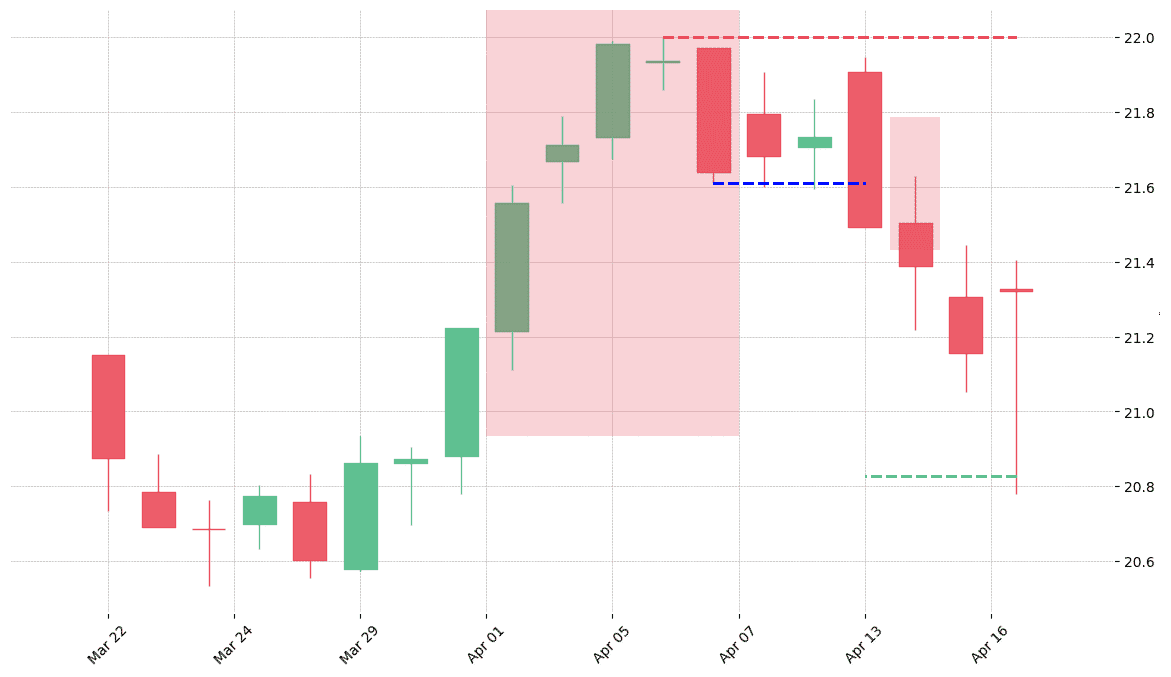
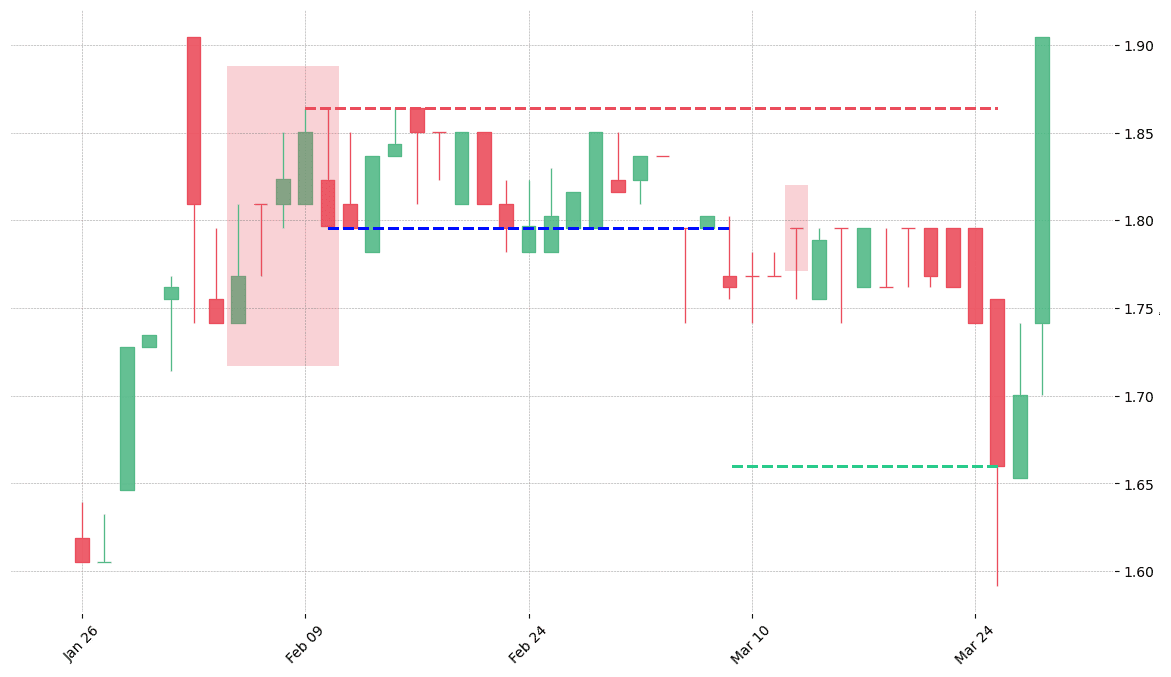
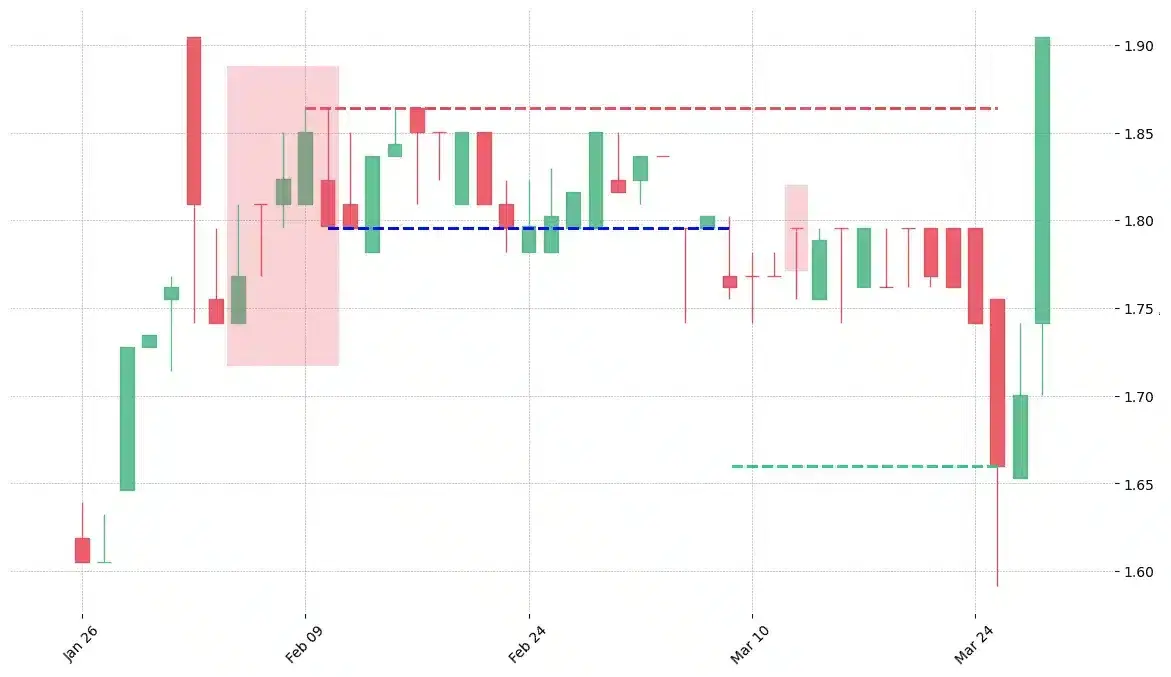
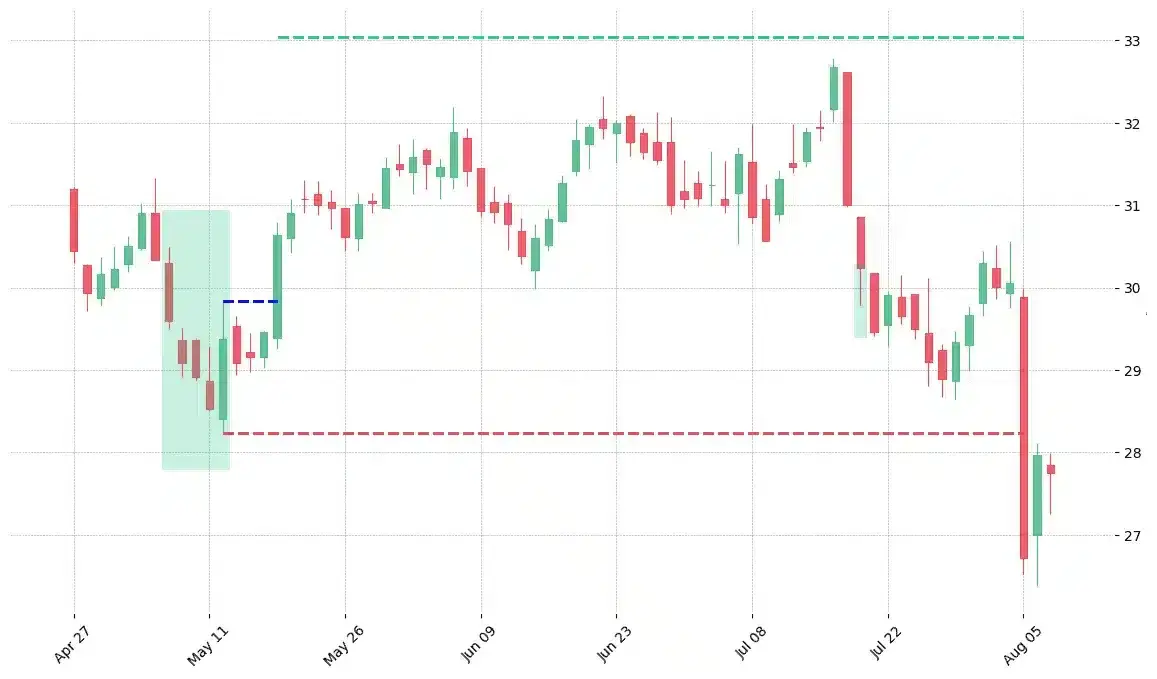
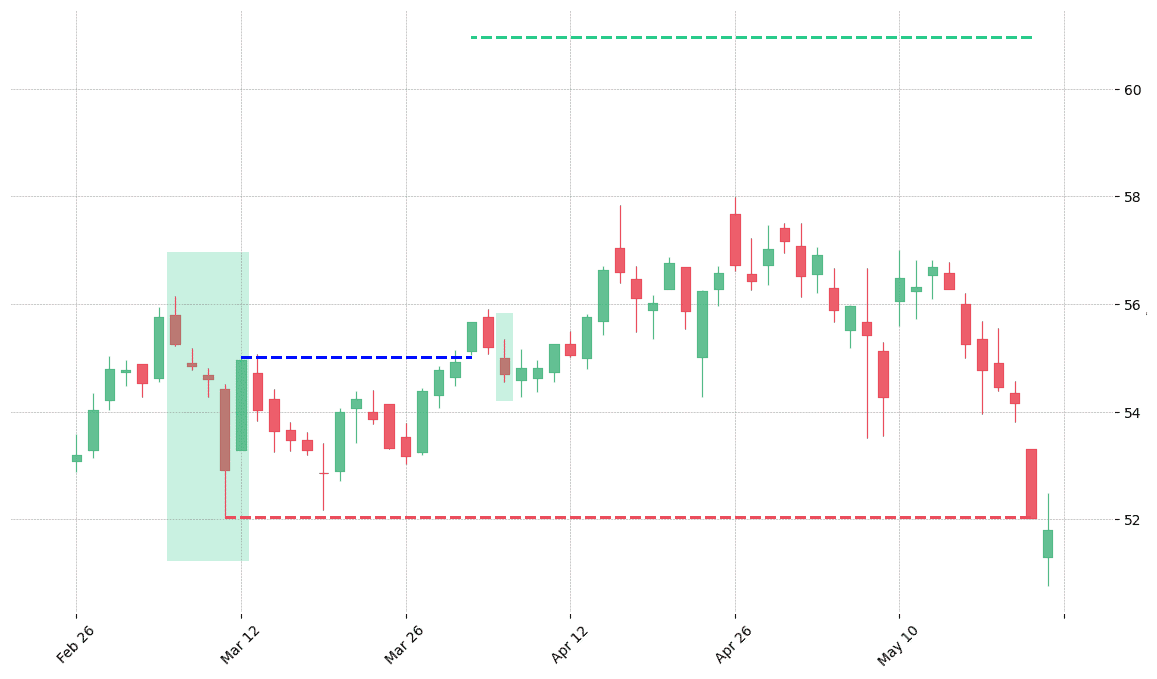
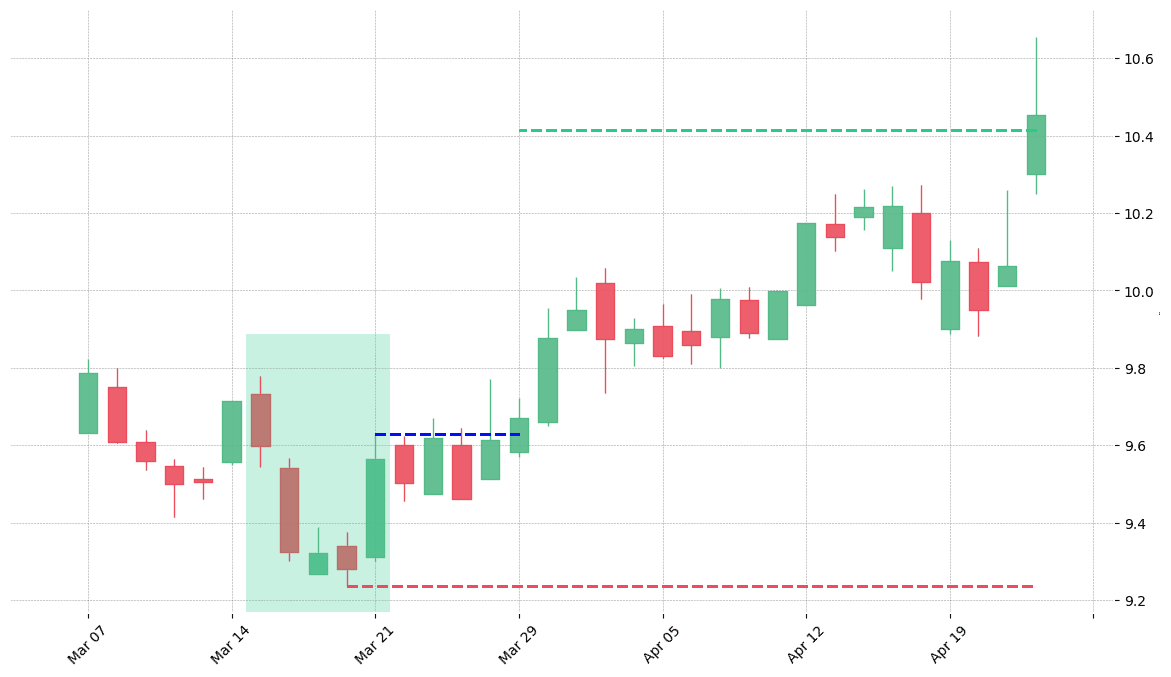
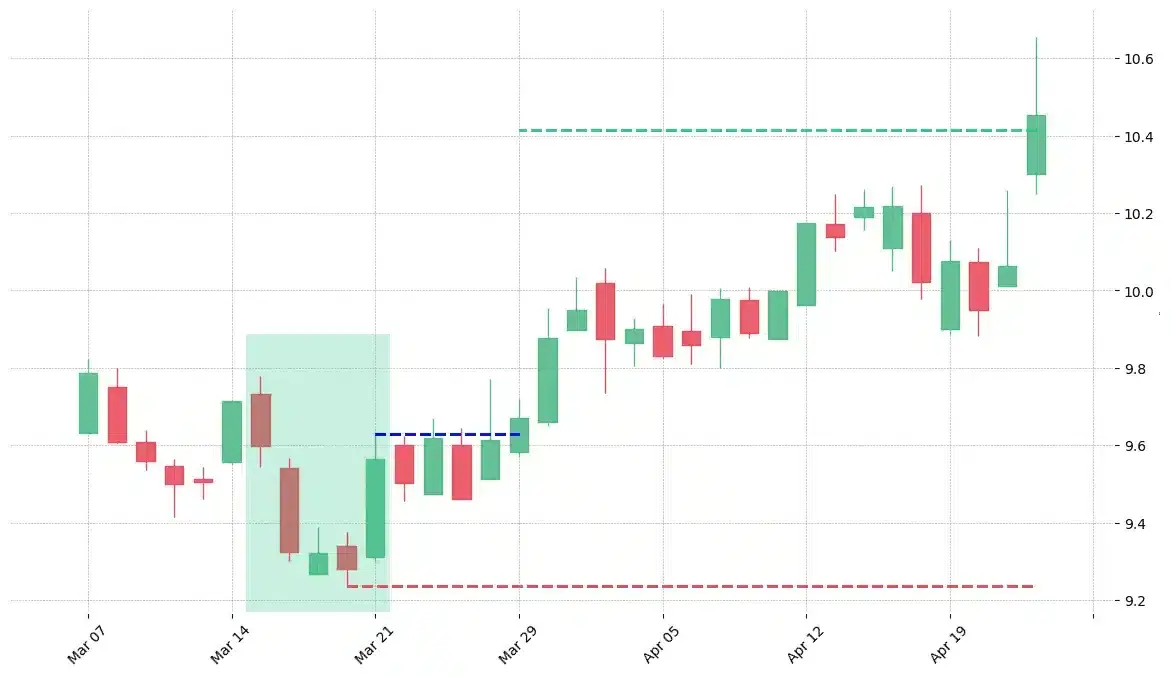
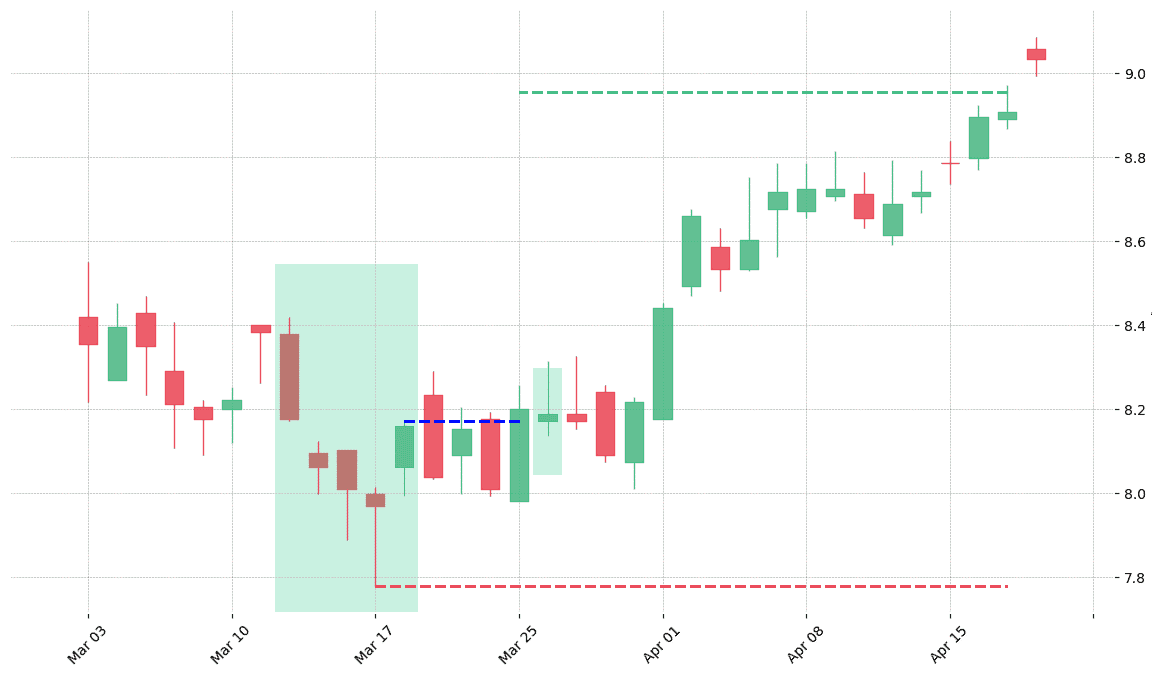
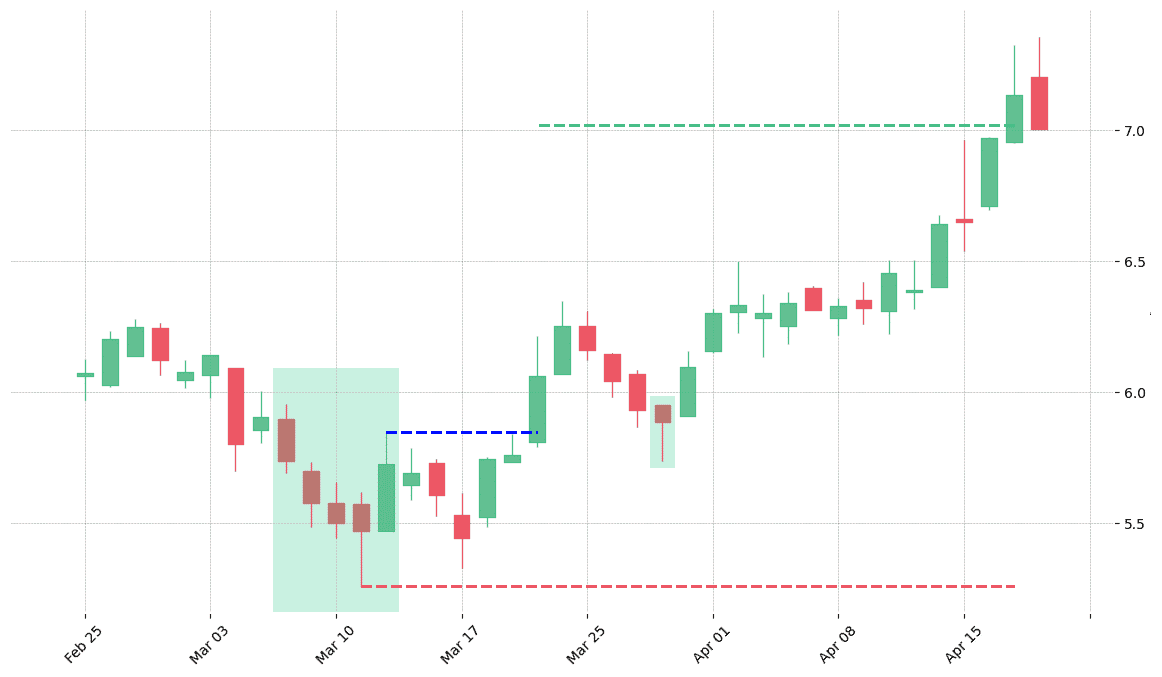
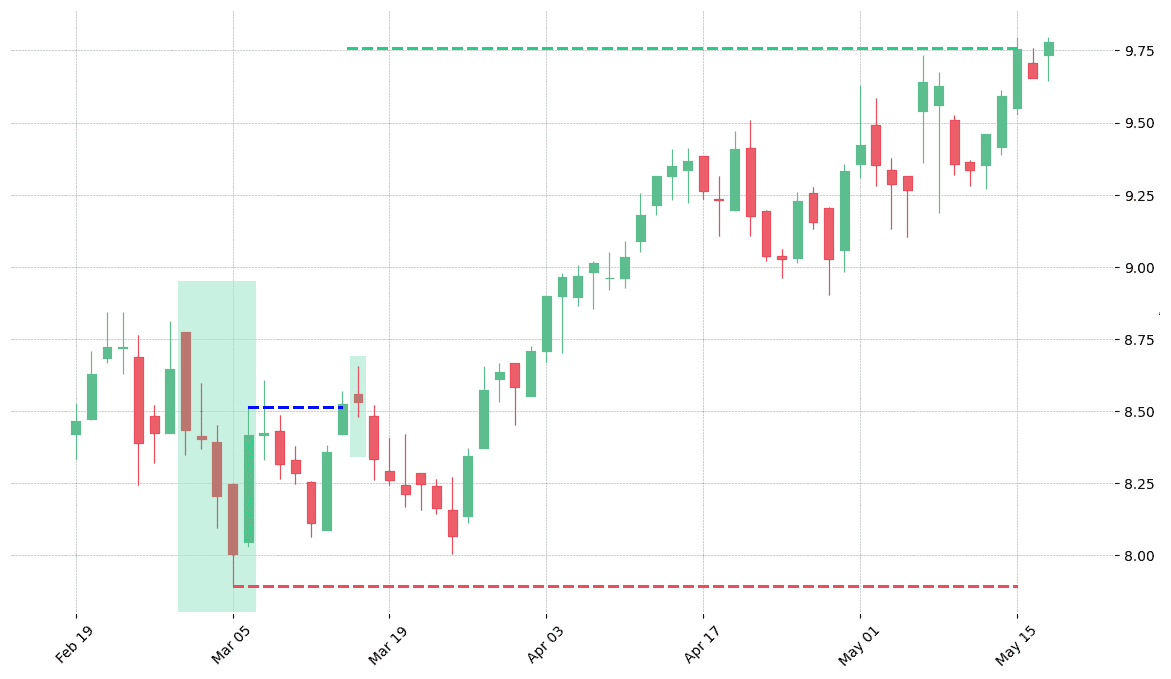
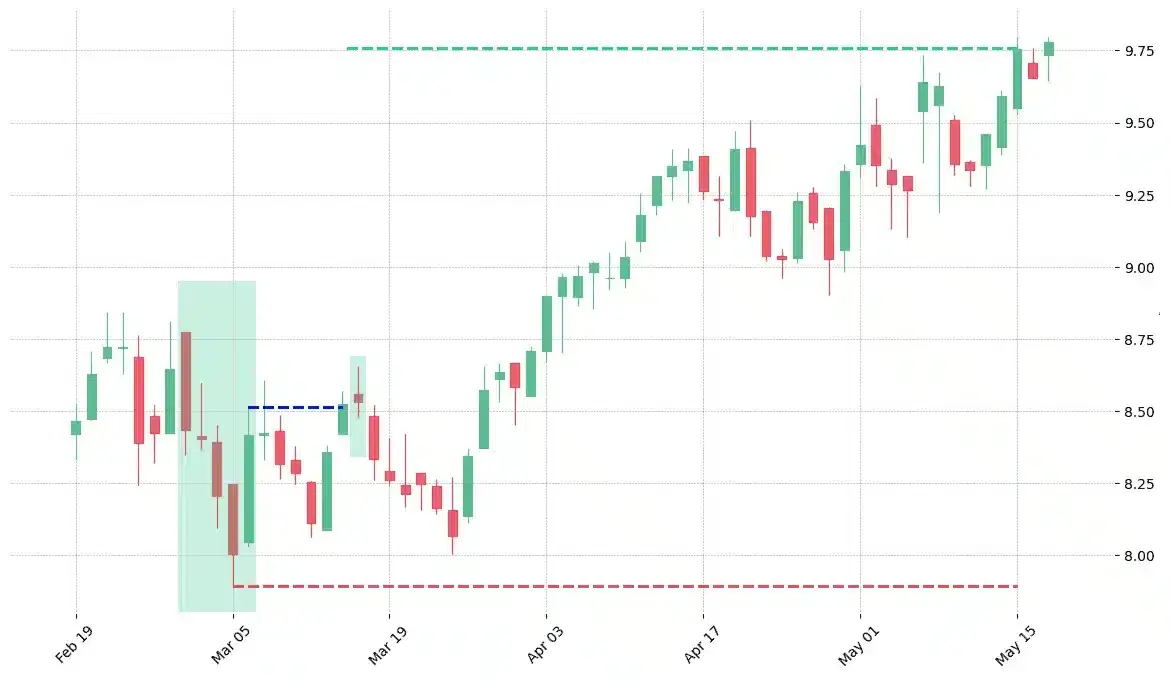
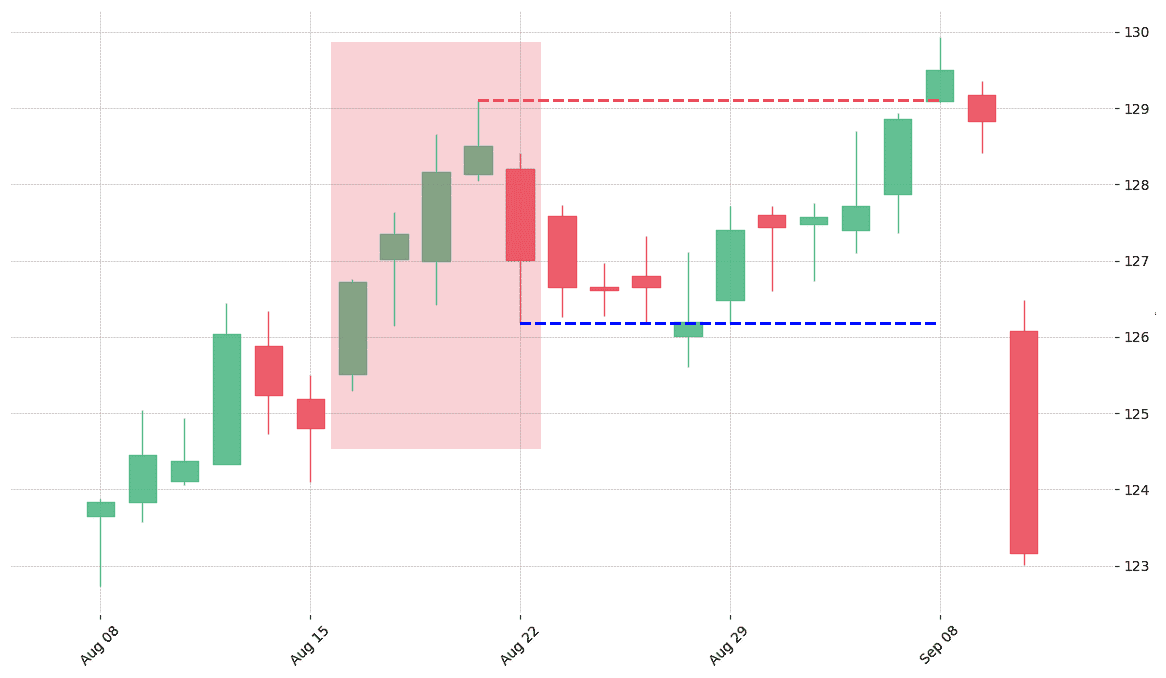
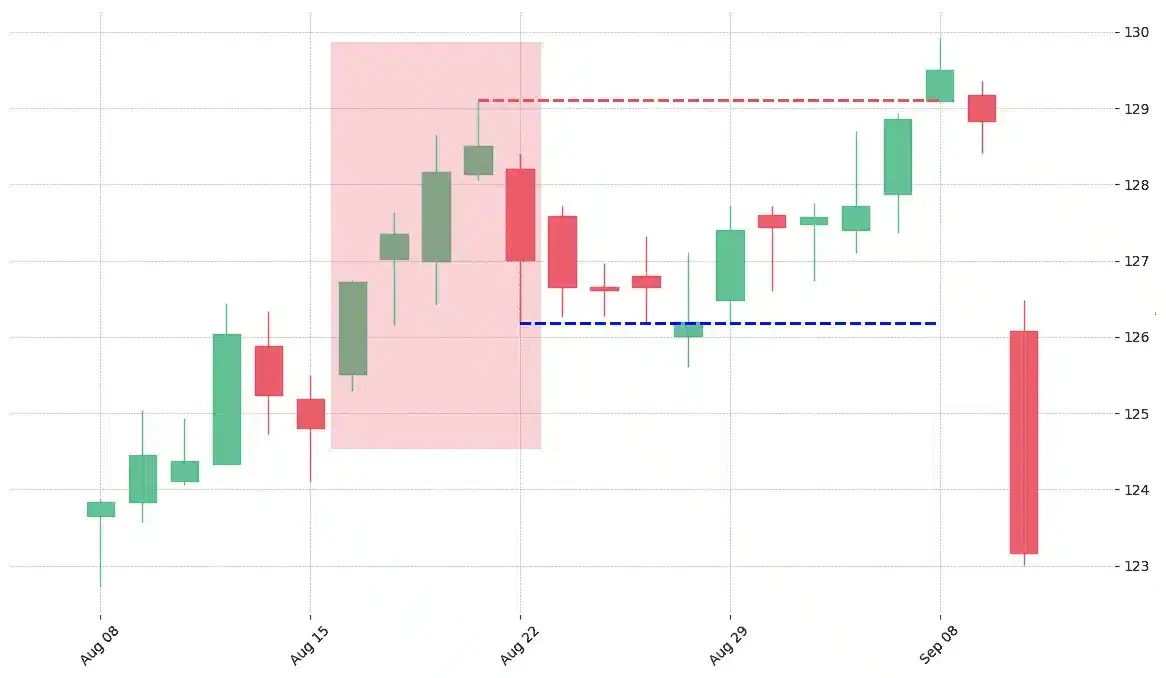
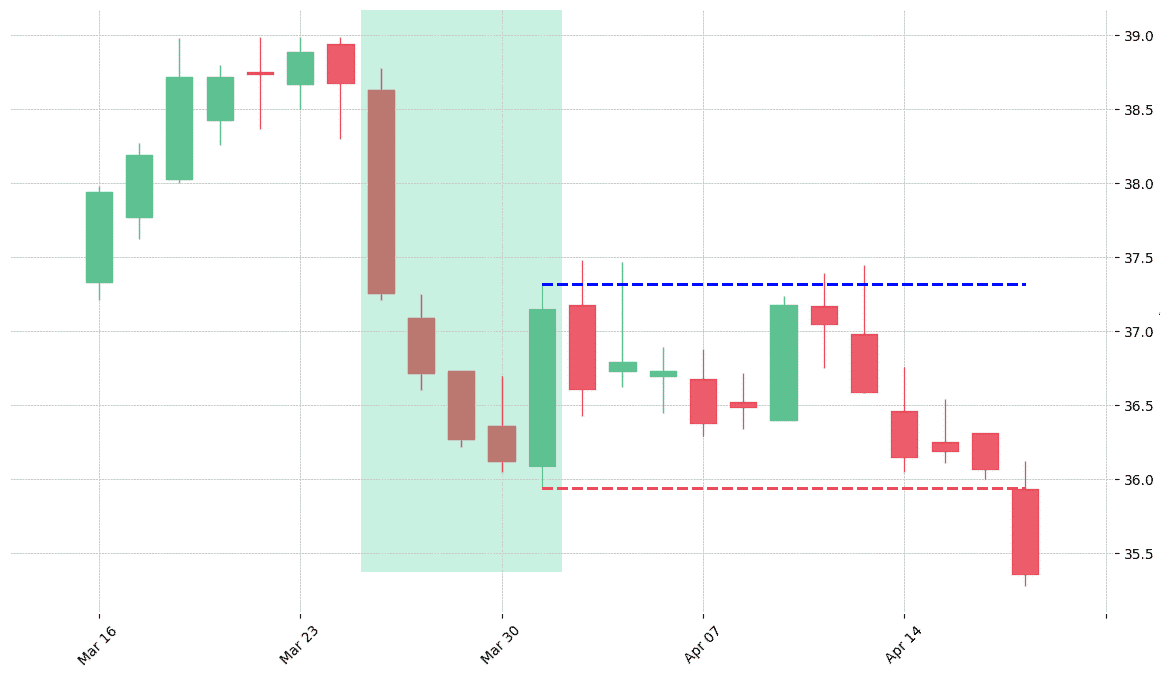
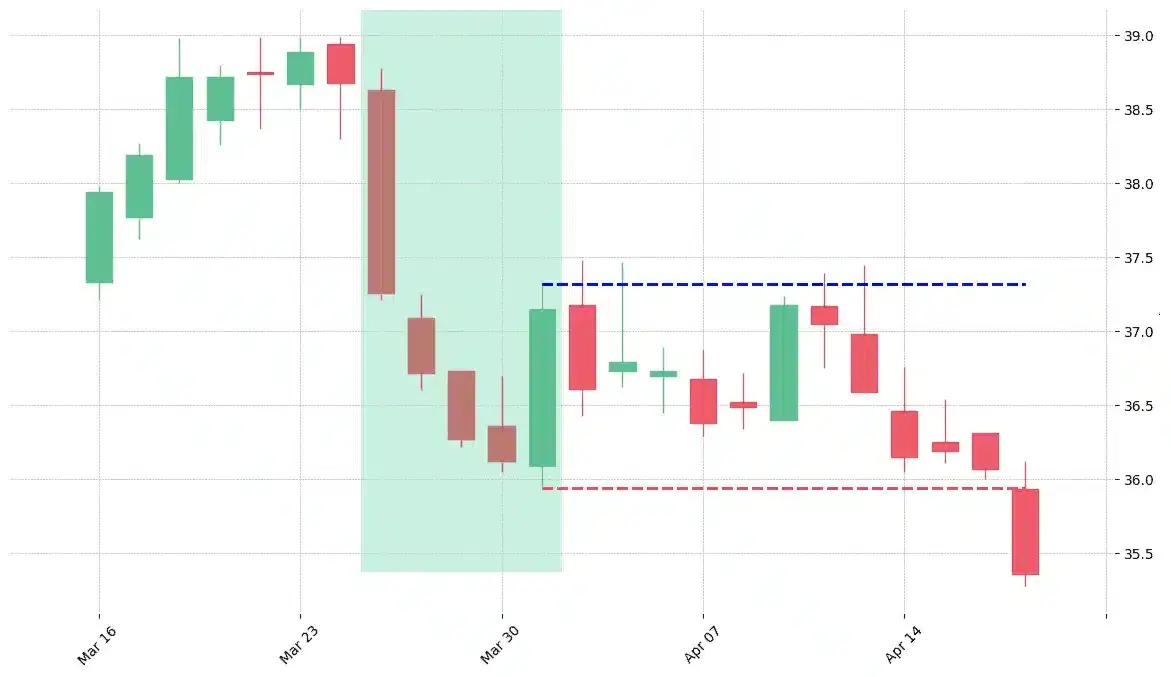
How does the Breakaway pattern look in real life?

The stock COG printed a bearish Break Away on 2009-05-01. It confirmed on 2009-05-13 (meaning price closed below entry level). It retested the trade entry level on 2009-05-14. Then it failed to reach the 2:1 R/R target and got stopped on 2009-05-29.
The stock LLY printed a bearish Break Away on 2009-11-09. It confirmed on 2010-02-08 (meaning price closed below entry level). It retested the trade entry level on 2010-02-15. Then it failed to reach the 2:1 R/R target and got stopped on 2010-08-09.
The stock MSFT printed a bearish Break Away on 2018-06-01. It confirmed on 2018-06-15 (meaning price closed below entry level). It retested the trade entry level on 2018-06-18. Then it failed to reach the 2:1 R/R target and got stopped on 2018-07-12.
The stock NWSA printed a bearish Break Away on 2017-06-23. It confirmed on 2017-07-06 (meaning price closed below entry level). It retested the trade entry level on 2017-07-10. Then it failed to reach the 2:1 R/R target and got stopped on 2017-07-19.
The stock OKE printed a bearish Break Away on 1997-07-28. It confirmed on 1997-08-13 (meaning price closed below entry level). It retested the trade entry level on 1997-08-15. Then it failed to reach the 2:1 R/R target and got stopped on 1997-10-29.
The cryptocurrency pair RDN/BTC printed a bearish Break Away on 2018-11-18 16:00:00. It confirmed on 2018-11-19 04:00:00 (meaning price closed below entry level). It retested the trade entry level on 2018-11-20 21:00:00. Then it successfully reached the 2:1 R/R target.
The stock CINF printed a bearish Break Away on 2004-04-01. It confirmed on 2004-04-13 (meaning price closed below entry level). It retested the trade entry level on 2004-04-14. Then it successfully reached the 2:1 R/R target.
The stock RMD printed a bearish Break Away on 1998-02-04. It confirmed on 1998-03-09 (meaning price closed below entry level). It retested the trade entry level on 1998-03-12. Then it successfully reached the 2:1 R/R target.
The stock DISCK printed a bullish Break Away on 2015-05-06. It confirmed on 2015-05-18 (meaning price closed above entry level). It retested the trade entry level on 2015-07-20. Then it failed to reach the 2:1 R/R target and got stopped on 2015-08-05.
The stock ZBH printed a bullish Break Away on 2010-03-08. It confirmed on 2010-04-01 (meaning price closed above entry level). It retested the trade entry level on 2010-04-06. Then it failed to reach the 2:1 R/R target and got stopped on 2010-05-20.
The stock FISV printed a bullish Break Away on 2005-03-15. It confirmed on 2005-03-29 (meaning price closed above entry level). It retested the trade entry level on 2008-10-08. Then it successfully reached the 2:1 R/R target.
The stock CNP printed a bullish Break Away on 2008-03-12. It confirmed on 2008-03-25 (meaning price closed above entry level). It retested the trade entry level on 2008-03-26. Then it successfully reached the 2:1 R/R target.
The stock HBI printed a bullish Break Away on 2008-03-06. It confirmed on 2008-03-20 (meaning price closed above entry level). It retested the trade entry level on 2008-03-28. Then it successfully reached the 2:1 R/R target.
The stock HSIC printed a bullish Break Away on 2002-02-28. It confirmed on 2002-03-14 (meaning price closed above entry level). It retested the trade entry level on 2002-03-15. Then it successfully reached the 2:1 R/R target.
The stock AVB printed a bearish Break Away on 2014-08-18. Unfortunately it invalidated on 2014-09-08 before the trade could trigger (it triggered the stop before entering).
The stock KEYS printed a bullish Break Away on 2015-03-25. Unfortunately it invalidated on 2015-04-17 before the trade could trigger (it triggered the stop before entering).

Looking to learn more about this pattern?
You should take a look at Joe Marwood's online course. In his course, he backtested the 26 main candlestick patterns before to summarize which one is THE best pattern. I really liked his course and you shouldn't miss it!
Click here to signup to his "Candlestick Analysis For Professional Traders" course now!

Russell Crane

Russell Crane

Russell is an Algorithmic & Technical Analyst Trader @ PatternsWizard.
His passion is to share his knowledge about TA, patterns & more. Why hope for your trading to work when you can precisely know the performance stat of every pattern?

Are Candlestick Patterns Reliable

candlesticksWe loved Marwood Research’s course “Candlestick Analysis For Professional Traders“. Do you want to follow a great video course and deep dive into 26 candlestick patterns (and compare their success rates)? Then make sure to check this course!

Want to know which markets just printed a pattern?

Market Timeframe Printed on

Get “Every Candlestick Patterns Statistics”, The Last Trading Book You’ll Ever Need! 📖

PatternsWizard book - Every Candlestick Patterns Statistics

"Every Candlestick Patterns Statistics", the last trading book you'll ever need!

Pre-register now and receive the candlestick patterns statistics ultimate ebook for free before anyone else!

"All you need is one pattern to make a living."
- Linda Raschke

Awesome move! We are giving the last touch to the "Every Candlestick Patterns Statistics" book. We are very excited to send it to you right when it's ready. In the meantime, we'd like to gift you our trading roadmap and its best 55 resources. You'll shortly receive an email with the link. Don't miss it ;) Stay tuned 📈