 Good Trading requires the Best Charting Tool!
Key takeaways
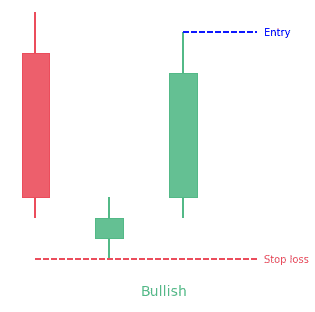
- A morning star pattern is a bullish 3-bar reversal candlestick pattern
- It starts with a tall red candle, then a small candle and finishes with a tall green candle
- The middle candle reports indecision in the market
- The opposite pattern is the evening star pattern
Statistics to prove if the Morning Star pattern really works
Are the odds of the Morning Star pattern in your favor?
How does the Morning Star behave with a 2:1 target R/R ratio?
From our research the Morning Star pattern confirms 74.2% of the time on average overall all the 4120 markets we analysed. Historically, this patterns confirmed within 3.4 candles or got invalidated within 8.4 candles. If confirmed, it reached the 2:1 R/R target 38.4% of the time and it retested it's entry price level 97% of the time.
Not accounting for fees, it has an expected outcome of 0.152 $/$.
It means for every $100 you risk on a trade with the Morning Star pattern you make $15.2 on average.
Want to account for your trading fees? Have the detailled stats for your favorite markets / timeframes? Or get the stats for another R/R than 2:1?
🚀 Join us now and get fine-tuned stats you care about!
How to handle risk with the Morning Star pattern?
We analysed 4120 markets for the last 59 years and we found 22 863 occurrences of the Morning Star pattern.
On average markets printed 1 Morning Star pattern every 682 candles.
For 2:1 R/R trades, the longest winning streak observed was 10 and the longest losing streak was 19. A trading strategy relying solely on this pattern is not advised. Anyway, make sure to use proper risk management.
Keep in mind all these informations are for educational purposes only and are NOT financial advice.
If you want to learn more and deep dive into candlestick patterns performance statistics, I strongly recommend you follow the best available course about it. Joe Marwood (who's a famous trader with more than 45 000 Twitter followers) created an online course called "Candlestick Analysis For Professional Traders" in his Marwood Research University. There he will take you through the extensive backtesting of the 26 main candlestick patterns. He then summarizes which one is THE best pattern. Do you know which one it is?
Remember, don't trade if you don't know your stats. Click here to signup to the course now!
What is the Morning Star pattern?
Overview
A morning star is a visual three candlesticks pattern. Technical analysts usually interpret it as a bullish sign. It forms following a downward trend and it shows the start of an upward climb. It is a sign of a reversal in the previous price trend. Traders hunt for the formation of a morning star candlestick pattern. They then get confirmation that a reversal is surely occurring using additional indicators.
The morning star candlestick is a three-candle pattern that shows a reversal in the market. It can be used when trading markets of any type. It is crucial to correctly spot reversals when trading financial markets because it makes it possible for traders to enter at good levels at the beginning of a possible trend reversal.
The pattern is made up of three candlesticks:
- large bearish candle (day 1)
- small bearish or bullish candle (day 2)
- and large bullish candle (day 3)
Some details about each of the 3 candles
The first part of the morning star reversal pattern is a big bearish red candle that appears on the first day; they are definitely in charge and make new lows. The second day starts with a bearish gap down. It is clear from the start of day 2 that bears are in control. This time, bears do not push the prices to a much lower position. The candlestick of the second day is small and can be bearish, bullish, or neutral (or Doji).
Generally, a bullish candle on day 2 is seen as a stronger indicator that there’s and impending reversal. But the most significance is seen in day 3. It starts with a bullish gap up, making it possible for bulls to push the price even further upward. It mostly gets rid of the losses of day 1. Traders observe the formation of a morning star pattern on the price chart. They then can confirm it with their other favorite technical tools (as defined in their trading plan).
A special case: the Morning Star Doji
Traders often look for signs of indecision in the market where selling pressure goes down and leaves the market flat. This is where Doji candles can be seen as the market opens and closes at the same level or very close to the same level. The indecision makes way for a bullish move because the bulls see value at this level and prevent any more selling. When the bullish candle appears after the Doji, then there will be a bullish confirmation.
How to identify the Morning Star candlestick pattern?
A morning star pattern is a variation of the bullish engulfing pattern. But the second candlestick in this three-candle formation must be a low range candle, such as a spinning top or Doji. The pattern starts with a relatively big bearish candle. Then follows a small real-bodied second candle that is either a Doji or slightly bearish, and then a third candle that has a real body and pulls close to the past.
Identifying the morning star candlestick pattern on forex charts involves more than just identifying the three main candles. What is needed is a knowledge of previous price action and where the pattern appears within the existing trend.
- Establish an existing downtrend: The market has to be showing lower highs and lower lows.
- Large bearish candle: The big bearish candle appears because of a large selling pressure and a continuation of the existing downtrend. When this happens, traders should only be looking for short trades because there is no real evidence of a reversal yet.
- Small bullish/bearish candle: Usually, the second candle is small and it presents the first sign of a tired downtrend. Often, this candle gaps lower as it makes a lower low. It doesn’t matter if the candle is bullish or bearish as the important thing is that the market is still undecided.
- Large bullish candle: This reveals the first true sign of a new buying pressure. In markets that are not forex based, the candle gaps up from the close of the previous candle and shows the start of a new uptrend.
- Subsequent price action: After a reversal has been successfully attained, traders will notice higher highs and higher lows, but should have well-placed stops to manage the risk of a failed move.
What does the Morning Star pattern tell traders?
A morning star candlestick is a visual pattern, so it doesn’t need any specific calculations. The pattern forms after three sessions or it does not. But other technical indicators can assist in predicting if an interesting morning star is forming. Some interesting signal confluence can be whether the price action is close to a support zone or if the relative strength indicator (RSI) is showing that the commodity or stock is oversold.
The crucial thing to note in a morning star candlestick pattern is the middle candle can be white or black (or green or red) as the buyers and sellers begin to balance out over the session.
How to trade when you see the Morning Star pattern?
It is well know that the morning star is a reversal pattern that mainly indicates that bulls are taking over the trend and bears are losing the grip. Most beginners usually trade the morning star pattern stand-alone. But that is not recommended as it is not reliable enough. It is advisable to pair the pattern with other reliable indicators, support resistance levels, or trend lines to have profitable trades.
- Confirm the downtrend on the trading timeframe: It is very important to confirm because if there is no downtrend, there will be no point in trading the morning star pattern. You can confirm it on a higher timeframe or on your trading timeframe.
- Find out the morning star pattern on your trading timeframe: If the first red candle is with low volume, and the second one is a small red candle, there will be no indication to go long yet. If the next is a long green candle with high volume, then this will be a strong indication of a trend reversal.
- Entry, take profit and stop loss: Enter the trade when the next green candle closes and close the position at any resistance area or supply-demand zone. Also, you can close your position when the price goes near the significant resistance level of the higher timeframe.
Summary
The morning star pattern is very simple to identify on the price chart if you are an intermediate trader. Even beginners can spot it easily on the chart with little practice. The pattern gives us well-defined entries and good risk-reward ratios. Despite this, it is advisable to combine this pattern with some other trading tools to increase reliability.
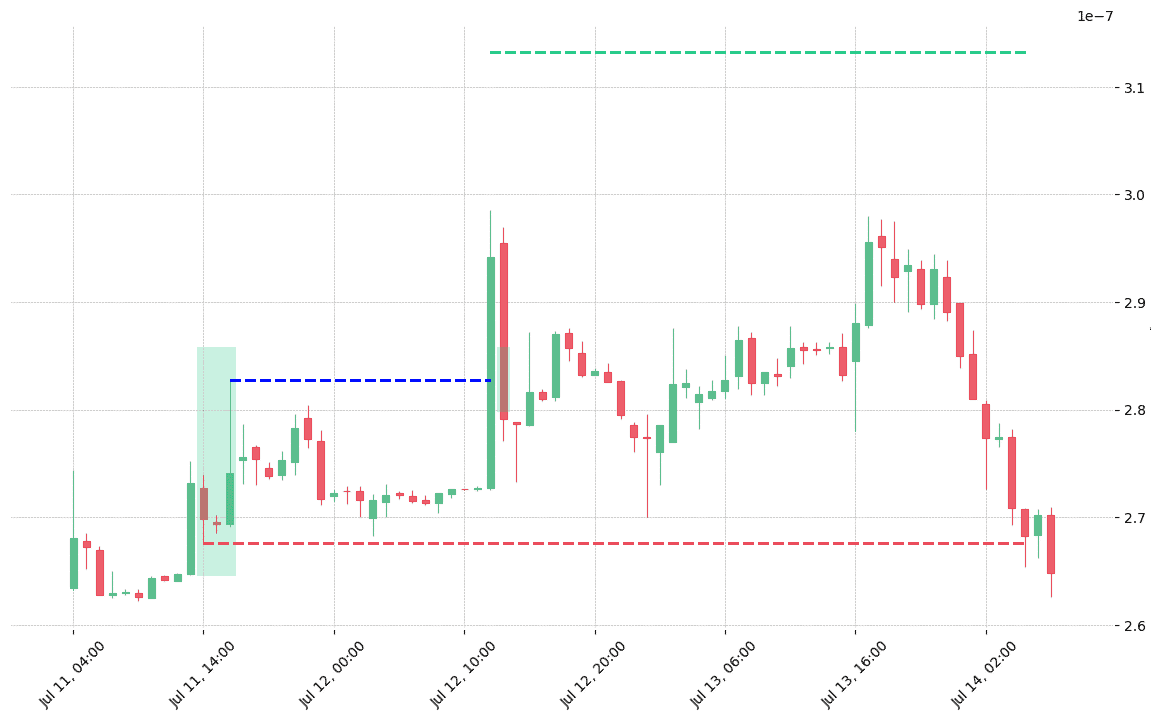
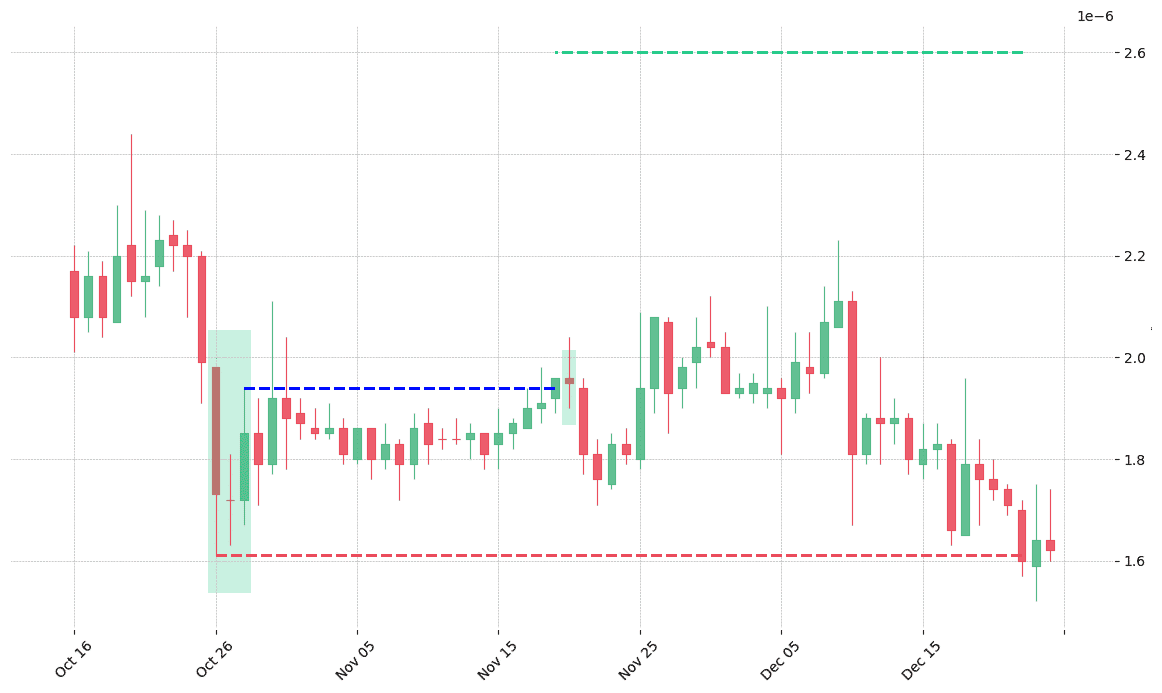
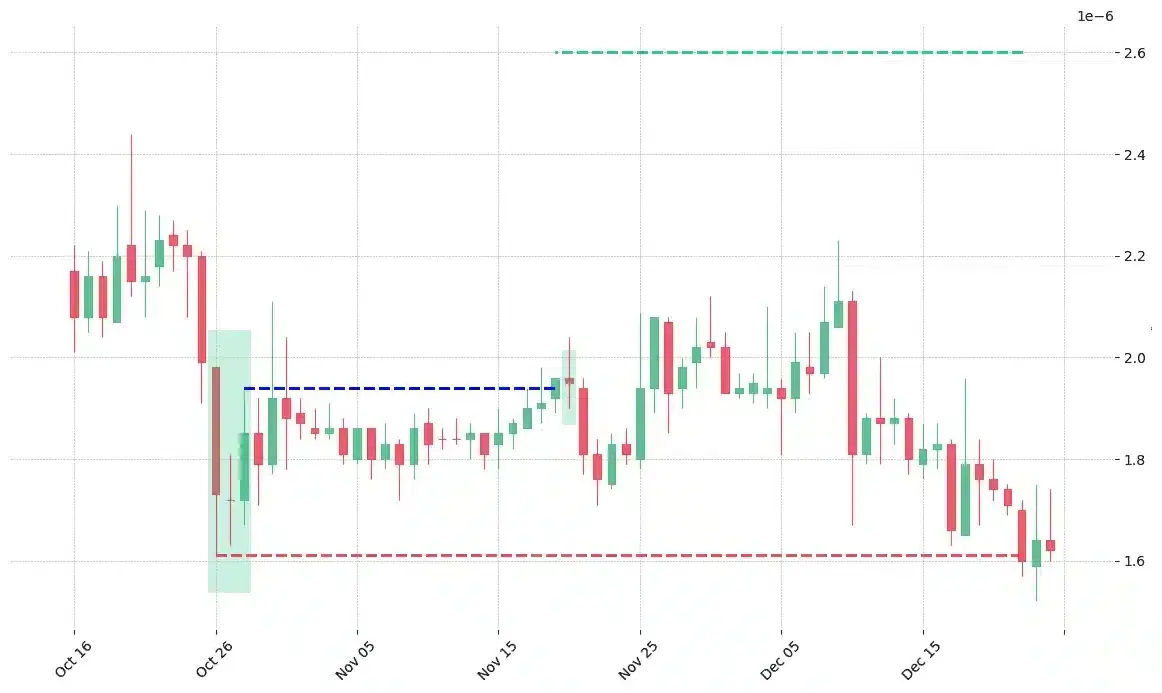
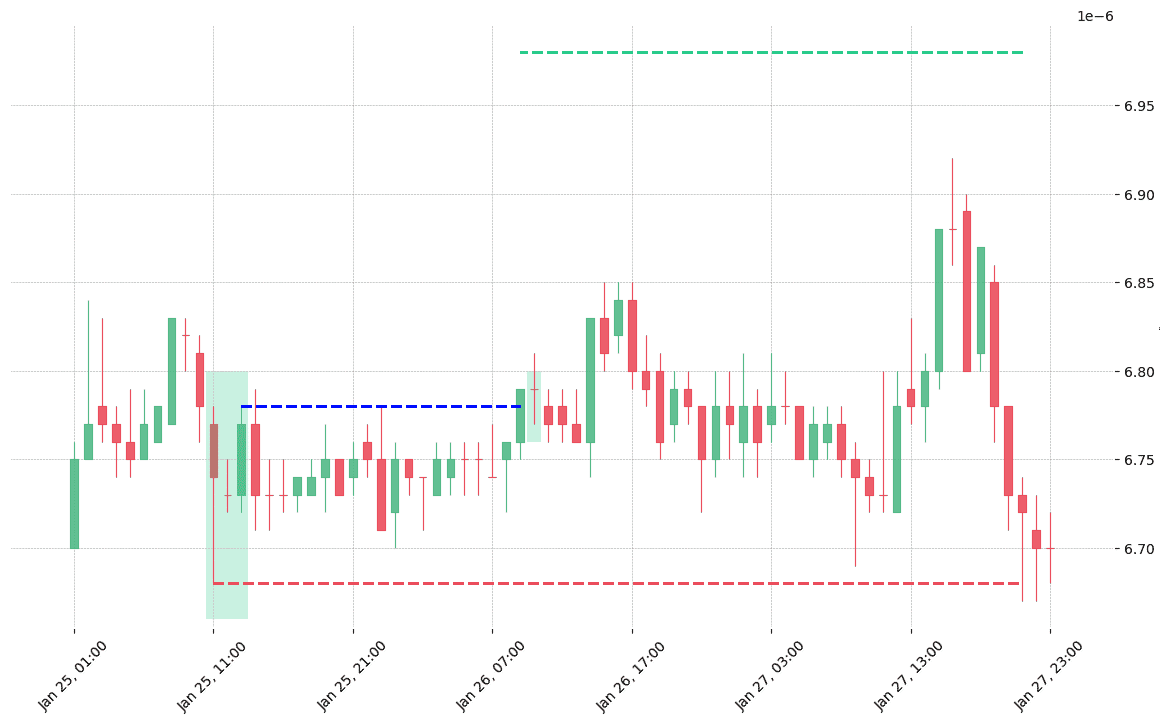
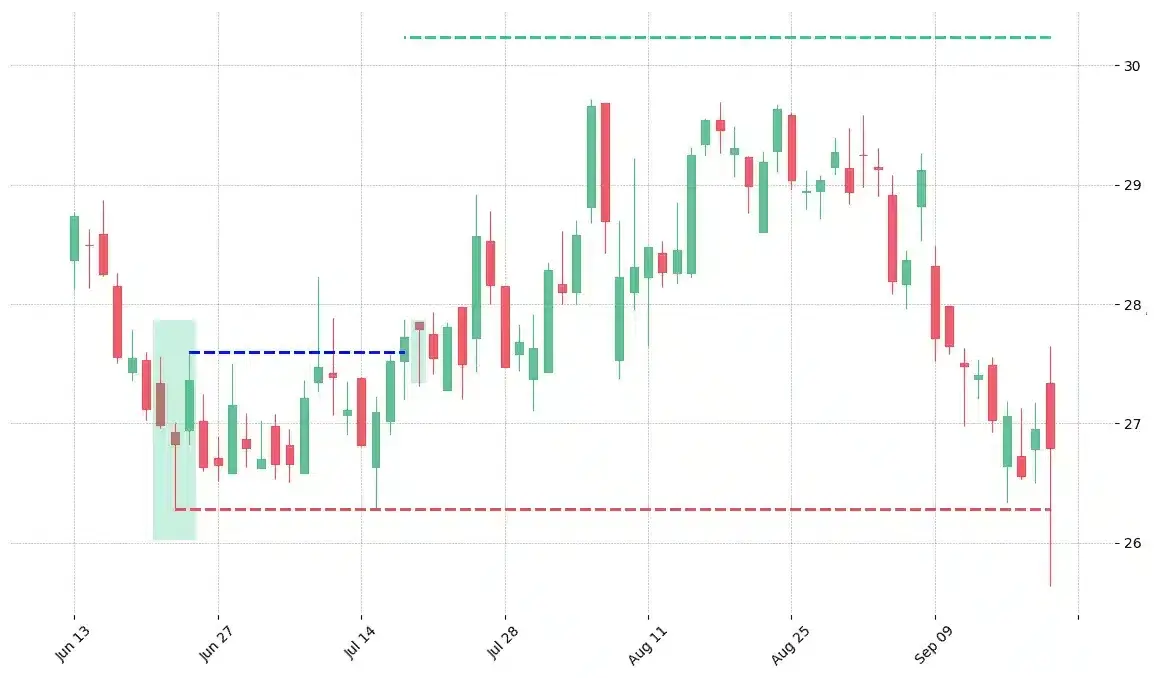
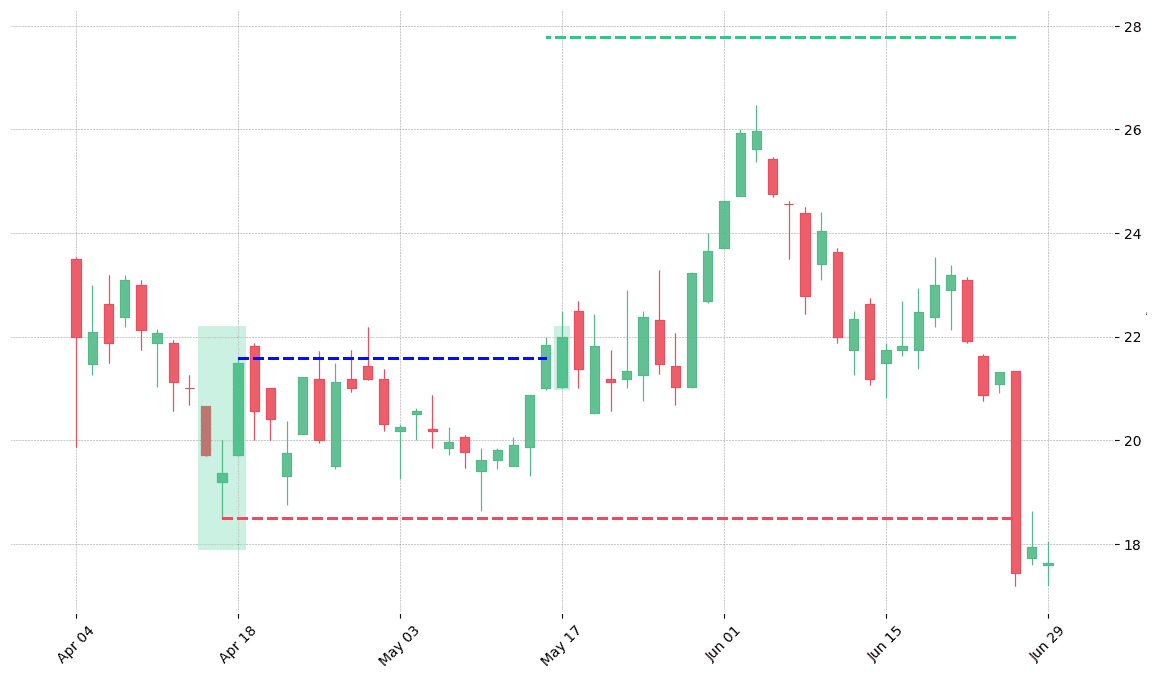
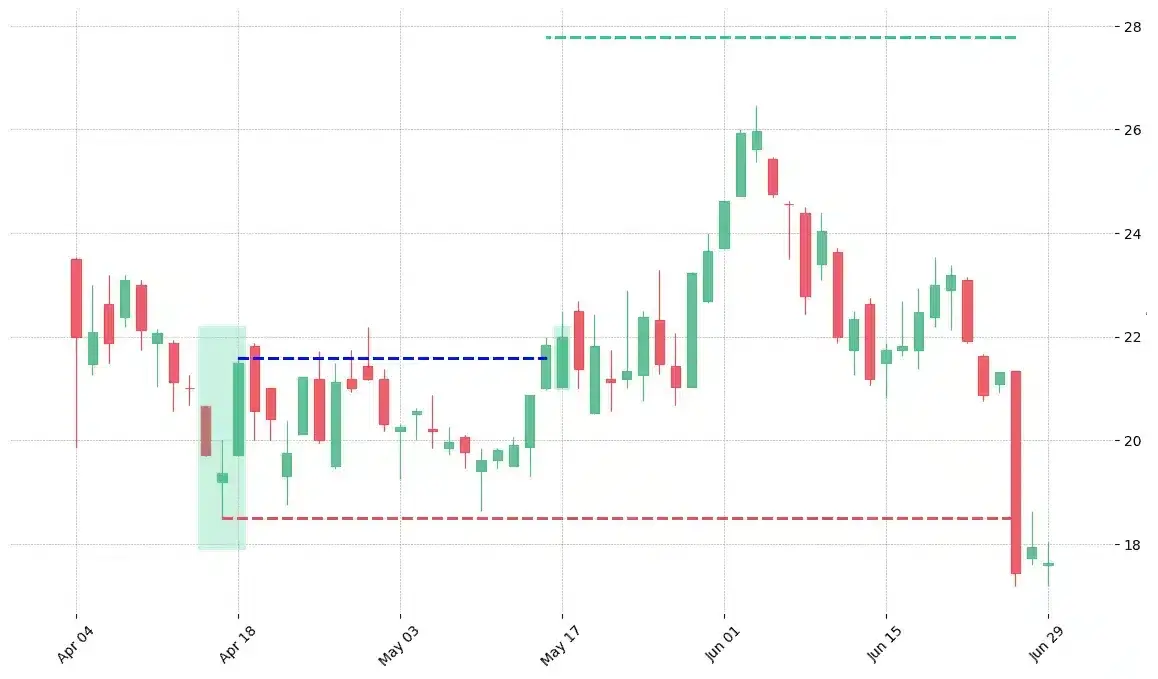
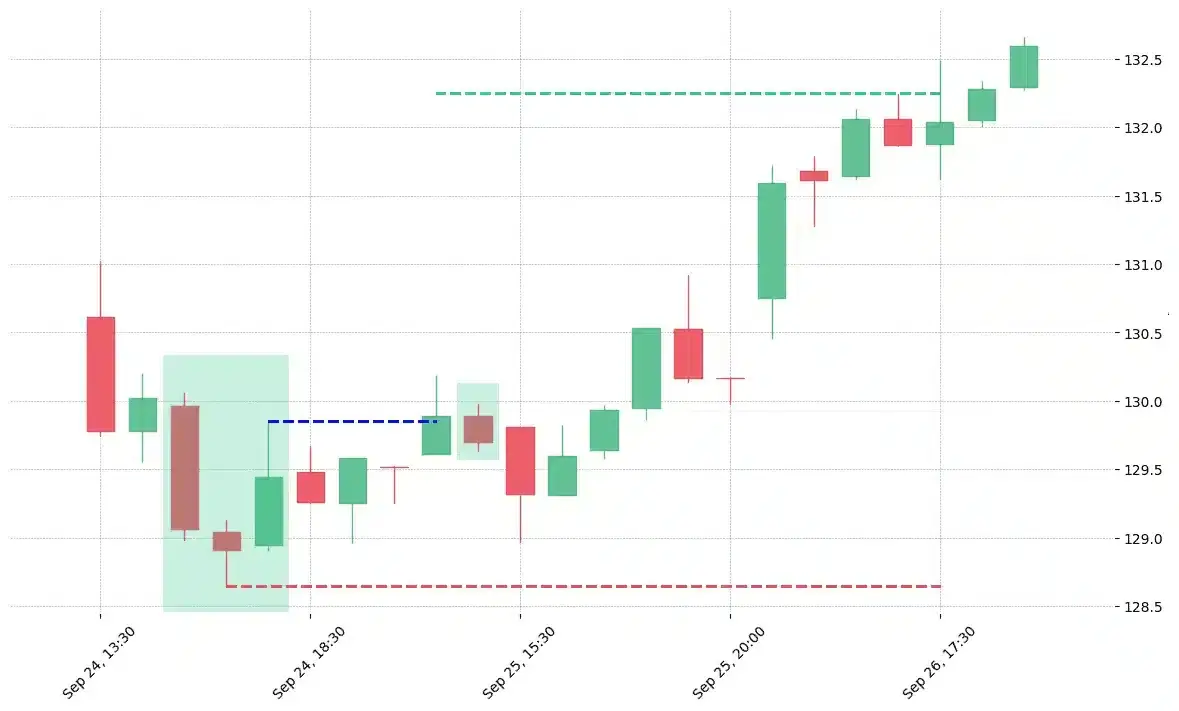
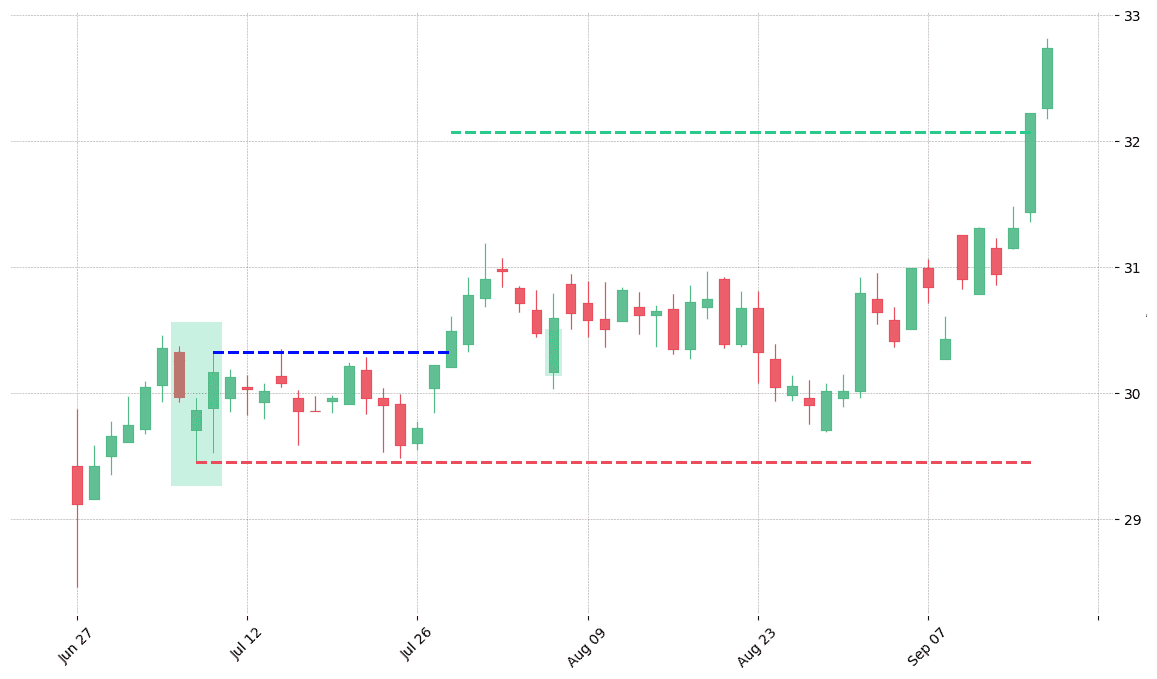
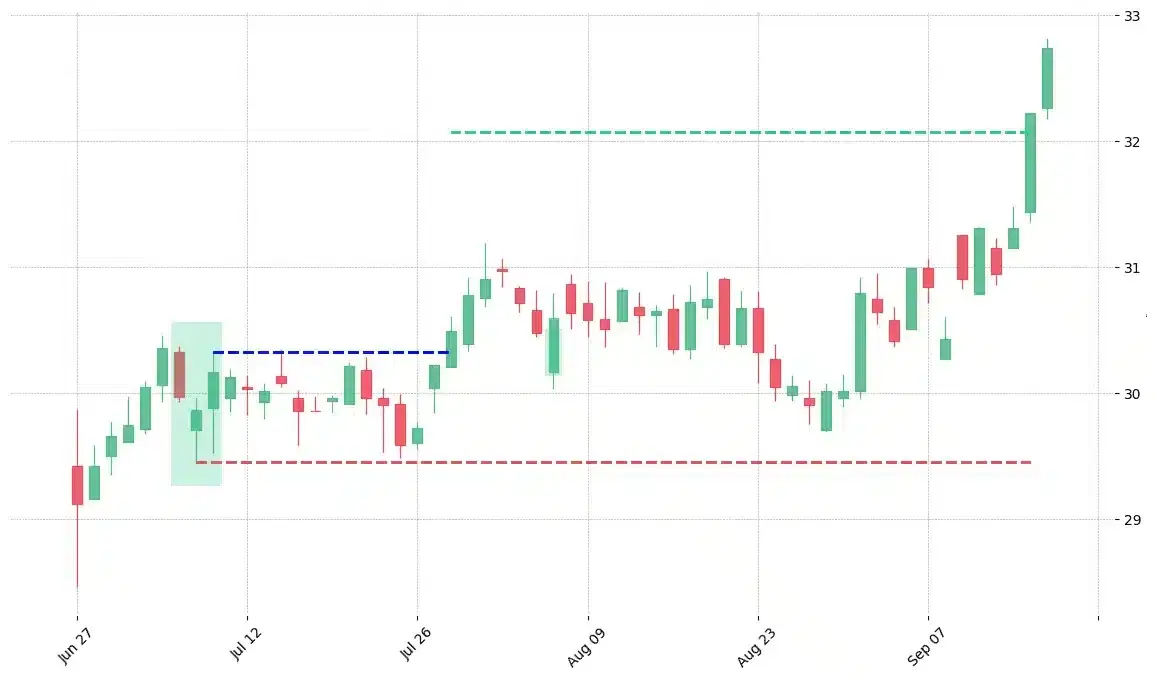
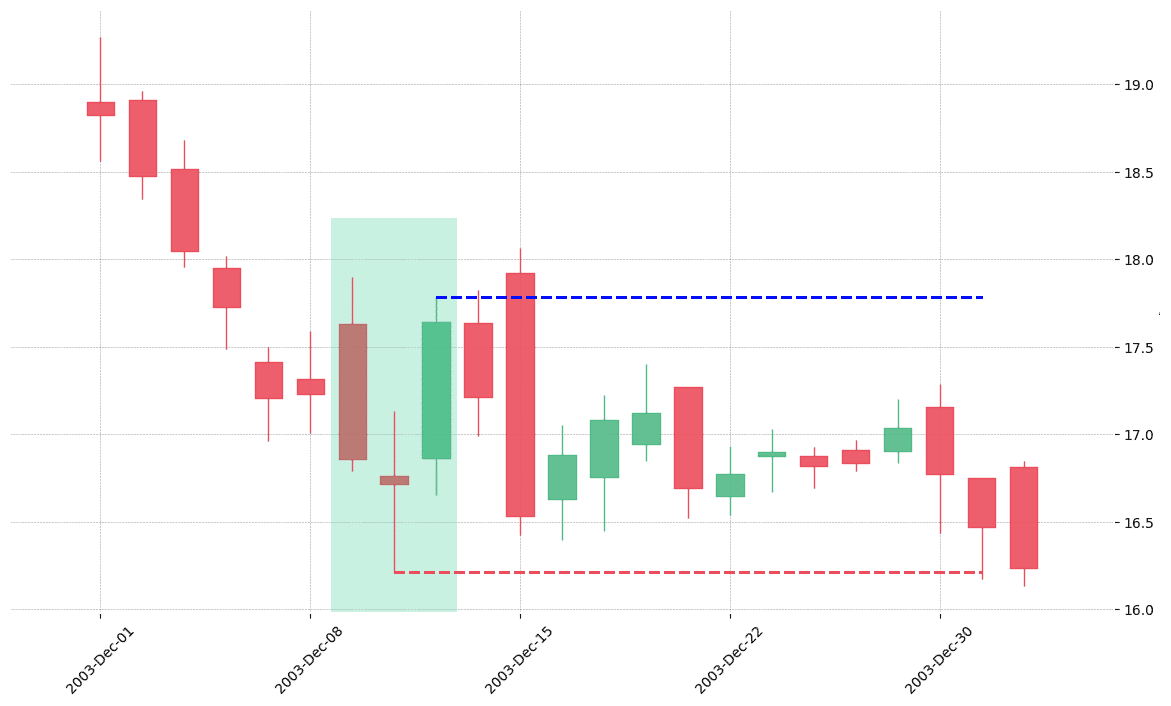
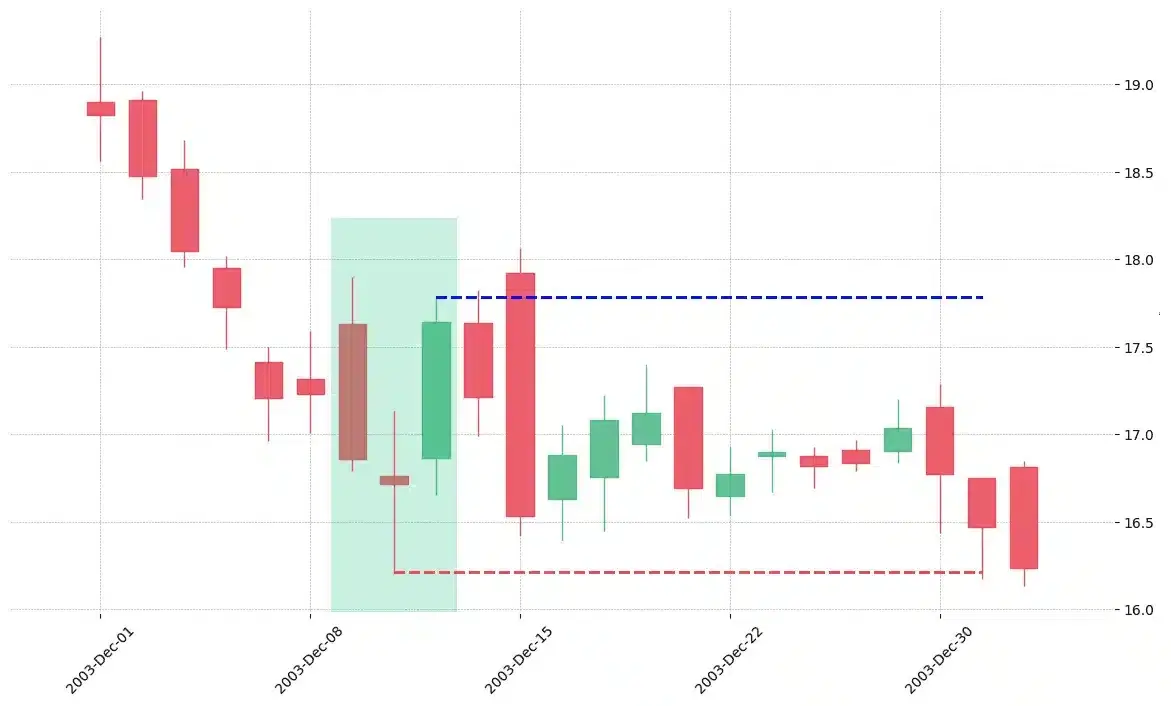
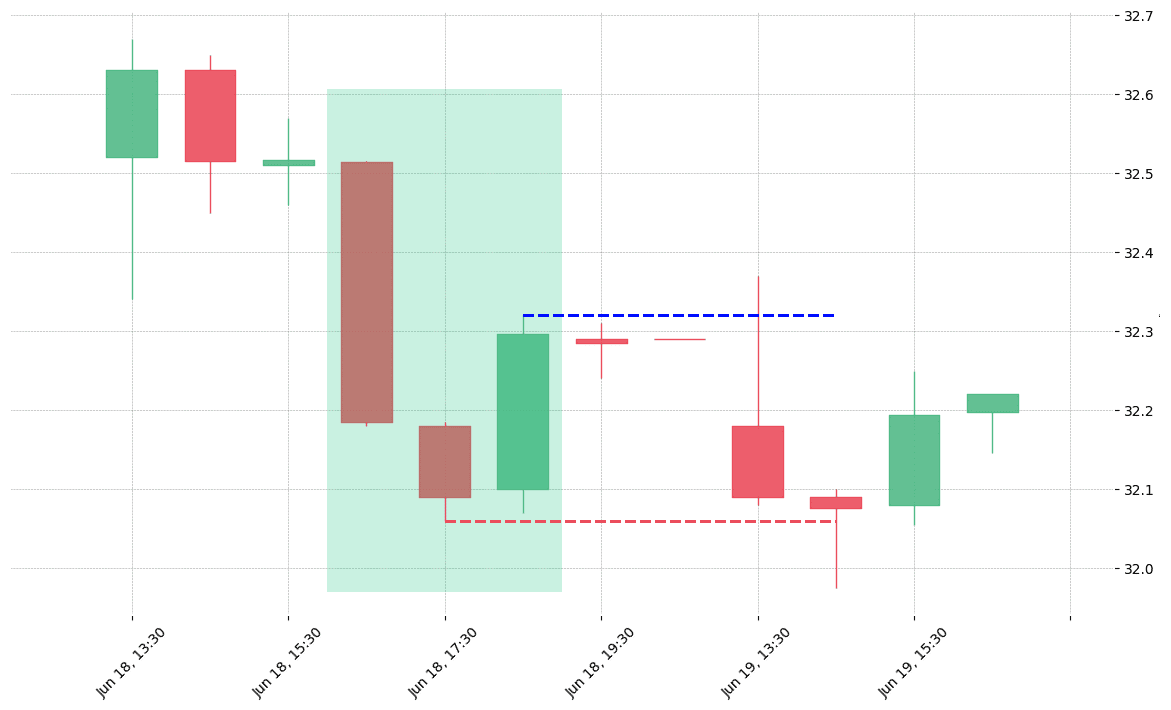
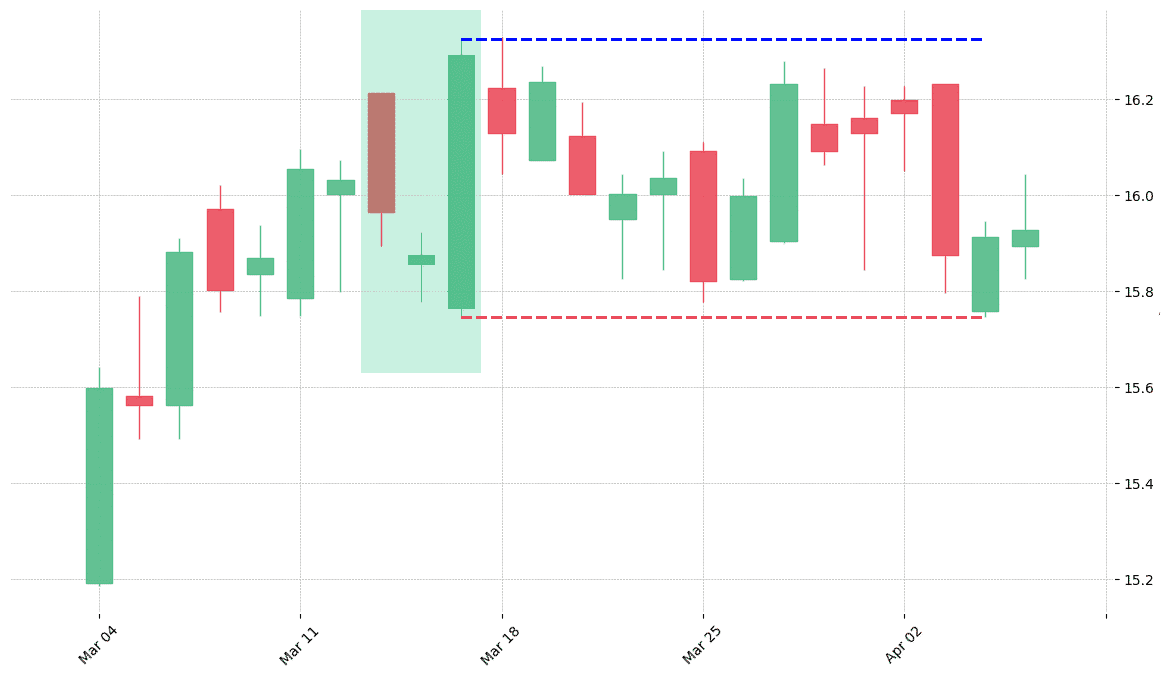
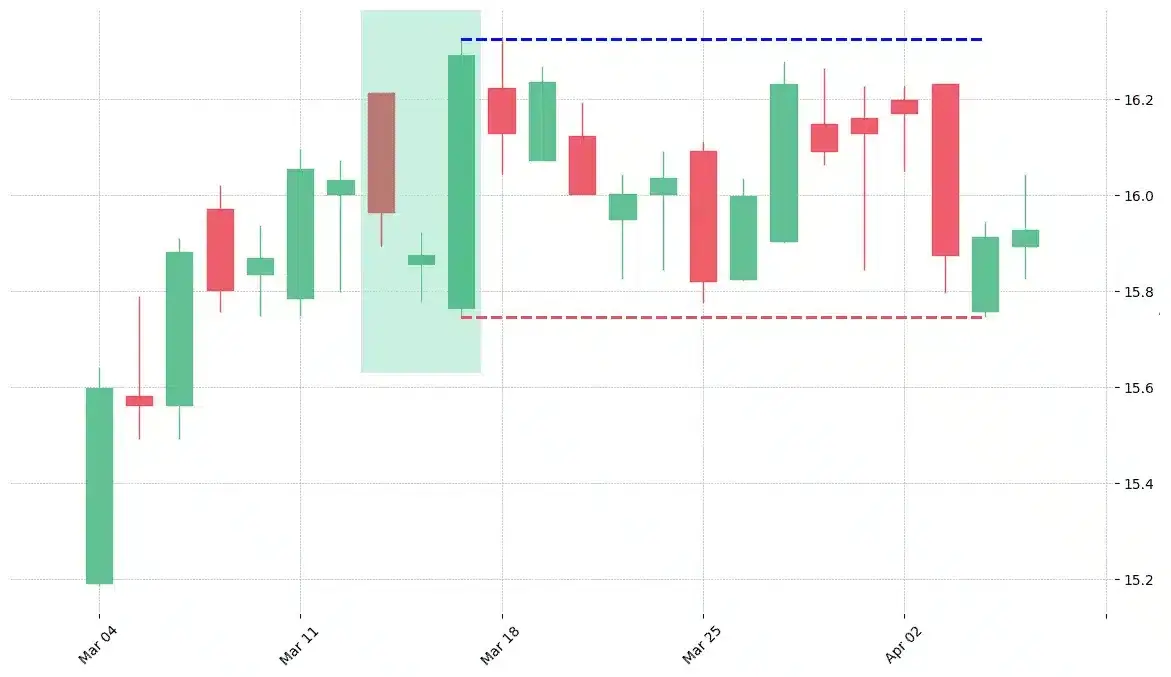
How does the Morning Star pattern look in real life?


Looking to learn more about this pattern?
You should take a look at Joe Marwood's online course. In his course, he backtested the 26 main candlestick patterns before to summarize which one is THE best pattern. I really liked his course and you shouldn't miss it!
Click here to signup to his "Candlestick Analysis For Professional Traders" course now!


 We loved Marwood Research’s course “Candlestick Analysis For Professional Traders“. Do you want to follow a great video course and deep dive into 26 candlestick patterns (and compare their success rates)? Then make sure to check this course!