 Good Trading requires the Best Charting Tool!
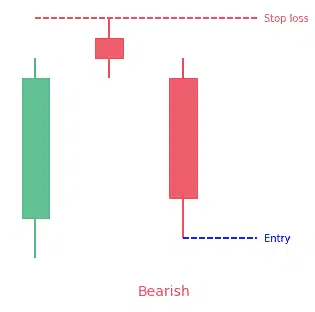
- An evening star pattern is a bearish 3-bar reversal candlestick pattern
- It starts with a tall green candle, then a small candle and finishes with a tall red candle
- The middle candle reports indecision in the market
- The opposite pattern is the morning star pattern
Statistics to prove if the Evening Star pattern really works
Are the odds of the Evening Star pattern in your favor?
How does the Evening Star behave with a 2:1 target R/R ratio?
From our research the Evening Star pattern confirms 70.2% of the time on average overall all the 4120 markets we analysed. Historically, this patterns confirmed within 3.3 candles or got invalidated within 7.3 candles. If confirmed, it reached the 2:1 R/R target 33.5% of the time and it retested it's entry price level 98.5% of the time.
Not accounting for fees, it has an expected outcome of 0.006 $/$.
It means for every $100 you risk on a trade with the Evening Star pattern you make $0.6 on average.
Want to account for your trading fees? Have the detailled stats for your favorite markets / timeframes? Or get the stats for another R/R than 2:1?
🚀 Join us now and get fine-tuned stats you care about!
How to handle risk with the Evening Star pattern?
We analysed 4120 markets for the last 59 years and we found 23 155 occurrences of the Evening Star pattern.
On average markets printed 1 Evening Star pattern every 674 candles.
For 2:1 R/R trades, the longest winning streak observed was 10 and the longest losing streak was 21. A trading strategy relying solely on this pattern is not advised. Anyway, make sure to use proper risk management.
Keep in mind all these informations are for educational purposes only and are NOT financial advice.
If you want to learn more and deep dive into candlestick patterns performance statistics, I strongly recommend you follow the best available course about it. Joe Marwood (who's a famous trader with more than 45 000 Twitter followers) created an online course called "Candlestick Analysis For Professional Traders" in his Marwood Research University. There he will take you through the extensive backtesting of the 26 main candlestick patterns. He then summarizes which one is THE best pattern. Do you know which one it is?
Remember, don't trade if you don't know your stats. Click here to signup to the course now!
What is the Evening Star pattern?
An evening star candlestick pattern is a stock-price chart pattern. Technical analysts use it to detect when a trend is about to reverse. It is a bearish candlestick pattern and it consists of three candles:
- a big green candlestick
- a small candle
- and a red candle
The first part of the evening star pattern is a large bullish green candle. The bulls are surely in charge on the first day, usually attaining new highs. The second day starts with a bullish gap up. That is clear from the opening of day 2 that the bulls are in control. Though, they do not push the price much higher. The candlestick on day 2 is usually small and can be bullish, bearish or neutral.
Generally, a bearish candlestick on day 2 is a stronger indicator of an impending reversal. But it is that of day 3 that is most significant. Day 3 starts with a gap down. This is a bearish signal. Bear are able to press prices even further downward, often eliminating the gains of day 1.
This pattern appears at the top of an uptrend and signals the slowing down of upward momentum. It announces a bearish move which lays the foundation for a new downtrend. Correctly detecting reversals is important when trading financial markets because it makes it possible for traders to enter at attractive levels at the beginning of a possible trend reversal. It’s risky but it often is where the bigger risk/reward ratios are to be found.
How to identify an Evening Star?
Identifying the evening star candlestick pattern on forex charts involves more than simply identifying the three main candles. What is needed is an understanding of past price action and where the pattern appears within the existing trend.
- Establish an existing uptrend: The market should show higher highs and higher lows.
- Large bullish candle: The big bullish candle is the end product of big buying pressure and a continuation of the existing uptrend. At this point, traders should only look for long trades because there is no evidence of a reversal yet.
- Small bearish or bullish candle: The second candle is a small candle, at times called the Doji candle that presents the first sign of an uptrend that is tired. Most times, the gap of this candle is higher as it makes a higher high. It doesn’t matter if the candle is bullish or bearish as the important thing here is that the market is undecided.
- Large bearish candle: The first sign of new selling pressure is shown in this candle. In markets that are non-forex, this candle gaps down from the close of the previous candle and signals the beginning of a new downtrend.
- Subsequent price action: After the reversal is successful, traders will notice lower highs and lower lows but should always manage the risk of a failed move through the use of well-positioned stops.
In the market, traders will always look for signs of indecision where the pressure of buying subsides and leaves the market flat. This is an ideal place for a Doji candle to be seen.
A specific case: the Evening Star doji
An evening star Doji can be seen as the market opens and closes at the same level or very close to the same level. This decision makes the way for a bearish move because bears see value at this level and avoid more buying. The appearance of a bearish candle after a Doji gives this bearish confirmation.
What does Evening Star tell traders?
Usually, a candlestick pattern is a way of presenting some information about a stock in a condensed manner. Particularly, it presents the open, high, low and close price for the stock over a given period of time.
Every candlestick consists of a candle and two wicks. The length of the candle is a function of the range between the highest and lowest price during the trading period. A long candle shows a big change in price, while a short one shows a small price change. In other words, the bodies of longer candlesticks show an intense buying or selling pressure, depending on the direction of the trend. Similarly, short candlesticks show little price movement.
The evening star pattern is considered a very strong indicator of future price declines. The pattern forms over a period of three days, with the first day consisting of a big white candle showing a continued rise in prices, the second day consisting of a candle that is smaller that indicates a more modest price increase, while the third day indicates a large red candle that opens at a price lower than the previous day and closes close to the middle of the first day.
Most traders consider the evening star as a reliable indicator that a downward trend is starting. However, it can be hard to discern when there is noise of stock price data. To help determine its reliability, traders mostly make use of price oscillators and trend lines to see if the patter has occurred.
How to trade when you see an Evening Star candlestick pattern?
Once the evening star candlestick pattern emerges, traders may want to make use of it as a signal to put in a sell order. This could be particularly useful ahead of a big news announcement because the star shows that the market will lack conviction to carry on its upward trend. Traders that want to assume lesser risk may however want to wait and make use of the star as a signal to plan for entry into the market selling on a subsequent move downward. This is because a breakout can follow the initial reversal to a still lower trading range.
Below is an example of a way of trading the evening star pattern:
- Set the right graph time frame: This will depend on a lot of trading strategy and it will give you a bigger picture of the price action.
- Get to know the open, high, low and close prices: Looking at a chart with 1-day candle will give you this idea. You will see the daily open and close prices and the high and low prices.
- Wait for the daily RSI to cross over 70: Most traders view an RSI cross above 70 as a clear overbought signal. It is a common method used by forex traders.
- Downgrade the time frame: After you’ve identified the RSI above 70 (overbought condition) on the longer term chart, it is time to zoom in.
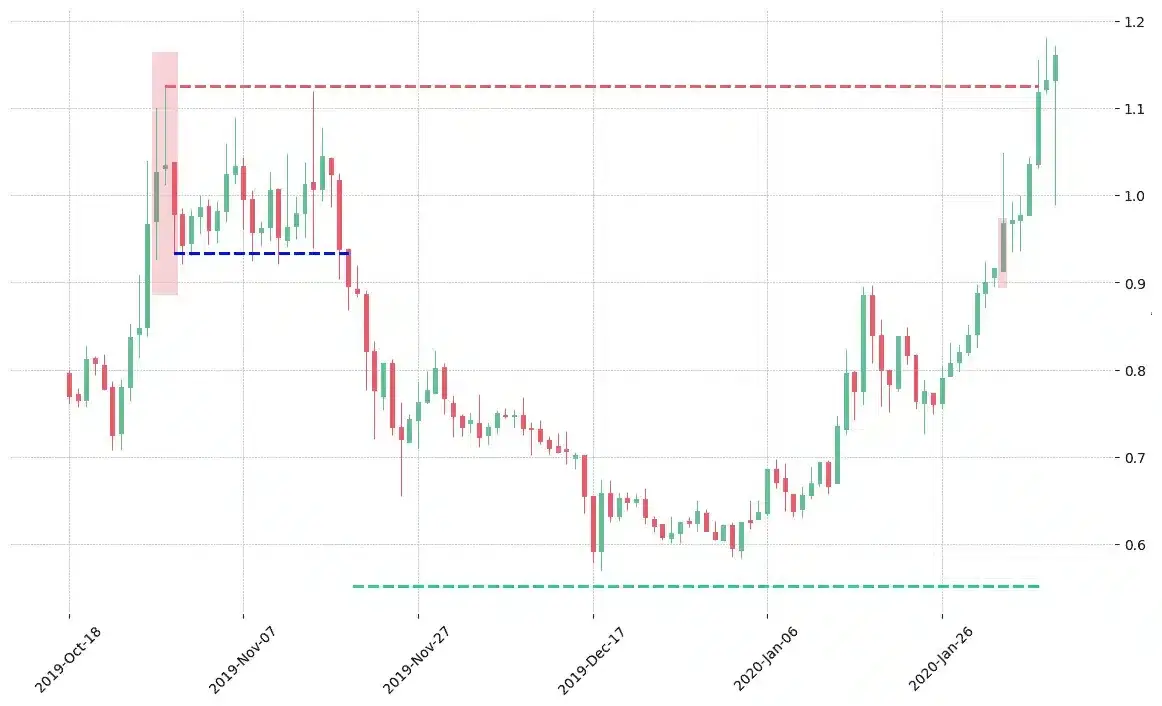
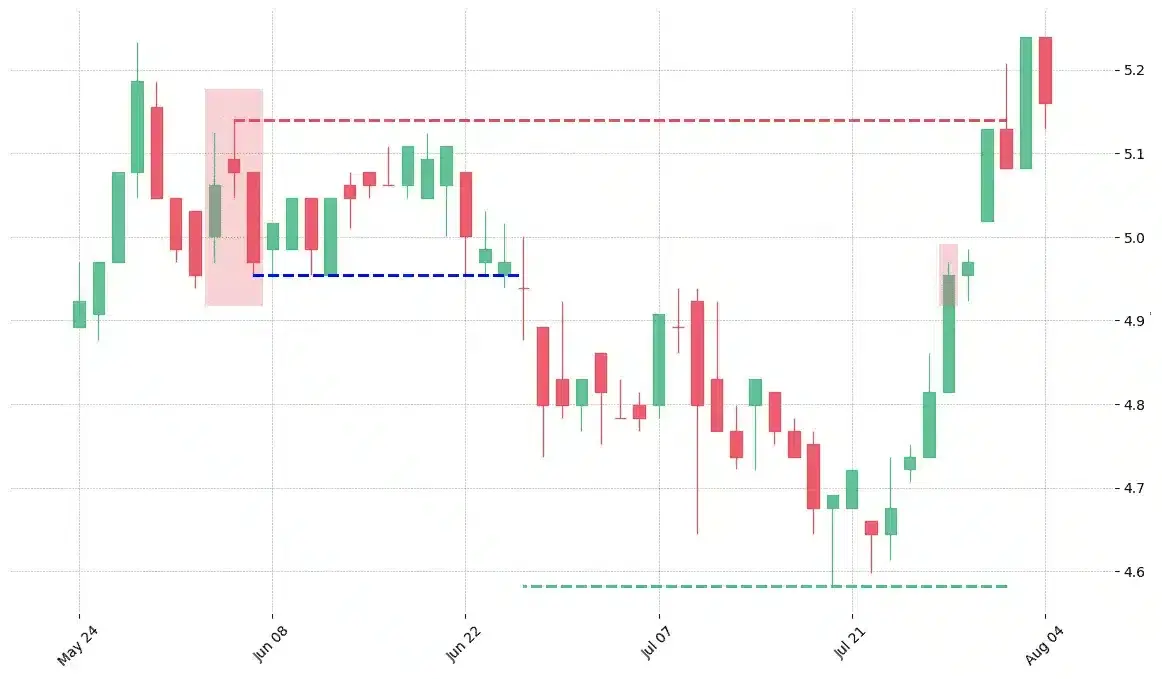
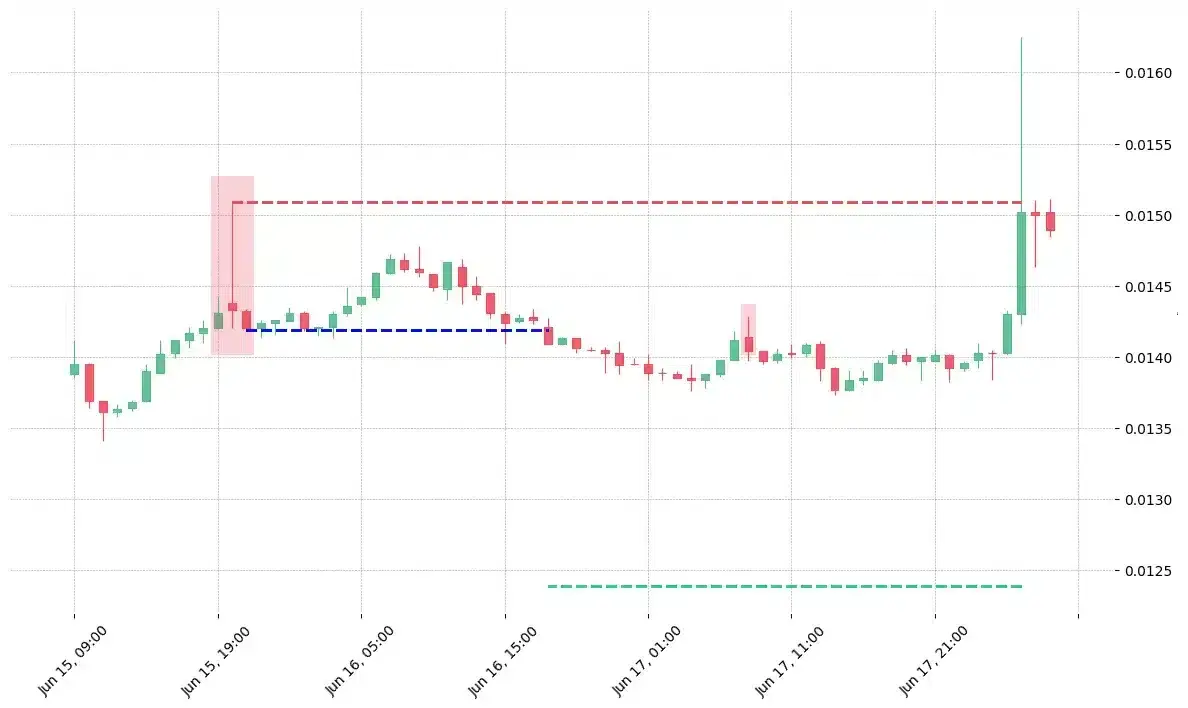
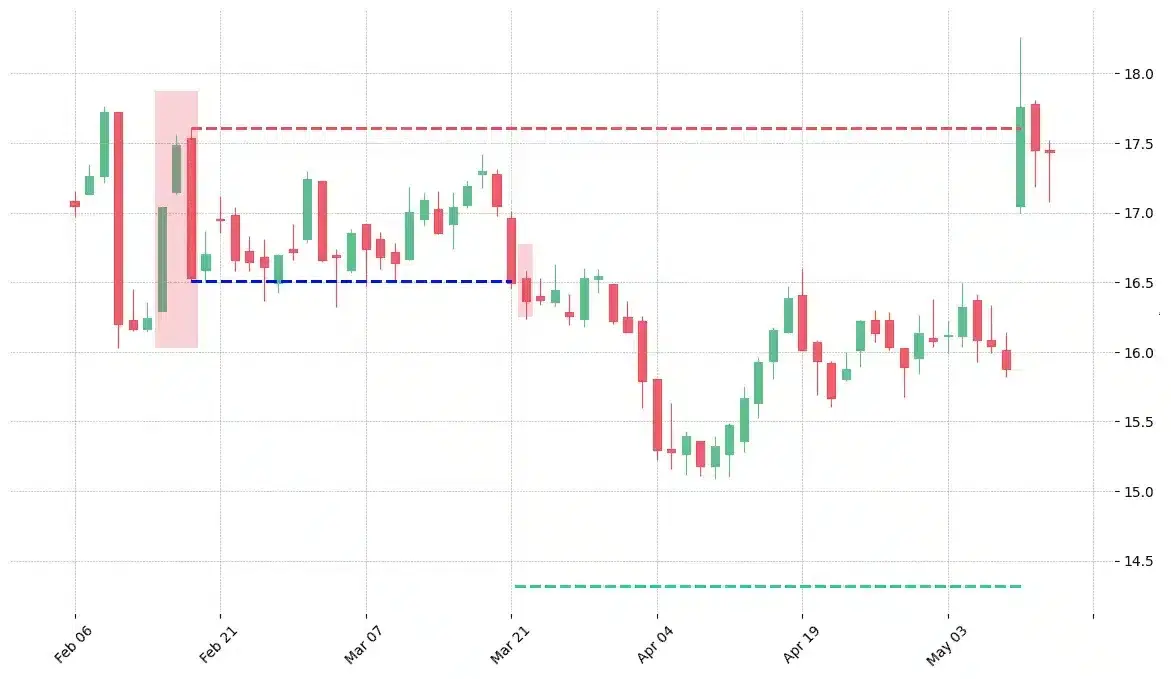
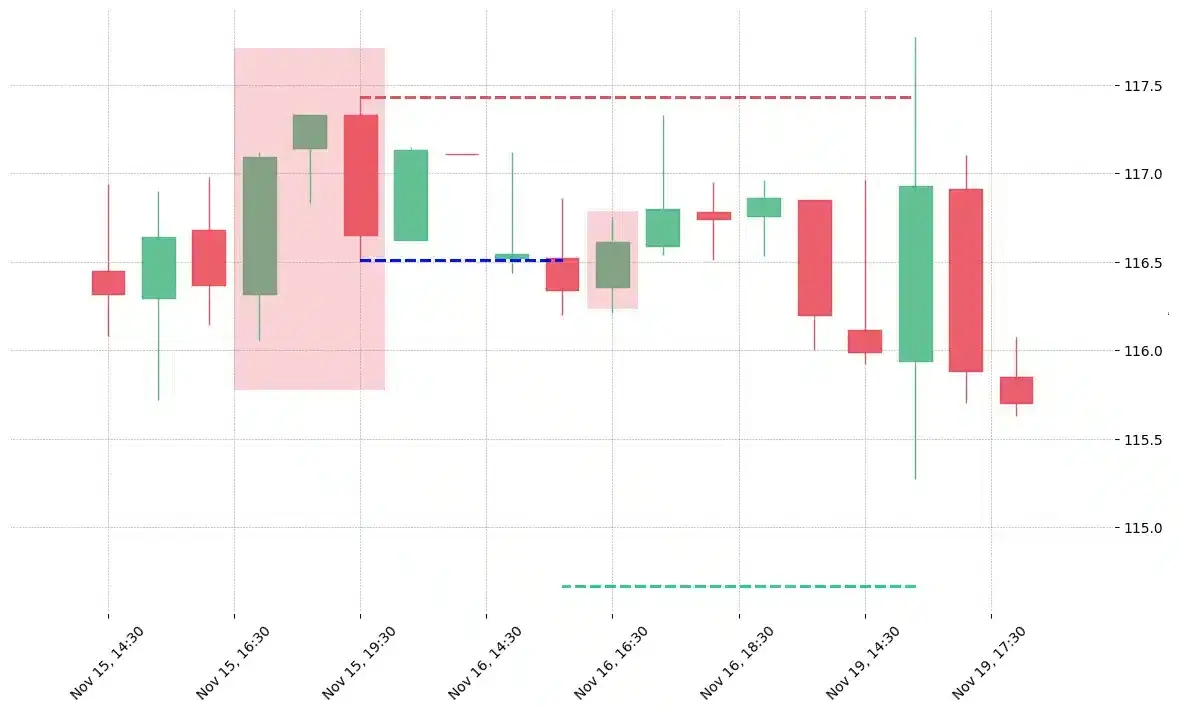
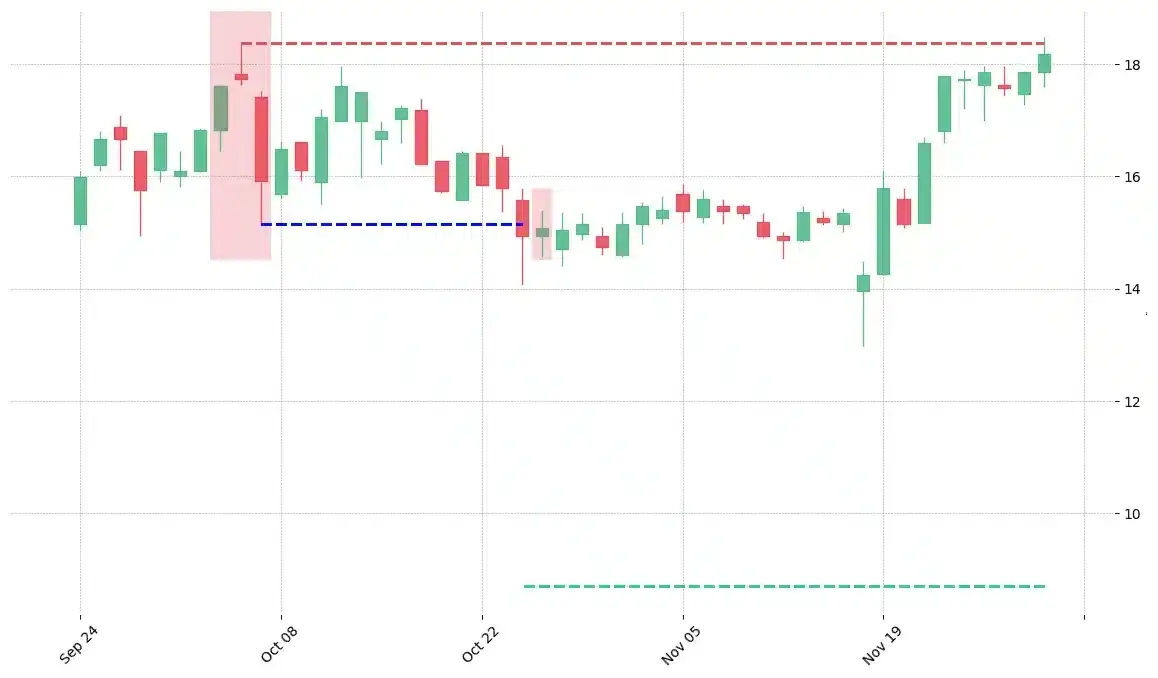
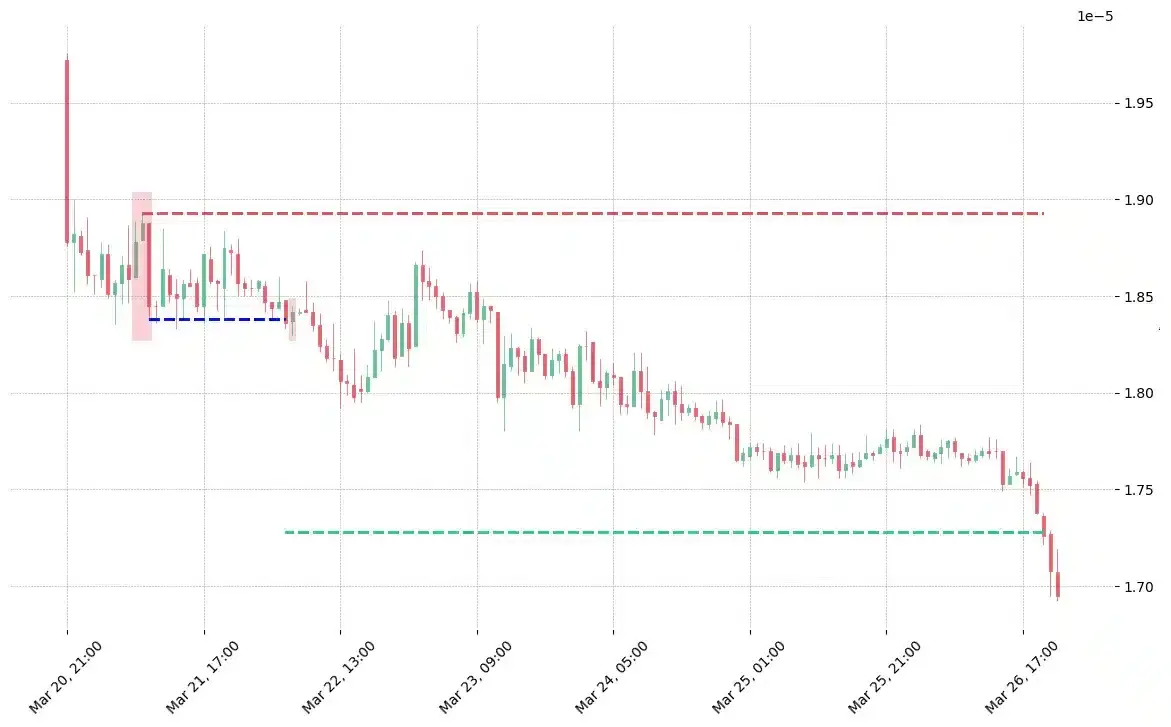
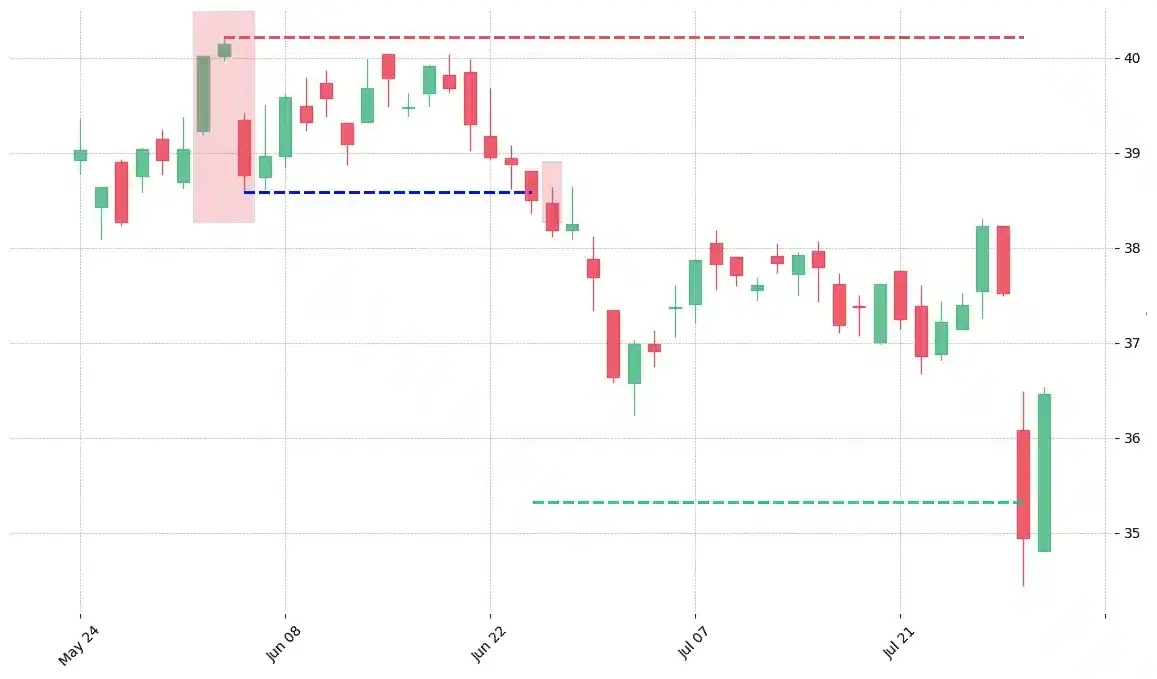
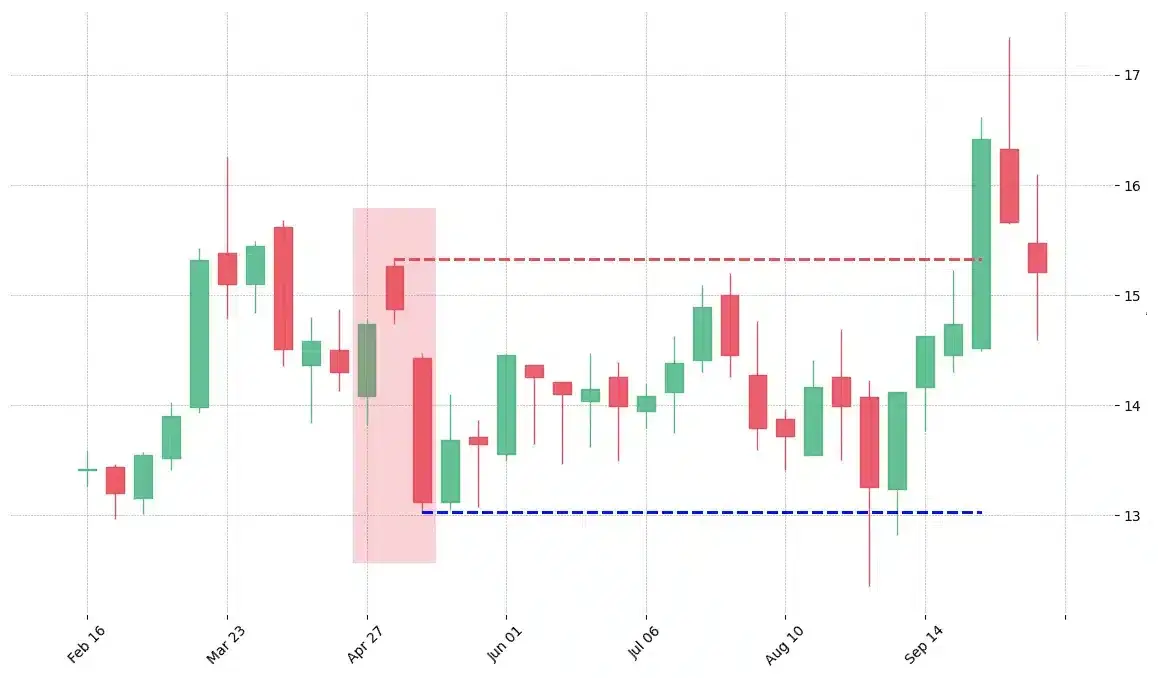
How do you trade it?
How does the Evening Star pattern look in real life?

Looking to learn more about this pattern?
You should take a look at Joe Marwood's online course. In his course, he backtested the 26 main candlestick patterns before to summarize which one is THE best pattern. I really liked his course and you shouldn't miss it!
Click here to signup to his "Candlestick Analysis For Professional Traders" course now!


 We loved Marwood Research’s course “Candlestick Analysis For Professional Traders“. Do you want to follow a great video course and deep dive into 26 candlestick patterns (and compare their success rates)? Then make sure to check this course!