 Good Trading requires the Best Charting Tool!
- The up-gap side by side white lines candlestick pattern is a 3-bar bullish continuation pattern.
- The first and second lines are separated by a bullish gap.
Statistics to prove if the Up-Gap Side By Side White Lines pattern really works
Are the odds of the Up Gap Side by Side White Lines and Down Gap Side by Side White Lines pattern in your favor?
How does the Up Gap Side by Side White Lines and Down Gap Side by Side White Lines behave with a 2:1 target R/R ratio?
From our research the Up Gap Side by Side White Lines and Down Gap Side by Side White Lines pattern confirms 88% of the time on average overall all the 4120 markets we analysed. Historically, this patterns confirmed within 1.1 candles or got invalidated within 6.6 candles. If confirmed, it reached the 2:1 R/R target 33.8% of the time and it retested it's entry price level 98.6% of the time.
Not accounting for fees, it has an expected outcome of 0.013 $/$.
It means for every $100 you risk on a trade with the Up Gap Side by Side White Lines and Down Gap Side by Side White Lines pattern you make $1.3 on average.
Want to account for your trading fees? Have the detailled stats for your favorite markets / timeframes? Or get the stats for another R/R than 2:1?
🚀 Join us now and get fine-tuned stats you care about!
How to handle risk with the Up Gap Side by Side White Lines and Down Gap Side by Side White Lines pattern?
We analysed 4120 markets for the last 59 years and we found 64 743 occurrences of the Up Gap Side by Side White Lines and Down Gap Side by Side White Lines pattern.
On average markets printed 1 Up Gap Side by Side White Lines and Down Gap Side by Side White Lines pattern every 241 candles.
For 2:1 R/R trades, the longest winning streak observed was 18 and the longest losing streak was 52. A trading strategy relying solely on this pattern is not advised. Anyway, make sure to use proper risk management.
Keep in mind all these informations are for educational purposes only and are NOT financial advice.
If you want to learn more and deep dive into candlestick patterns performance statistics, I strongly recommend you follow the best available course about it. Joe Marwood (who's a famous trader with more than 45 000 Twitter followers) created an online course called "Candlestick Analysis For Professional Traders" in his Marwood Research University. There he will take you through the extensive backtesting of the 26 main candlestick patterns. He then summarizes which one is THE best pattern. Do you know which one it is?
Remember, don't trade if you don't know your stats. Click here to signup to the course now!
What is the Up-Gap Side By Side White Lines candlestick pattern?
The up-gap side by side white lines candlestick pattern is a bullish continuation pattern with three candles. The first and second lines are separated by a bullish gap. The up-gap side by side white lines pattern indicates that buyers are up for covering their positions. It is a very rare pattern that appears very rarely during uptrends. The pattern should be a valid one if you want to base your trading strategies on the up-gap side by side white lines pattern. The validation of this pattern is provided by the next bullish candlestick or candlestick appearing onto the bullish gap.
How to identify the candlestick pattern?
As we have discussed earlier that the up-gap side by side white lines pattern is a very rare pattern. Being rare, it is still one of the most popular continuation patterns. Therefore, it is important for traders to know how to identify it. The up-gap side by side white lines pattern has the following characteristics that must be there in the formation.
- There must be a bullish trend as it is a bullish continuation pattern.
- The first candle is a white bullish candle.
- The second must also be a bullish candle and it just gaps up above the body of the first candle.
- The third candle is also a white candle that must be approximately equal in size to the second candle.
- The second and third candles must be side by side and must have the same opening price.
What does the up-gap side by side white lines candlestick pattern tell traders?
All the candlestick chart patterns are unique and differ from each other. They all signal different information about the markets that can be used to increase the odds of getting maximum profits from financial trading. The up-gap side by side white lines candlestick pattern is also another continuation pattern that tells readers about what actually is happening in the market.
As the up-gap side by side white lines pattern appears during an uptrend, the overall market sentiment is a bullish one. All the market participants firmly believe that the market will continue to rise. Hence, the first bullish candle of the up-gap side by side white lines pattern indicates exactly the same idea. The same bullish sentiment goes on to the next day creating a gap up and another bullish candlestick. However, at this point, all the market participants think that market might not be able to continue the uptrend, and eventually, sell orders begin to increase.
However, the bullish sentiment remains intact and does not yield to the bearish efforts. A great number of bulls still consider the market attractive and they continue to buy. As a result of this bullish response, the market manages to go up and reach around the close of the previous day. As the bullish respond with the full force and again take full control of the market. This indicates that the uptrend will continue. Hence, the up-gap side by side white lines pattern is a very powerful bullish continuation pattern. However, the traders should look for confirmation before initiating a trade on the basis of the up-gap side by side white lines pattern.
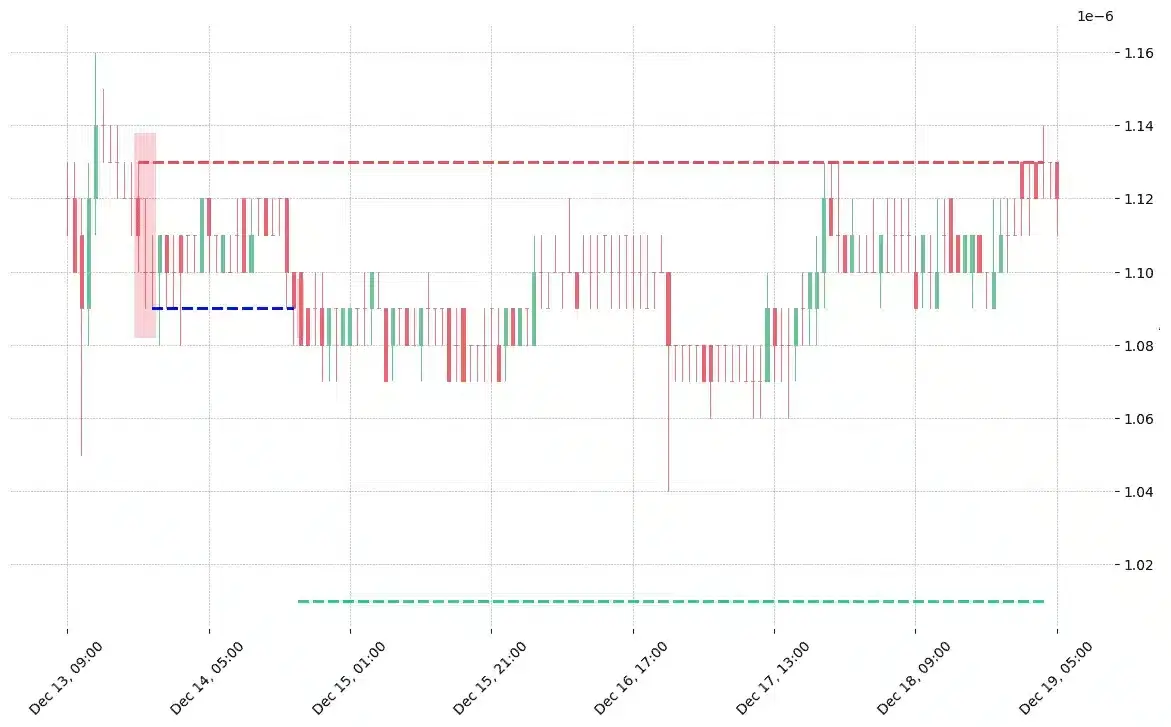
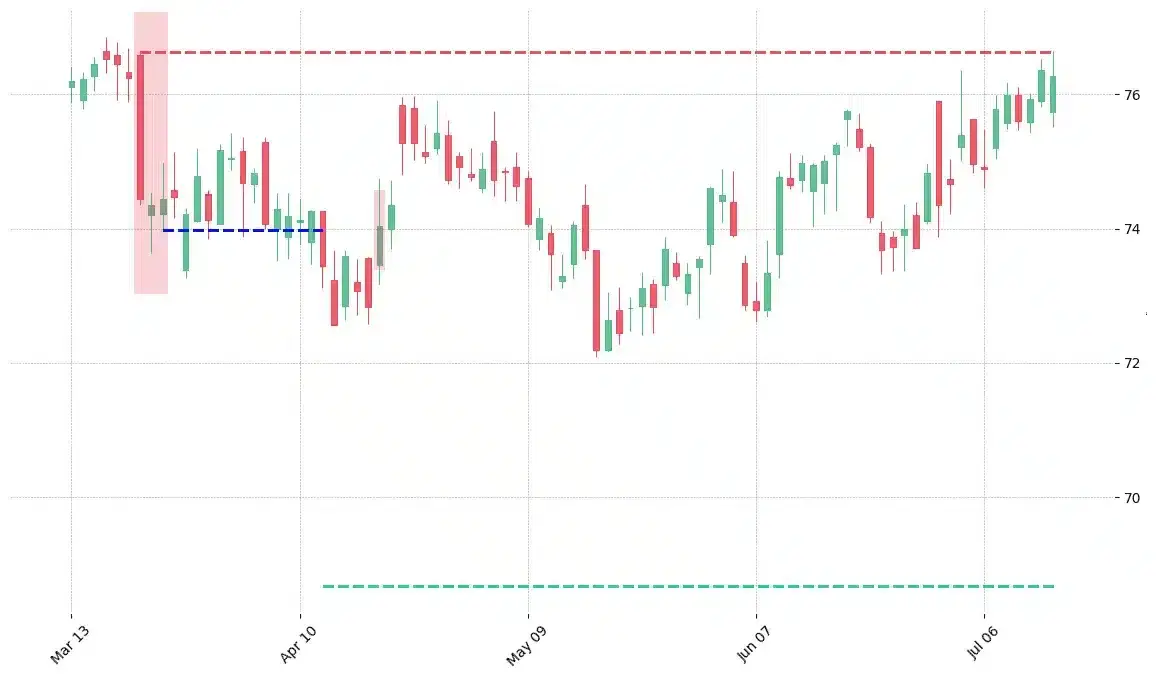
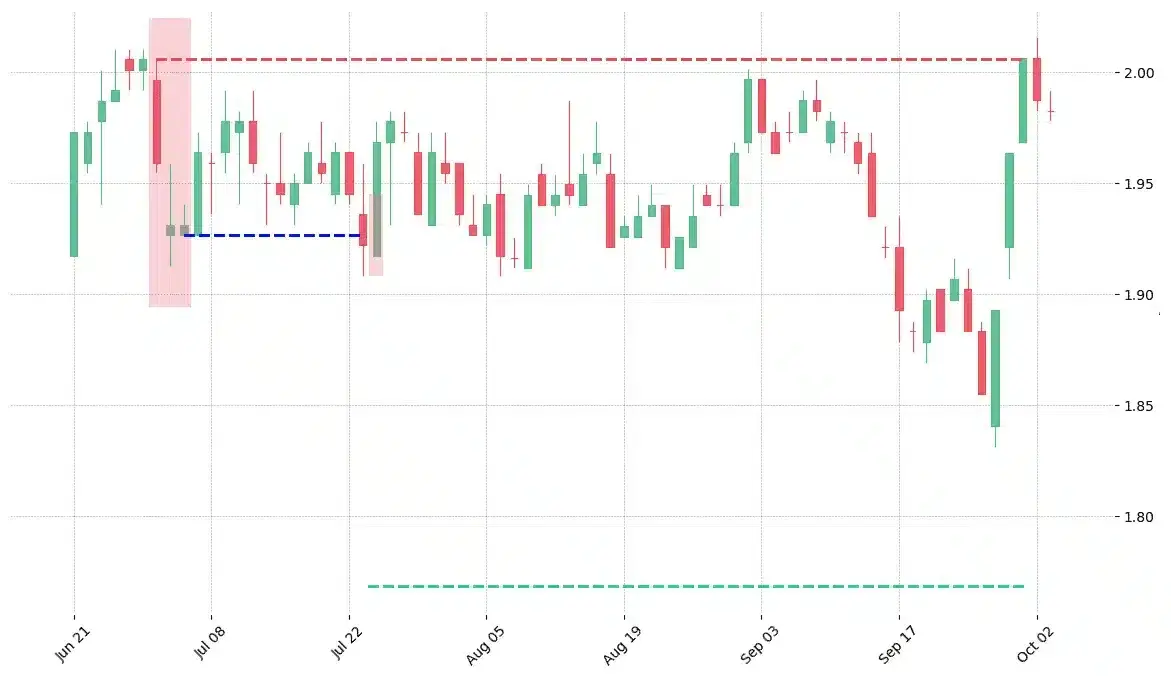
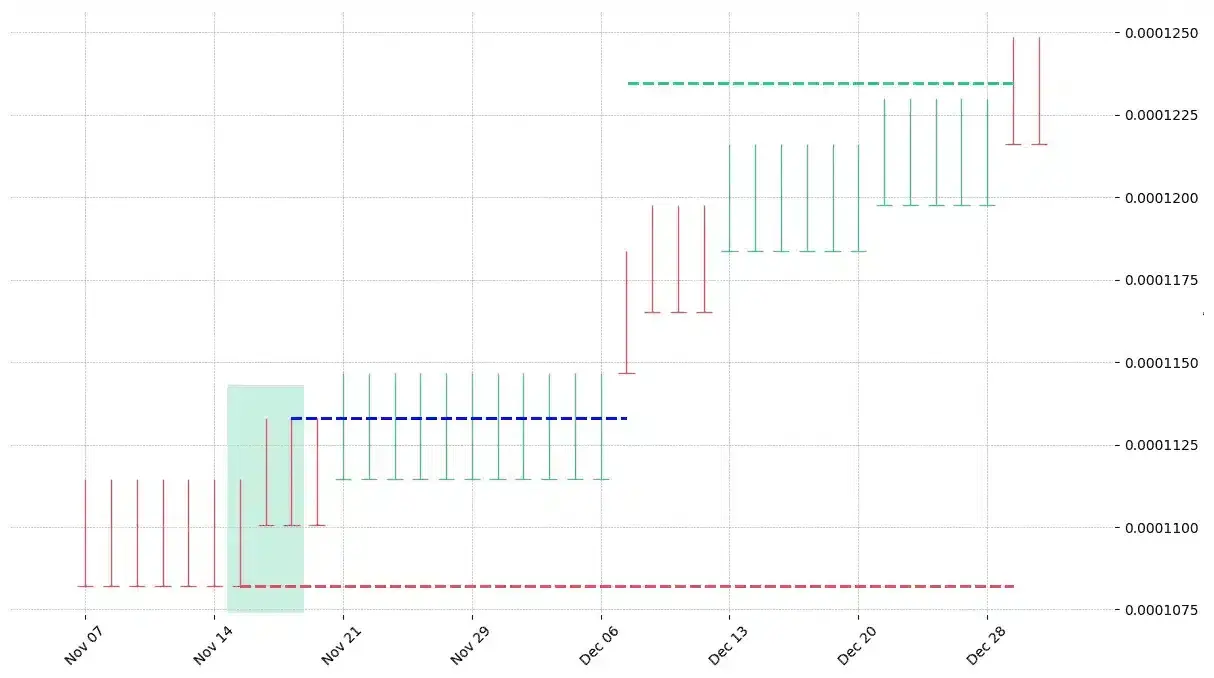
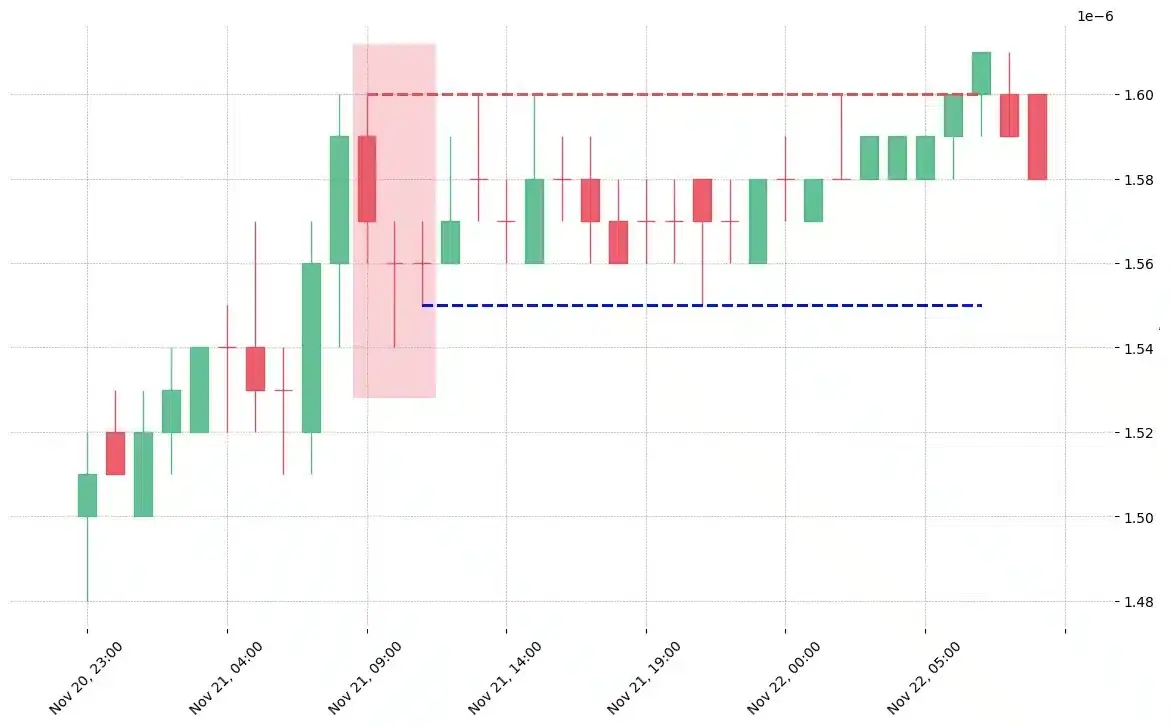
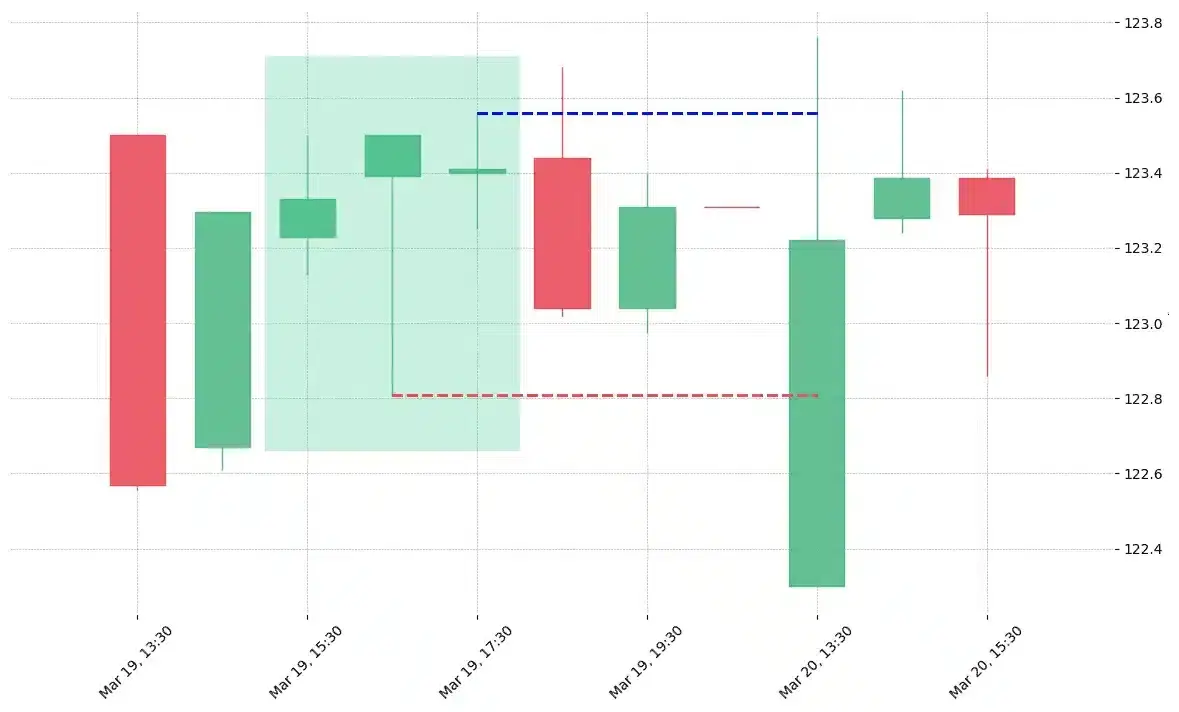
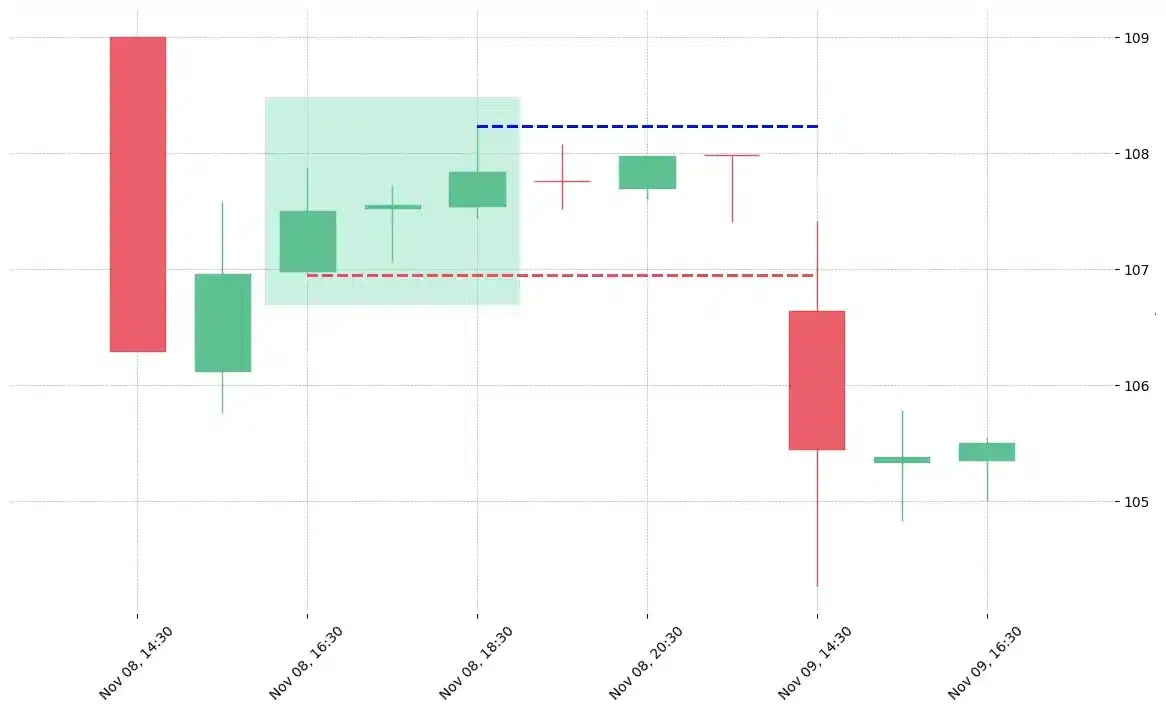
How does Up-Gap Side By Side White Lines pattern look in real life?

Looking to learn more about this pattern?
You should take a look at Joe Marwood's online course. In his course, he backtested the 26 main candlestick patterns before to summarize which one is THE best pattern. I really liked his course and you shouldn't miss it!
Click here to signup to his "Candlestick Analysis For Professional Traders" course now!


 We loved Marwood Research’s course “Candlestick Analysis For Professional Traders“. Do you want to follow a great video course and deep dive into 26 candlestick patterns (and compare their success rates)? Then make sure to check this course!