
 Good Trading requires the Best Charting Tool!
- The identical three crows candlestick pattern is a 3-bar bearish reversal pattern.
- It occurs during an uptrend.
- It is made of three consecutive bearish candlesticks.
Statistics to prove if the Identical Three Crows pattern really works
Are the odds of the Identical Three Crows pattern in your favor?
How does the Identical Three Crows behave with a 2:1 target R/R ratio?
From our research the Identical Three Crows pattern confirms 87.5% of the time on average overall all the 4120 markets we analysed. Historically, this patterns confirmed within 2.3 candles or got invalidated within 11.1 candles. If confirmed, it reached the 2:1 R/R target 30.7% of the time and it retested it's entry price level 98.6% of the time.
Not accounting for fees, it has an expected outcome of -0.078 $/$.
It means for every $100 you risk on a trade with the Identical Three Crows pattern you lose $7.8 on average.
Want to account for your trading fees? Have the detailled stats for your favorite markets / timeframes? Or get the stats for another R/R than 2:1?
🚀 Join us now and get fine-tuned stats you care about!
How to handle risk with the Identical Three Crows pattern?
We analysed 4120 markets for the last 59 years and we found 5 521 occurrences of the Identical Three Crows pattern.
On average markets printed 1 Identical Three Crows pattern every 2 826 candles.
For 2:1 R/R trades, the longest winning streak observed was 7 and the longest losing streak was 20. A trading strategy relying solely on this pattern is not advised. Anyway, make sure to use proper risk management.
Keep in mind all these informations are for educational purposes only and are NOT financial advice.
If you want to learn more and deep dive into candlestick patterns performance statistics, I strongly recommend you follow the best available course about it. Joe Marwood (who's a famous trader with more than 45 000 Twitter followers) created an online course called "Candlestick Analysis For Professional Traders" in his Marwood Research University. There he will take you through the extensive backtesting of the 26 main candlestick patterns. He then summarizes which one is THE best pattern. Do you know which one it is?
Remember, don't trade if you don't know your stats. Click here to signup to the course now!
What is the Identical Three Crows candlestick pattern?
The identical three crows candlestick pattern is a bearish reversal pattern that occurs during an uptrend. It forms only when the opening prices of one day and closing prices of the previous day are roughly the same. The success of the trade on the basis of the identical three crows pattern depends on the clearance of the formation of this pattern.
It is one of the most reliable reversal patterns particularly when the other technical indicators also provide confirmation. The pattern is interesting because the size of its three candles and shadows is helpful to judge the risk of retracement of a reversal.
How to identify the identical three crows candlestick pattern?
The identification of the identical three crows candlestick pattern is a bit complex because it has three candlesticks. As other candlestick patterns, this pattern is a visual pattern. Hence, traders do not have to worry about particular calculations to identify the identical three crows pattern. It just have to follow a few conditions.
The identical three crows have the following characteristics.
- It must be consists of three consecutive bearish candlesticks. They illustrate that bears have overwhelmed the bulls during three consecutive trading sessions.
- The first candle of the identical three crows pattern is long and black.
- The second candle is also long and black. It opens near or at the same closing level as the first candle.
- The third is again long and black opening near or at the same closing level of the second candle.
- All the bodies must have real and identical bodies with exactly the same size.
- All the candles have a very small shadow or without a shadow at all.
What does the pattern tell traders?
The identical three crows candlestick pattern is a bearish reversal pattern. It indicates an upcoming reversal of the trend from bullish to bearish. The pattern also reveals the psychology that leads to the formation of the identical three crows. It illustrates that the bulls have complete control over the market and are continuously trying to push prices high. But, once the pattern ends, anything is possible. Generally, prices make lower lows for a short period of time, then bounce up, round over, and eventually go down again.
What does actually happen? It happens that the bulls start the trading session with the prices slightly higher than the closing of the previous session. But the entry of the bears put pressure and prices begin to decrease. Eventually the closing levels are low as a result of bears’ pressure. Volume is also another factor that helps to get an insight into the market. For example, relatively low volume during the uptrend and the high volume of identical three crows during the session suggest that a small group of bulls established the uptrend but a large group of bears reversed the trend.
That is how the chart patterns help to identify different things and also to get an insight into the market sentiment. However, technical analysts and expert traders suggest using the identical three crows candlestick pattern in conjunction with other technical analysis tools for a confirmation of a trend reversal in the market.
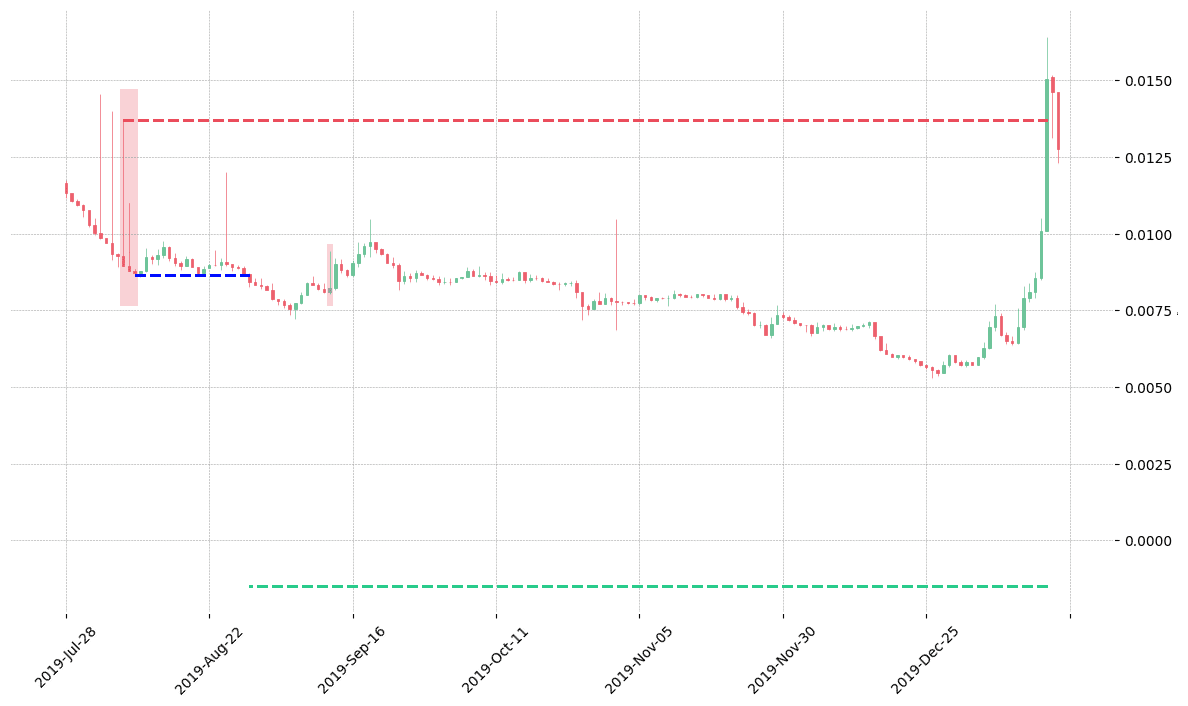
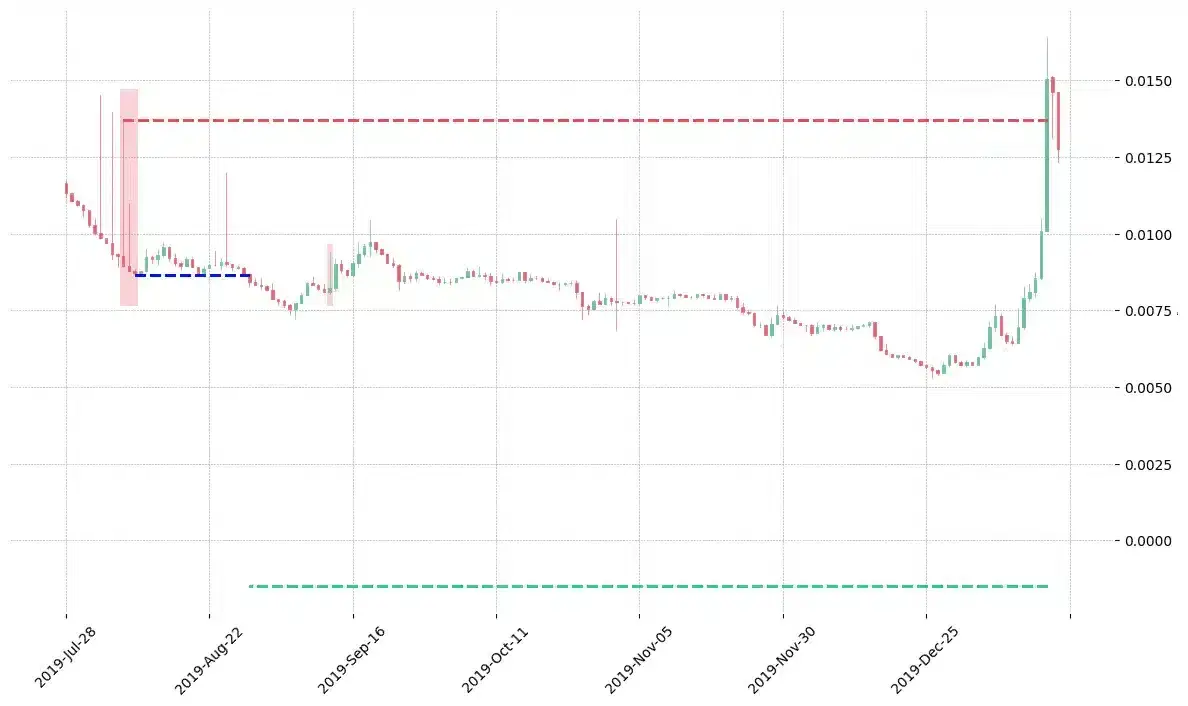
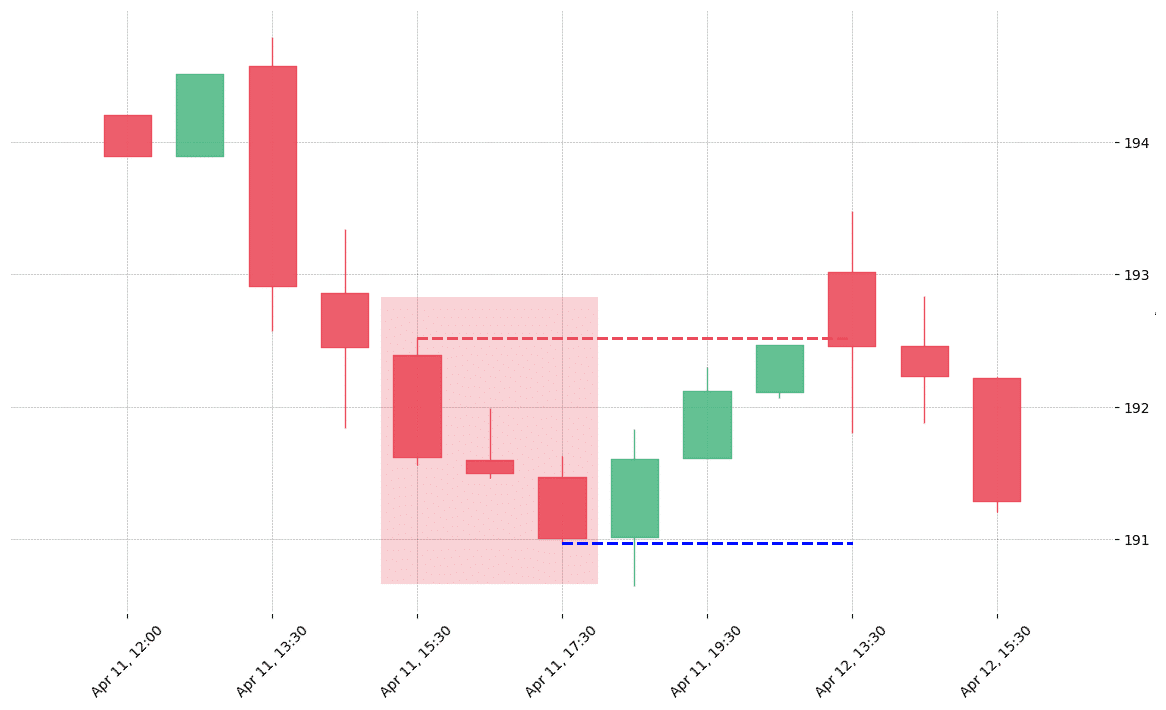
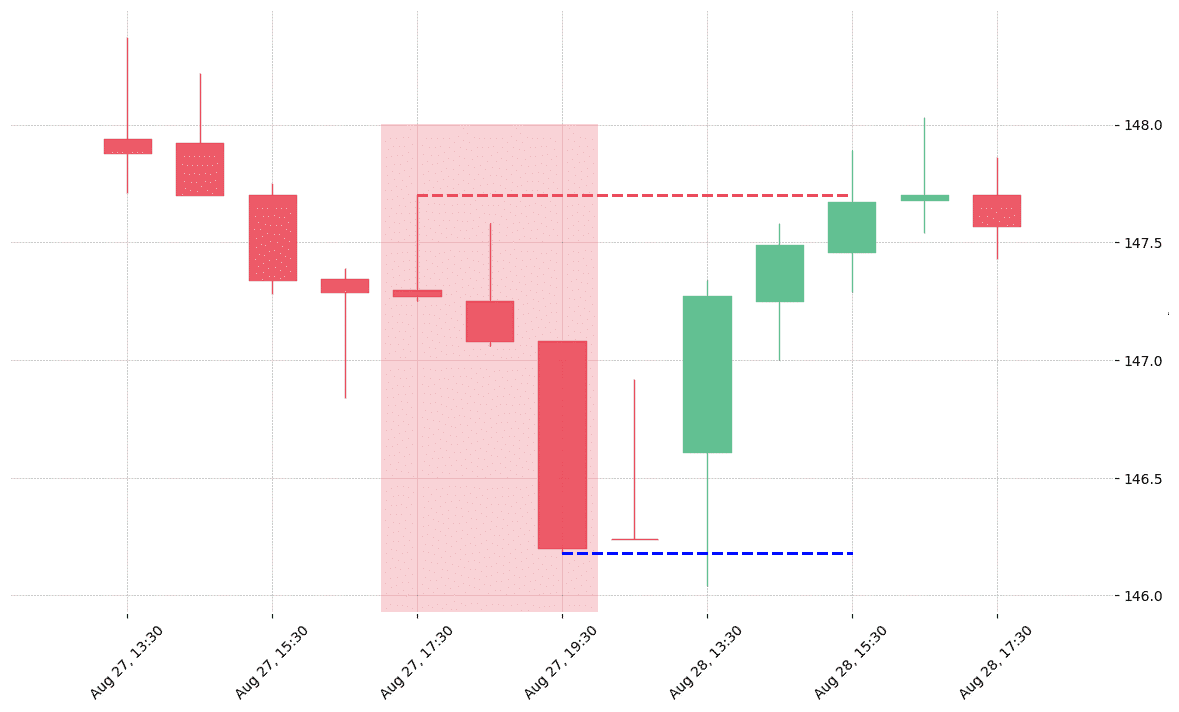
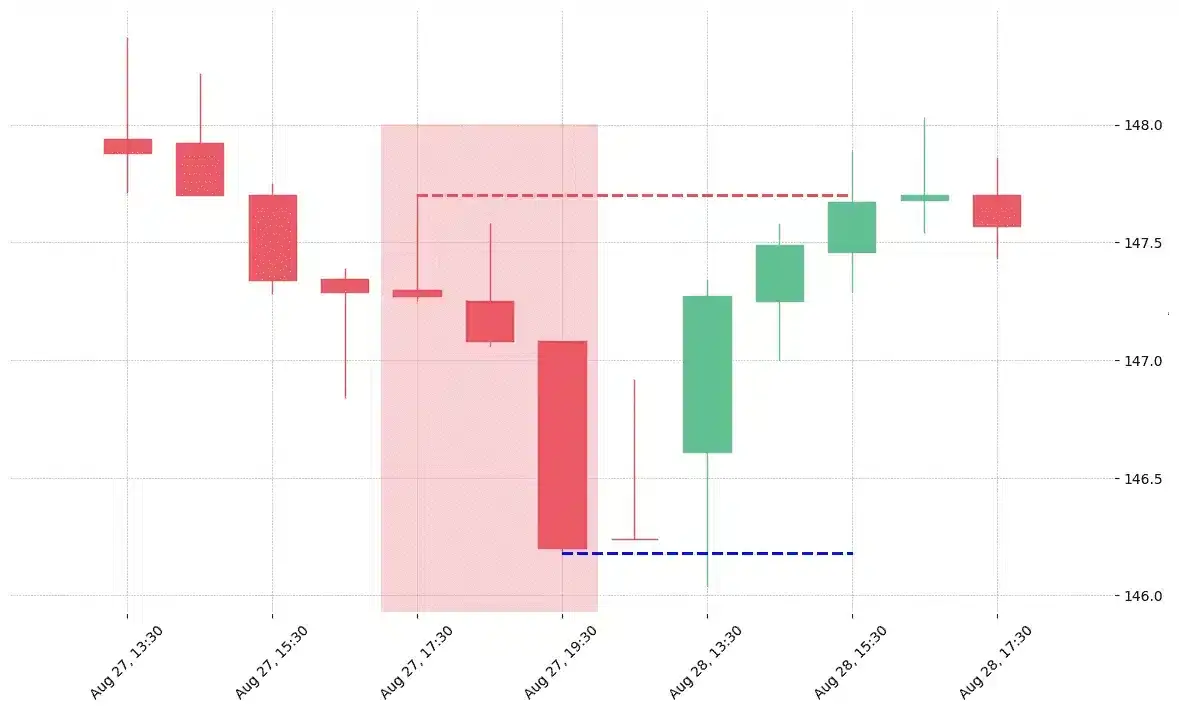
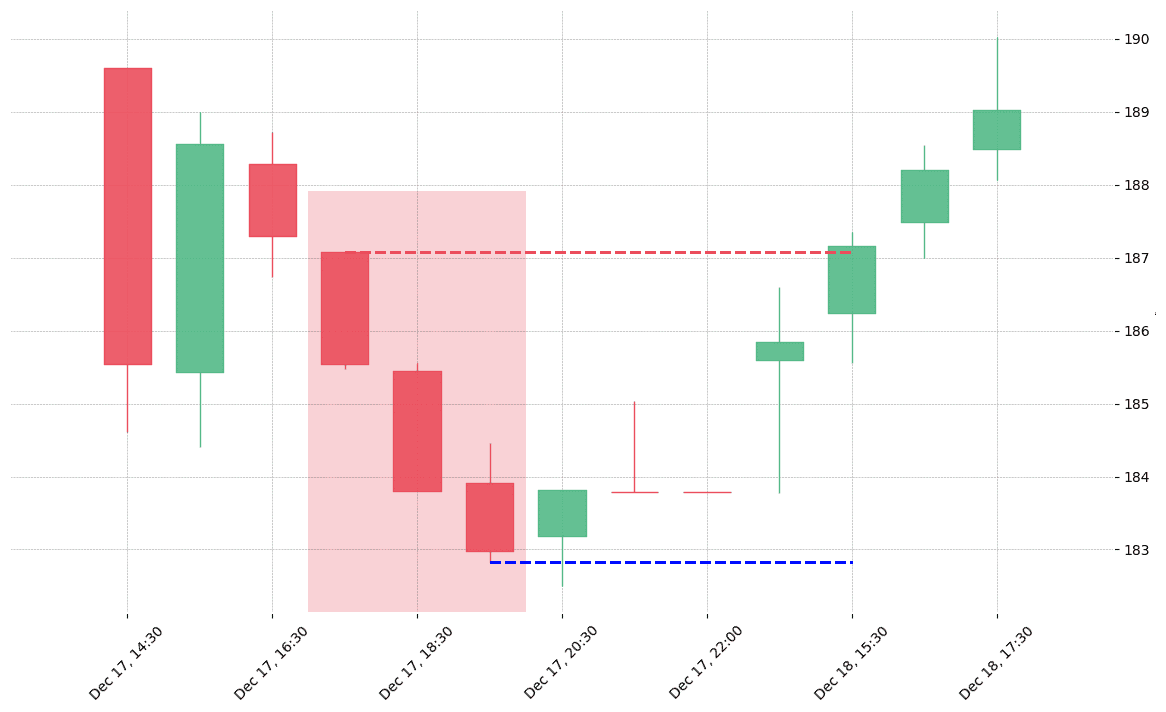
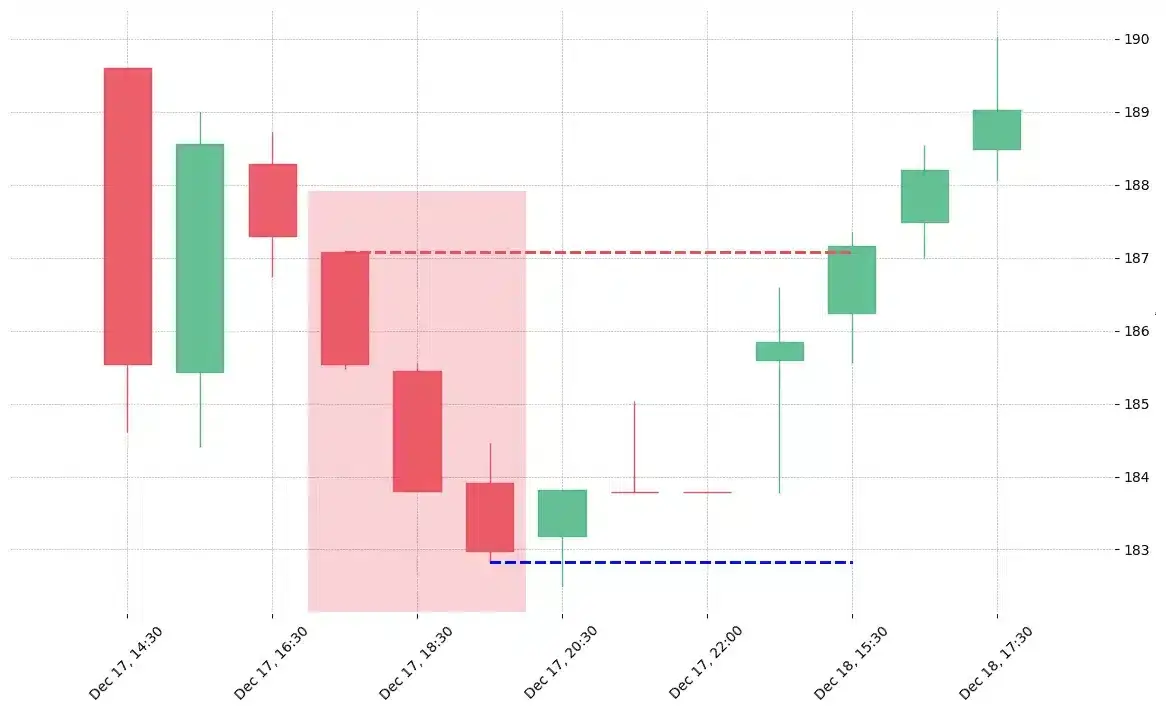
How does Identical Three Crows pattern look in real life?

Looking to learn more about this pattern?
You should take a look at Joe Marwood's online course. In his course, he backtested the 26 main candlestick patterns before to summarize which one is THE best pattern. I really liked his course and you shouldn't miss it!
Click here to signup to his "Candlestick Analysis For Professional Traders" course now!


 We loved Marwood Research’s course “Candlestick Analysis For Professional Traders“. Do you want to follow a great video course and deep dive into 26 candlestick patterns (and compare their success rates)? Then make sure to check this course!