
 Good Trading requires the Best Charting Tool!
- The in-neck candlestick pattern is a 2-bar continuation pattern.
- Closing prices of both candles are the same or nearly the same forming a horizontal neckline.
Statistics to prove if the In-neck pattern really works
Are the odds of the In Neck pattern in your favor?
How does the In Neck behave with a 2:1 target R/R ratio?
From our research the In Neck pattern confirms 52.2% of the time on average overall all the 4120 markets we analysed. Historically, this patterns confirmed within 4.7 candles or got invalidated within 5.5 candles. If confirmed, it reached the 2:1 R/R target 34.9% of the time and it retested it's entry price level 96.6% of the time.
Not accounting for fees, it has an expected outcome of 0.047 $/$.
It means for every $100 you risk on a trade with the In Neck pattern you make $4.7 on average.
Want to account for your trading fees? Have the detailled stats for your favorite markets / timeframes? Or get the stats for another R/R than 2:1?
🚀 Join us now and get fine-tuned stats you care about!
How to handle risk with the In Neck pattern?
We analysed 4120 markets for the last 59 years and we found 5 202 occurrences of the In Neck pattern.
On average markets printed 1 In Neck pattern every 2 999 candles.
For 2:1 R/R trades, the longest winning streak observed was 7 and the longest losing streak was 14. A trading strategy relying solely on this pattern is not advised. Anyway, make sure to use proper risk management.
Keep in mind all these informations are for educational purposes only and are NOT financial advice.
If you want to learn more and deep dive into candlestick patterns performance statistics, I strongly recommend you follow the best available course about it. Joe Marwood (who's a famous trader with more than 45 000 Twitter followers) created an online course called "Candlestick Analysis For Professional Traders" in his Marwood Research University. There he will take you through the extensive backtesting of the 26 main candlestick patterns. He then summarizes which one is THE best pattern. Do you know which one it is?
Remember, don't trade if you don't know your stats. Click here to signup to the course now!
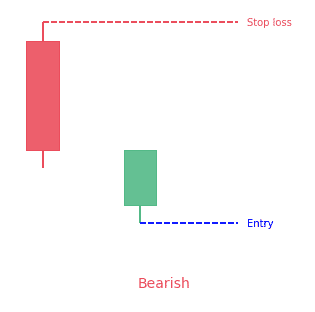
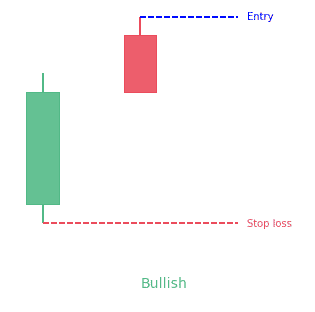
The in-neck candlestick pattern is a bearish continuation pattern. It appears during downtrends and predicts the continuation of the current downtrend in the market.
How to identify the in-neck candlestick pattern?
The in-neck candlestick pattern is a two-bar pattern. Although it is a pattern that is easy to identify yet traders need to focus because it appears very infrequently. A pattern needs to meet the following conditions to be an in-neck candlestick pattern.
- First of all, it is important that a downtrend must be there for the in-neck candlestick to form.
- The first candle must be a long bearish candlestick.
- The second candle must be a white candle.
- The second candle must open below the previous candle and must close at or slightly above the close of the prior day.
Although the criteria for the in-neck candlestick pattern is simple and easy, yet care must be taken to correctly identify the pattern. It is very similar to the on-neck candlestick pattern that also appears during a downtrend and predicts the continuation of the current trend in the market. However, there is a slight difference between the two patterns. The on-neck pattern’s second candle closes slightly lower than the low of the previous day. Therefore, it is important to take time to correctly identify the pattern whenever looking to identify either of the two candlestick patterns.
What does the in-neck candlestick pattern tell traders?
The in-neck candlestick pattern tells traders about the possibility of the continuation of the current trend in the market. If the study thoroughly, it also shed light on the overall behavior of the market in which it appears. The appearance of the first bearish candle indicates the strength of the bears in the market. The second candle is a bullish one that shows that bulls are attempting a rally to turn the tables. However, the second candle fails to close above the close of the bearish candle.
Theoretically, the appearance of the in-neck pattern predicts the continuation of the current downtrend in the market because bulls simply cannot overwhelm the bears. It is the specialty of the in-neck pattern that it can predict the continuation despite the bull’s best efforts to push the market up by putting considerable buying pressure. The market goes on its own way after the selling by the bulls who once take a long position hoping for a short pullback. Hence, the current downtrend in the market continues.
How to use it with other indicators?
The in-neck pattern can be used to devise some good trading strategies. For example, it can work well with the ADX indicator. After the formation of the in-neck pattern, traders can exit the trade when the ADX is above thirty. Traders can also trade with the in-neck pattern with breakout conditions. They can enter the trade when the market breaks down below the open of the second bar. Hence, the in-neck candlestick pattern is a reliable candlestick pattern when correctly identified. However, it is important to note that all trading patterns should be used in conjunction with other technical analysis tools to avoid wrong strategies.
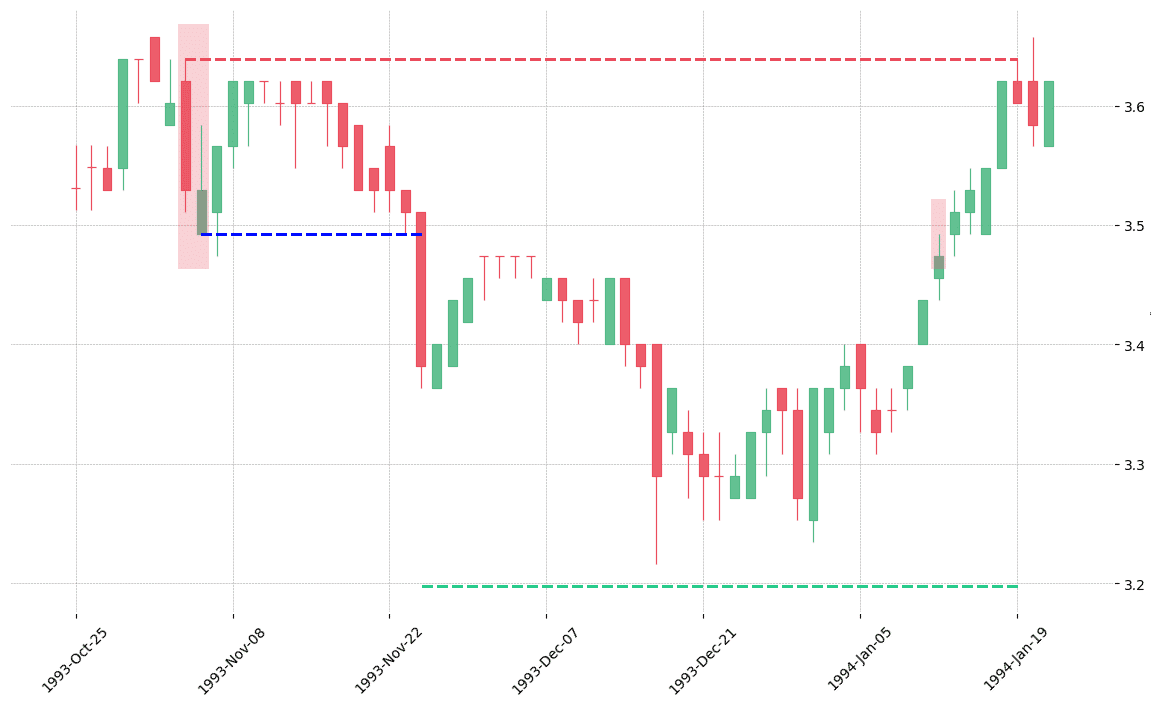
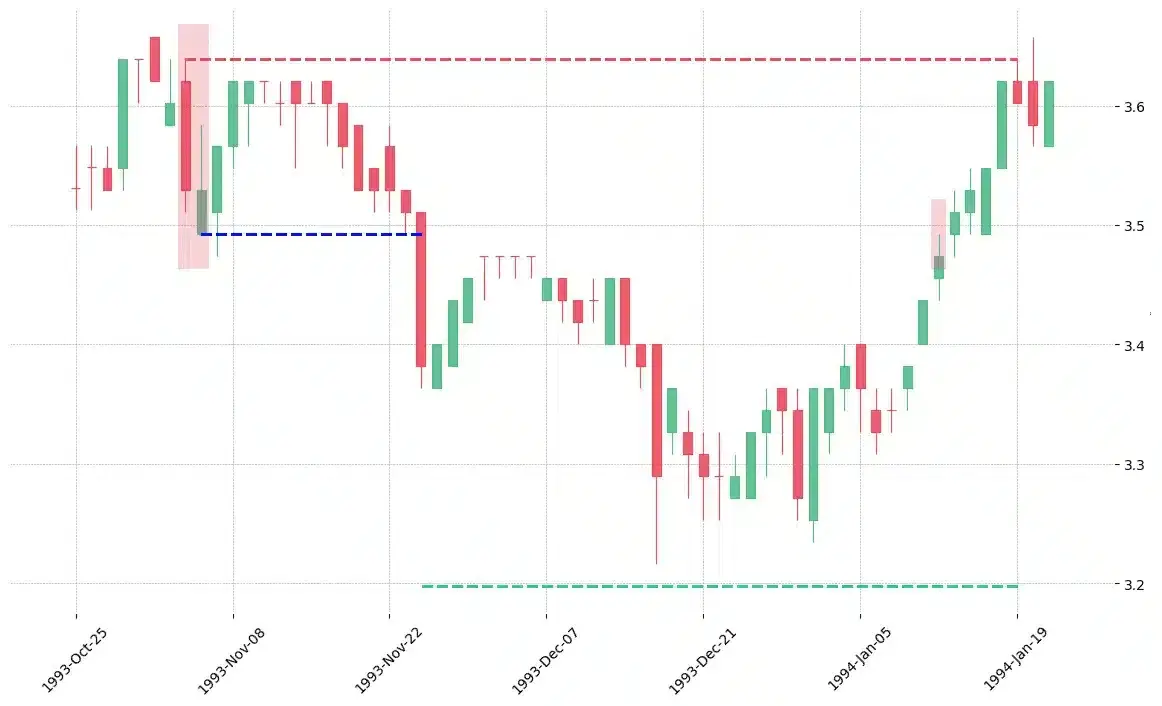
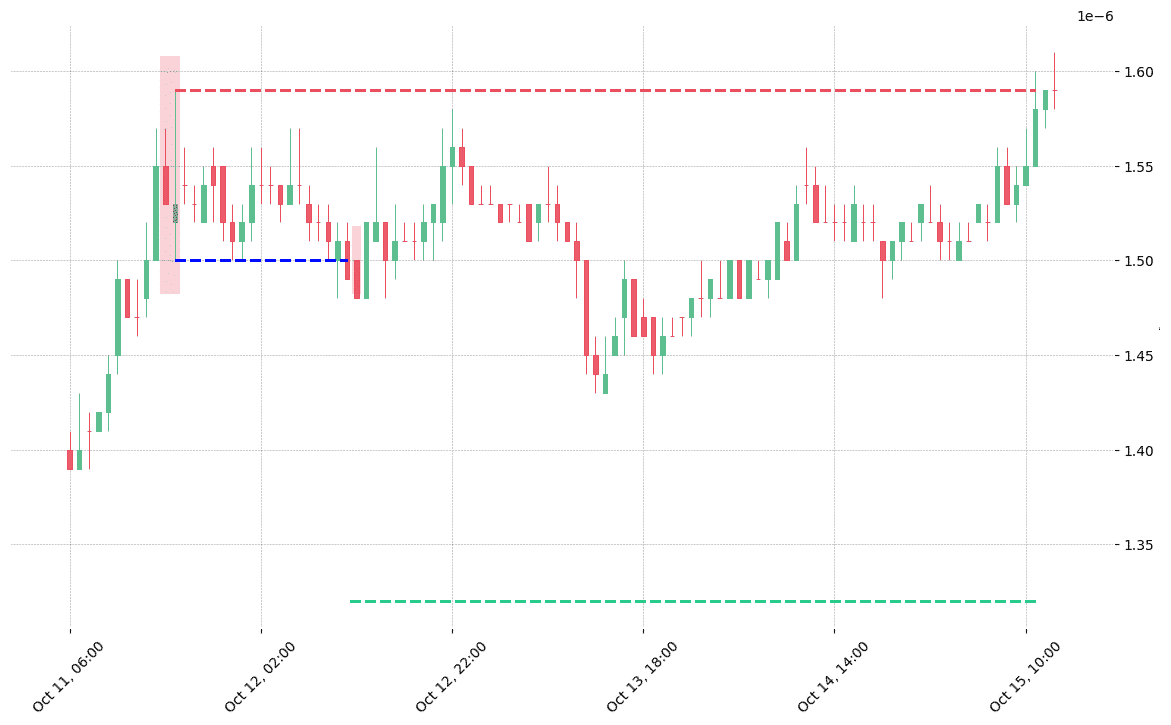
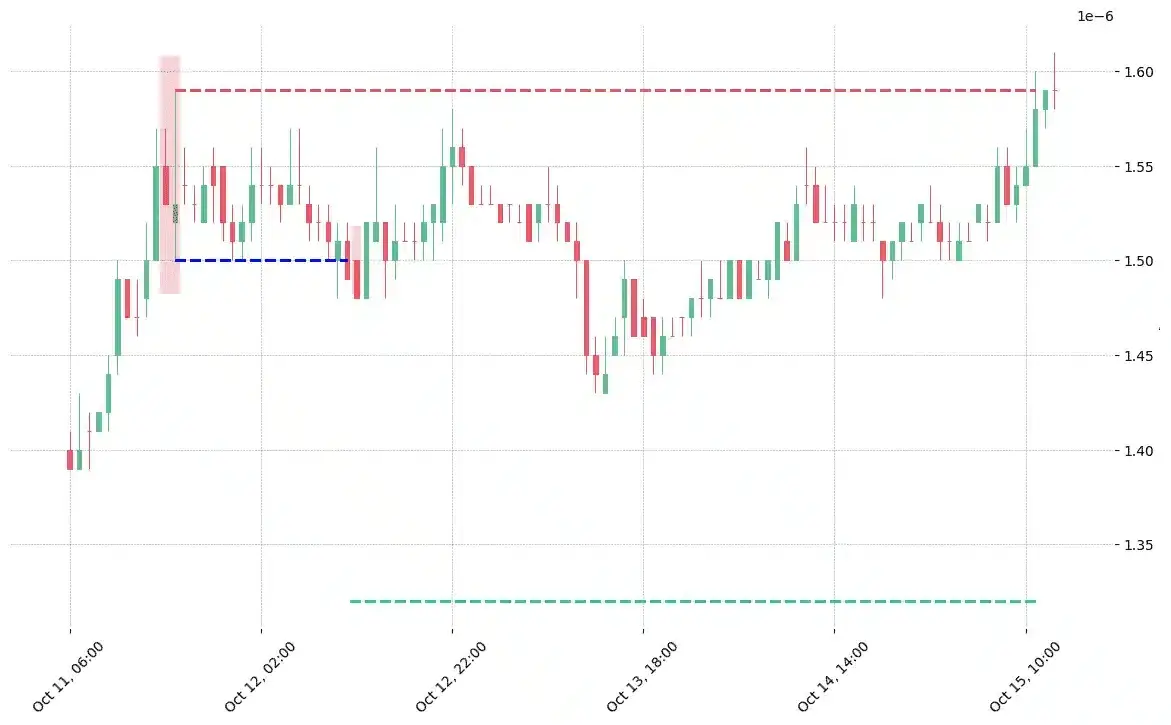
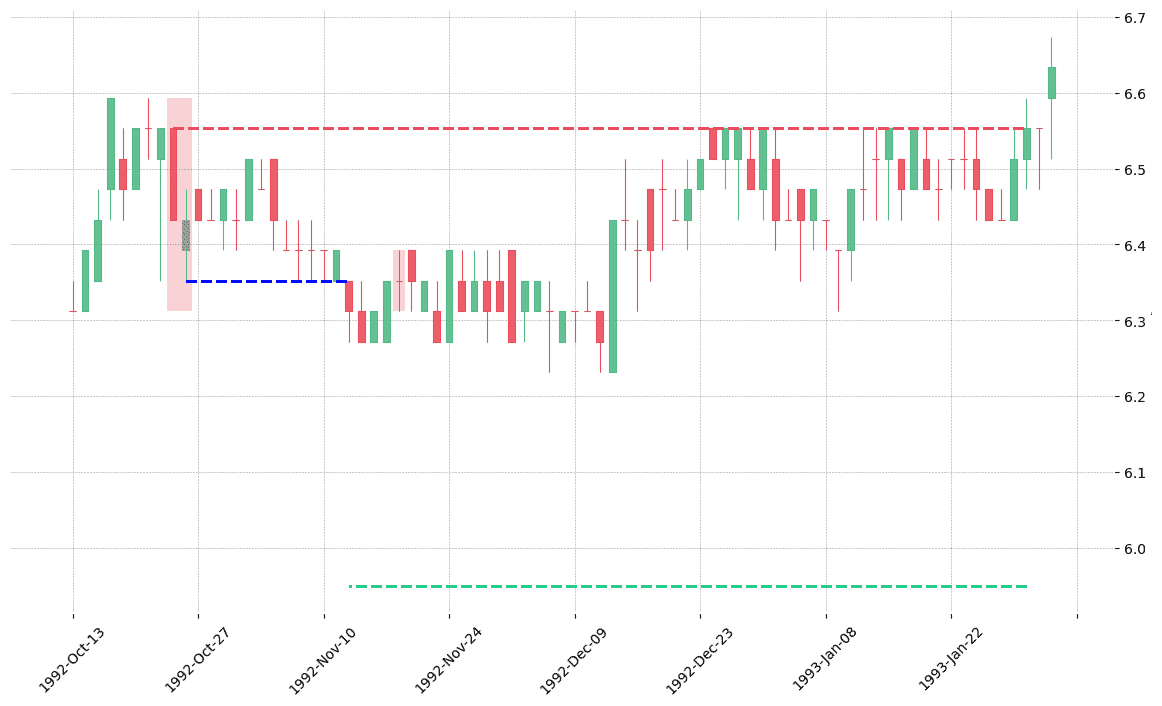
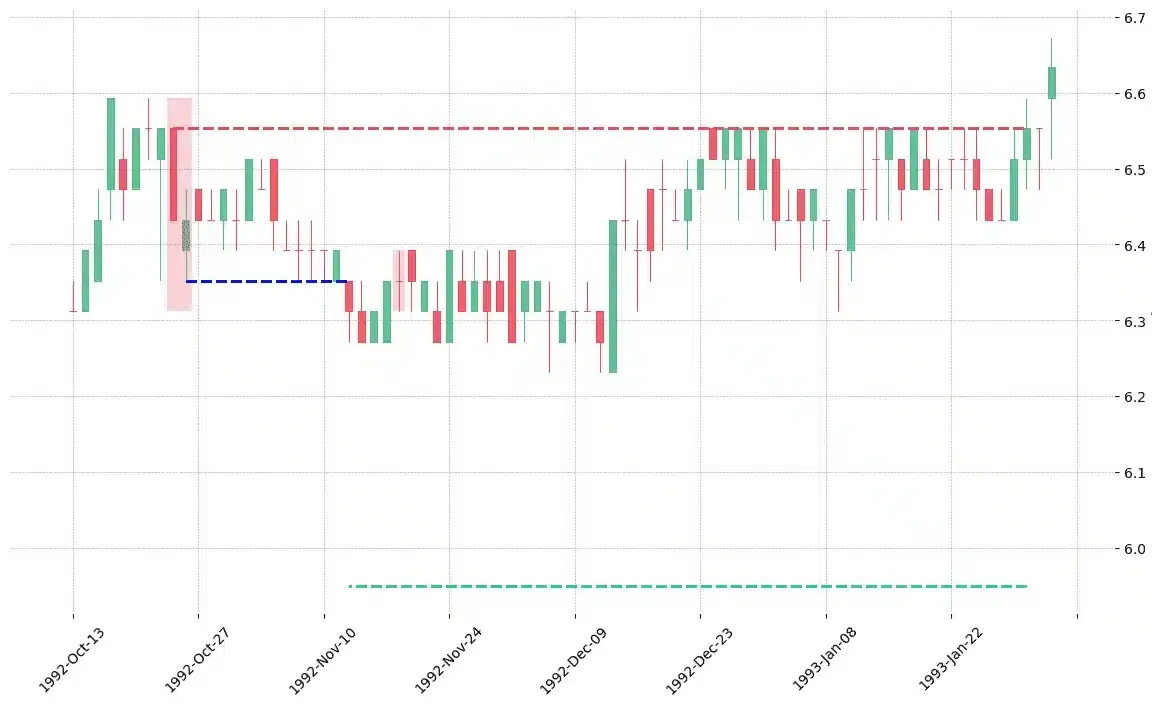
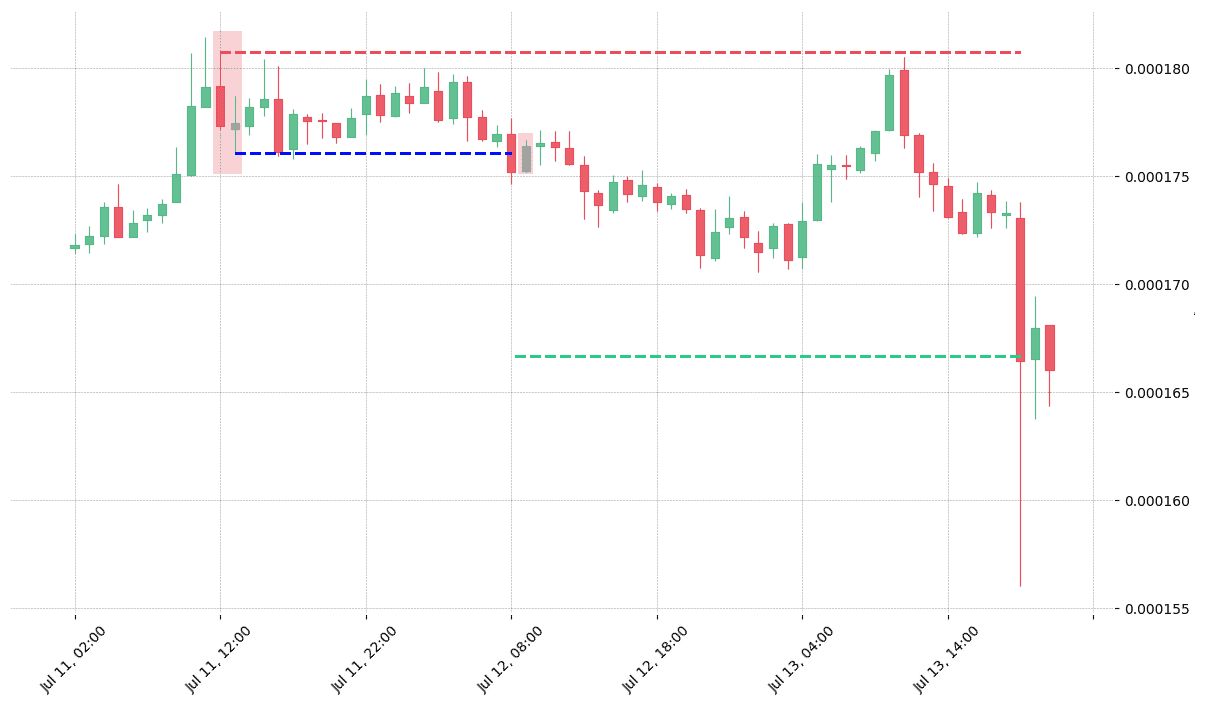
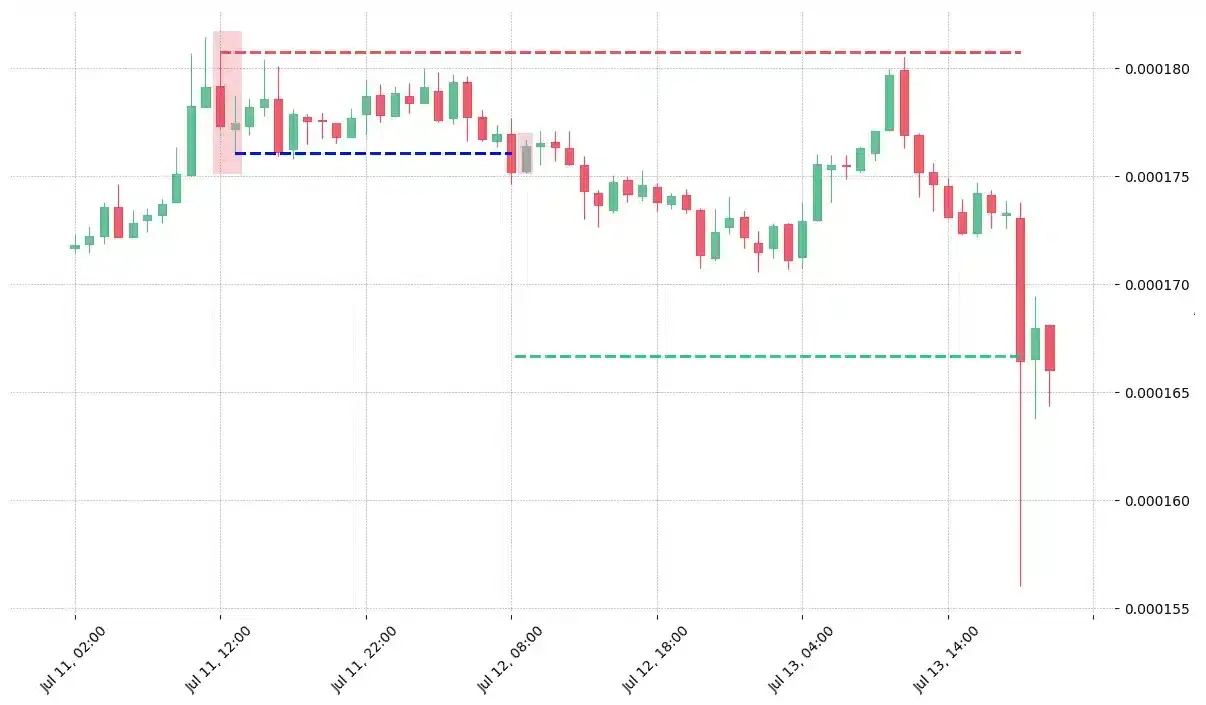
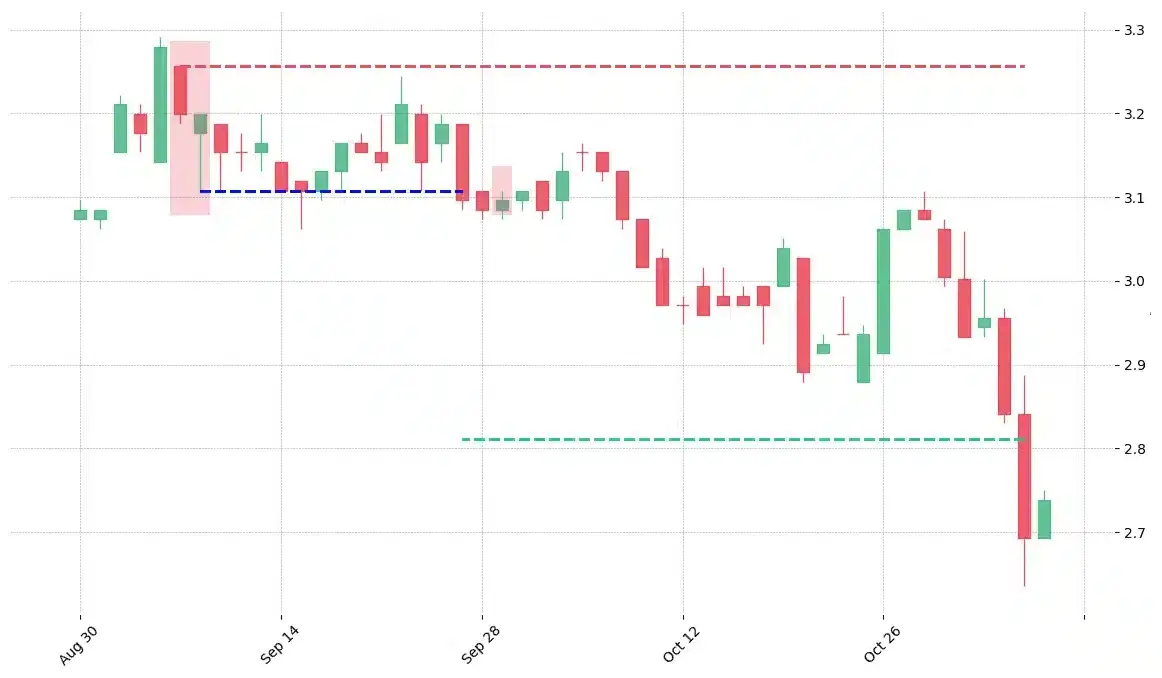
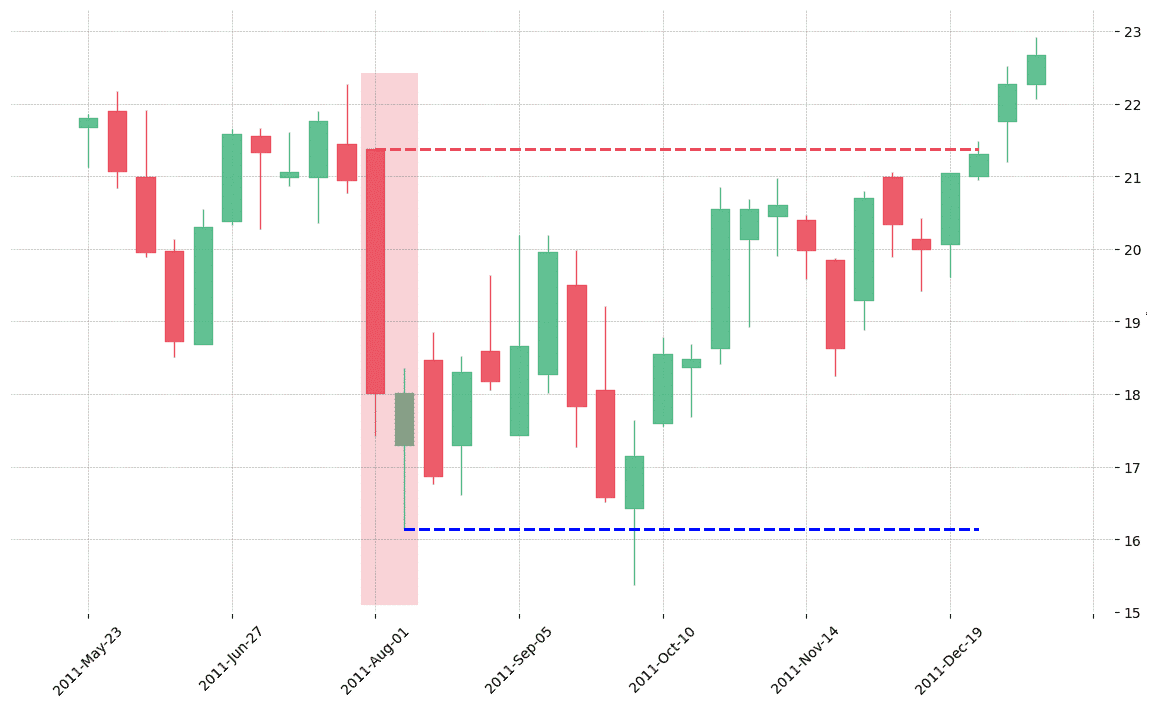
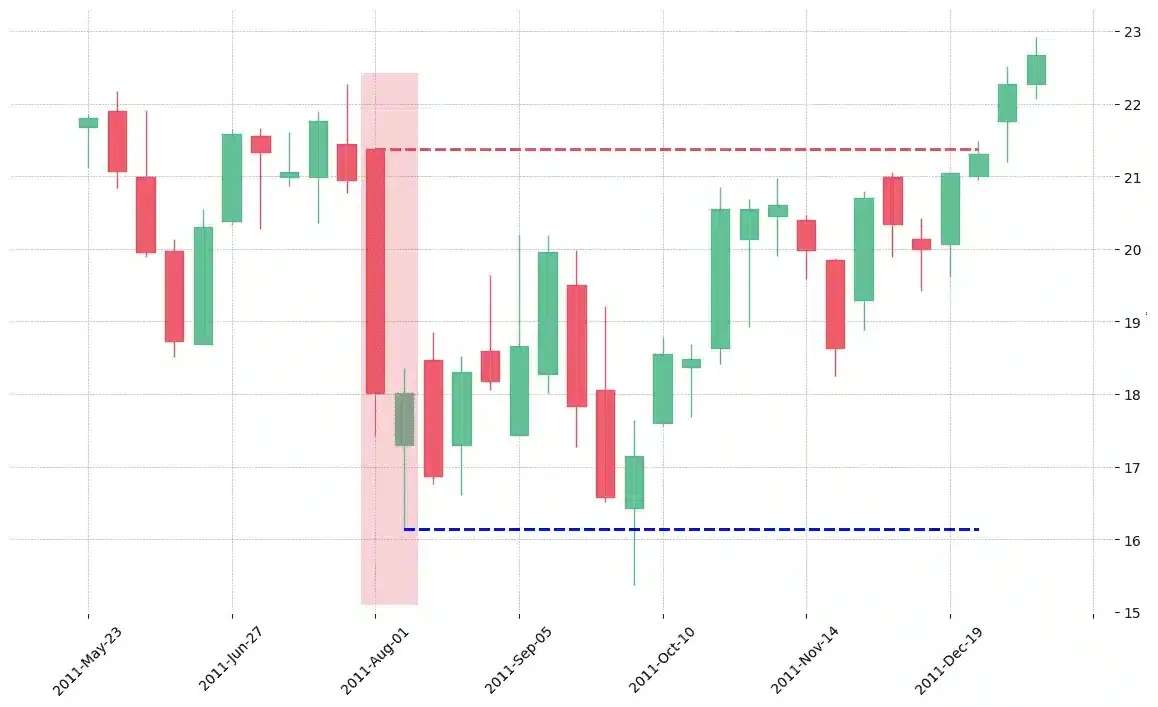
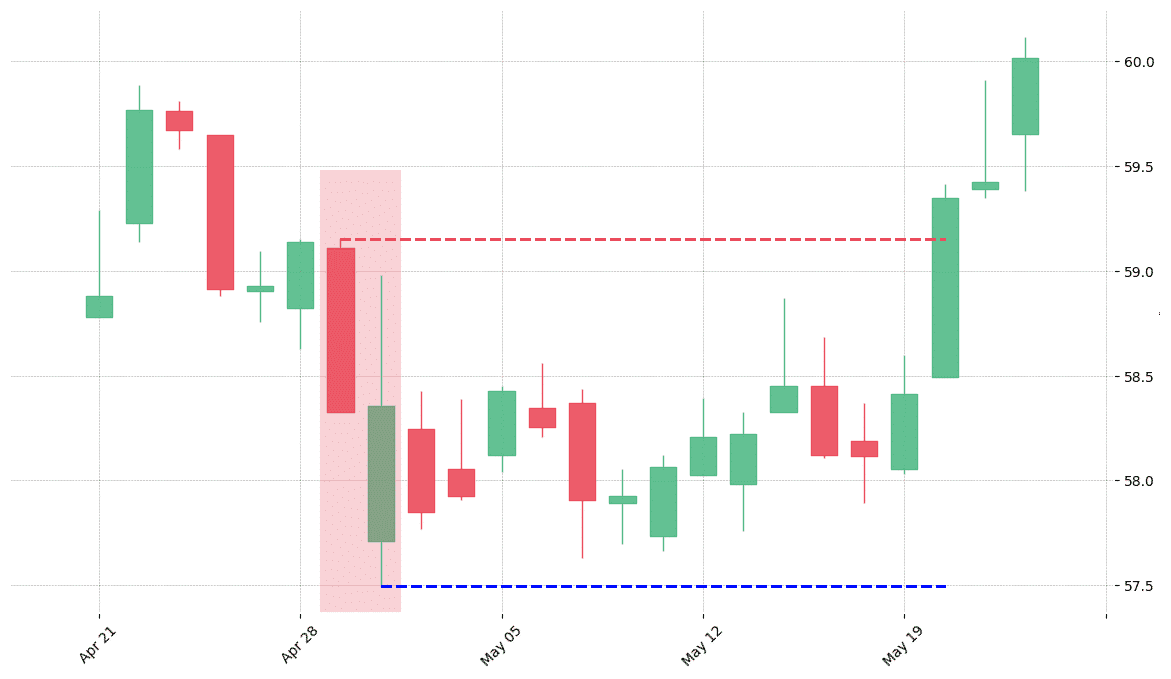
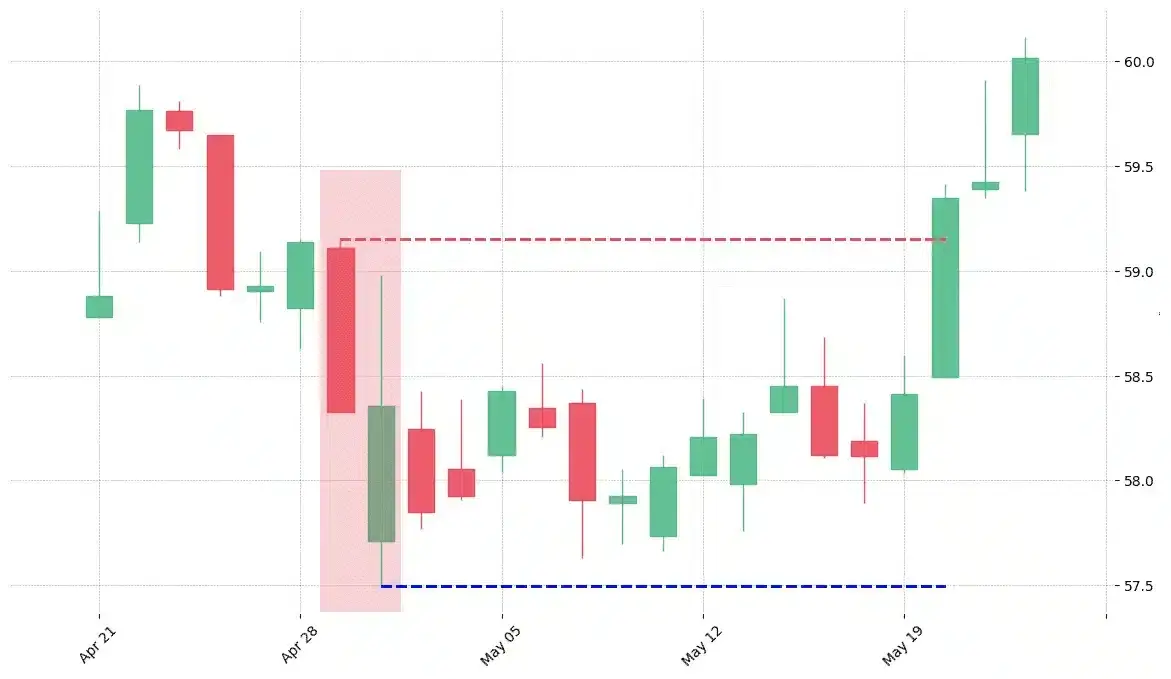
How does the pattern look in real life?

Looking to learn more about this pattern?
You should take a look at Joe Marwood's online course. In his course, he backtested the 26 main candlestick patterns before to summarize which one is THE best pattern. I really liked his course and you shouldn't miss it!
Click here to signup to his "Candlestick Analysis For Professional Traders" course now!


 We loved Marwood Research’s course “Candlestick Analysis For Professional Traders“. Do you want to follow a great video course and deep dive into 26 candlestick patterns (and compare their success rates)? Then make sure to check this course!