
 Good Trading requires the Best Charting Tool!
- A stick sandwich is a 3-bar pattern.
- The closing prices of the two candlesticks that surround the opposite colored candlestick have to be the same.
Statistics to prove if the Stick Sandwich pattern really works
Are the odds of the Stick Sandwich pattern in your favor?
How does the Stick Sandwich behave with a 2:1 target R/R ratio?
From our research the Stick Sandwich pattern confirms 37% of the time on average overall all the 4120 markets we analysed. Historically, this patterns confirmed within 3.9 candles or got invalidated within 3 candles. If confirmed, it reached the 2:1 R/R target 42.4% of the time and it retested it's entry price level 87.7% of the time.
Not accounting for fees, it has an expected outcome of 0.273 $/$.
It means for every $100 you risk on a trade with the Stick Sandwich pattern you make $27.3 on average.
Want to account for your trading fees? Have the detailled stats for your favorite markets / timeframes? Or get the stats for another R/R than 2:1?
🚀 Join us now and get fine-tuned stats you care about!
How to handle risk with the Stick Sandwich pattern?
We analysed 4120 markets for the last 59 years and we found 8 575 occurrences of the Stick Sandwich pattern.
On average markets printed 1 Stick Sandwich pattern every 1 819 candles.
For 2:1 R/R trades, the longest winning streak observed was 14 and the longest losing streak was 15. A trading strategy relying solely on this pattern is not advised. Anyway, make sure to use proper risk management.
Keep in mind all these informations are for educational purposes only and are NOT financial advice.
If you want to learn more and deep dive into candlestick patterns performance statistics, I strongly recommend you follow the best available course about it. Joe Marwood (who's a famous trader with more than 45 000 Twitter followers) created an online course called "Candlestick Analysis For Professional Traders" in his Marwood Research University. There he will take you through the extensive backtesting of the 26 main candlestick patterns. He then summarizes which one is THE best pattern. Do you know which one it is?
Remember, don't trade if you don't know your stats. Click here to signup to the course now!
What is the Stick Sandwich candlestick pattern?
A stick sandwich is a technical trading candlestick pattern where three candlesticks appear that resemble a sandwich on the screen of a trader. The closing prices of the two candlesticks that surround the opposite colored candlestick have to be the same.
With this candlestick pattern, the middle candlestick has the opposite color to the candlesticks on either side. Both will have a larger trading range than the middle candlestick. Stick sandwich candlesticks can appear in both bearish and bullish markets.
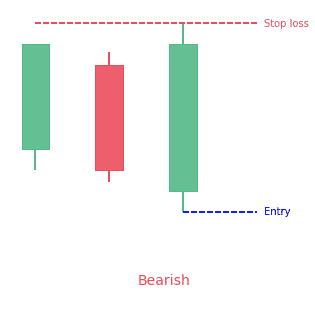
Bearish Stick Sandwich
The bearish stick sandwich is rare. The first pattern to form is a long white (or green) candlestick that ends close to its high. The second candlestick to form will be a black (or red) candlestick that gaps down from the initial close. It closes lower than the open of the previous day.
The third candlestick will be a white (or green) candlestick that covers the second candlestick. It will have the same closing price as the first candlestick. Traders need to wait for the low of the third candlestick to break before taking any short positions.
Confirmation
Bearish stick sandwich patterns can form with one or more candlesticks. Most of them need bearish confirmations. The real reversal shows that selling pressure overshadowed the buying pressure for one or more days. However, it is not clear whether or not sustained selling or lack of buyers will continue to drive prices lower.
Without confirmation, a lot of patterns would be neutral and barely show potential resistance levels. Bearish confirmation indicates more downside follow-through, like a gap down, long black candlestick, or high volume decrease. Since patterns are short-term and effective for 1-2 weeks, bearish confirmation should happen within 1-3 days.
Existing uptrend
For a bearish reversal to form there has to be an existing uptrend to reverse. It doesn’t have to be a big uptrend, but should be up for some time. A dark cloud cover after a sharp decrease will probably be a valid bearish reversal pattern.
Bearish patterns within a downtrend would confirm existing selling pressure and could are continuation patterns. There are a lot of methods traders use to determine the trend. Trend lines, moving averages, or peak/trough analysis can form an uptrend. A commodity is in an uptrend based on one or more of these:
- The security is trading higher than its 20-day exponential moving average (EMA)
- Every reaction peak and trough is above the previous
- The security is trading higher than a trend line
Some investors may prefer shorter uptrends and qualify securities that are trading higher than their 10-day EMA. Defining depends on individual trading style, time horizon, and personal preferences.
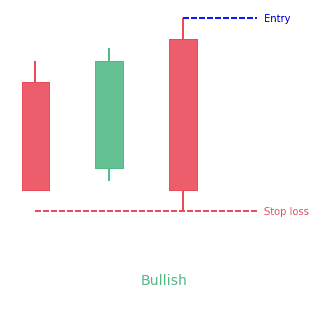
Bullish Stick Sandwich
This candlestick pattern has two black bodies with a white body between them. That is why it resembles a sandwich. The closing of both black candlesticks at the same level indicates that a support price has formed.
Recognition criteria
- The market has a prevailing downtrend
- A black candlestick appears on the first day
- A white body that trades above the close of the previous black body follows
- The third day is a black day with a close same as the first day
Pattern requirements and flexibility
The bullish stick sandwich begins with a strong black candlestick and a white candlestick that opens at the initial close. The white body ends above the black body of the first day. The third day starts with an upside gap but closes at the same level as the close of the first day.
Behavior of traders
The market tests new lows and makes a black day. The following day unexpectedly opens higher and trades higher all day, closing at or close to its high. This action means that the downtrend has reversed and that short traders should take caution.
The next day, prices open even higher and cause some short-covering initially. However, the prices drift lower to close at the same price as two days ago. Investors need to take note of the support price created by the two same level closes.
Buy/Stop-loss levels
The confirmation level is the midpoint between the last two closes. Prices need to cross higher than this level for confirmation.
The stop-loss level is the lower of the last two lows. After the buy, a stop-loss forms if prices decline rather than increase. Also if they close or make two daily lows, while no bearish pattern forms.
How to identify the Stick Sandwich candlestick pattern?
Detecting a stick sandwich candlestick pattern is not too difficult. However, traders need to know the basic criteria before successfully working with the signal. So, before digging into this sandwich, observe for these details:
- First, there have to be three candles in a row.
- Second, the middle candle has to be the opposite color of the candles on either side of it. A bearish sandwich will be green-red-green and a bullish sandwich have a red-green-red color.
- Third, the candles on each side will have bigger trading ranges. This will make them longer than the candle in the middle.
- Fourth, the middle candle will be shorter. The candles on each side of it will engulf it.
- Lastly, the bullish stick sandwich has to form during a downtrend while the bearish stick sandwich has to form during an uptrend.
Since the stick sandwich can form in both bearish and bullish markets, traders need to remember the colors involved. Once you know if the pattern is bearish or bullish, you can advance.
In a bullish market, the bulls are in control until the second candle gets into the picture. This candlestick shows that the dominance of the bulls may be ending. The opposite is true for a bearish market.
Since the two candles have equal closing prices, there’s a high chance of a reversal. Since both candlesticks have closed at the same level, this shows that there’s a support price.
What does the Stick Sandwich candlestick pattern tell traders?
Just like a bar chart, a daily candlestick indicates the market’s open, high, low, and close price for the day. The candlestick has a wide part, which is the real body. This real body shows the price range between the open and close of the trading of that day.
When the real body is black, it indicates the close was lower than the open. If the real body is empty, it indicates the close was higher than the open.
Even though detecting a stick sandwich pattern is not very hard, traders have to be careful to take note of the colors. Basic criteria include accounting for the color of candlesticks on both sides. It also includes the color of the candlestick sandwiched in the middle.
The rationale behind this candlestick approach is that when the market is testing new lows, it will make a red day. The next day will unexpectedly open higher and will trend higher all day, closing at or close to its high.
How to trade when you see the Stick Sandwich candlestick pattern?
Placing a stop loss
No matter how good a trader is, at some point, the market will take you for a ride if you relax. Traders should place the stop-loss right below the low of the bullish candlestick pattern and the high of the bearish candlestick pattern.
Taking profits
The suggested price target for the stick sandwich pattern is three times the size of the pattern formation.
Conclusion
The stick sandwich candle pattern is a rare chart occurrence where two candles sandwich another one. The pattern has a reversal characteristic and is a rare chart occurrence. When trading a sandwich candle pattern, pursue a minimum profit equal to three times the size of the formation.
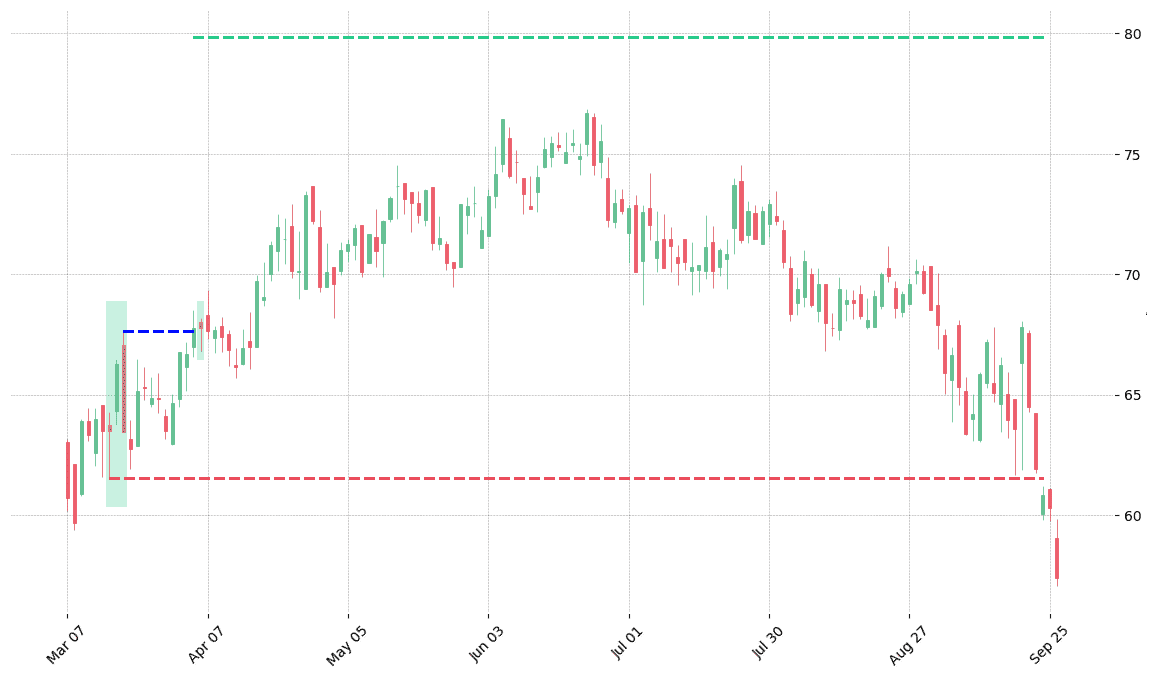
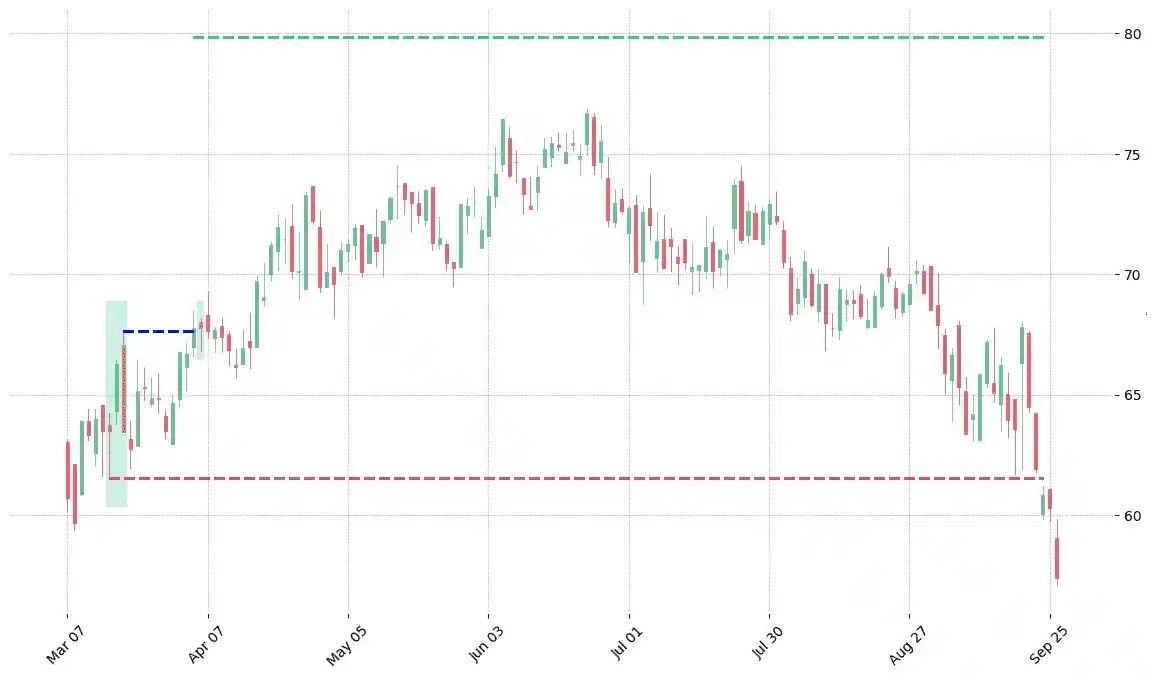
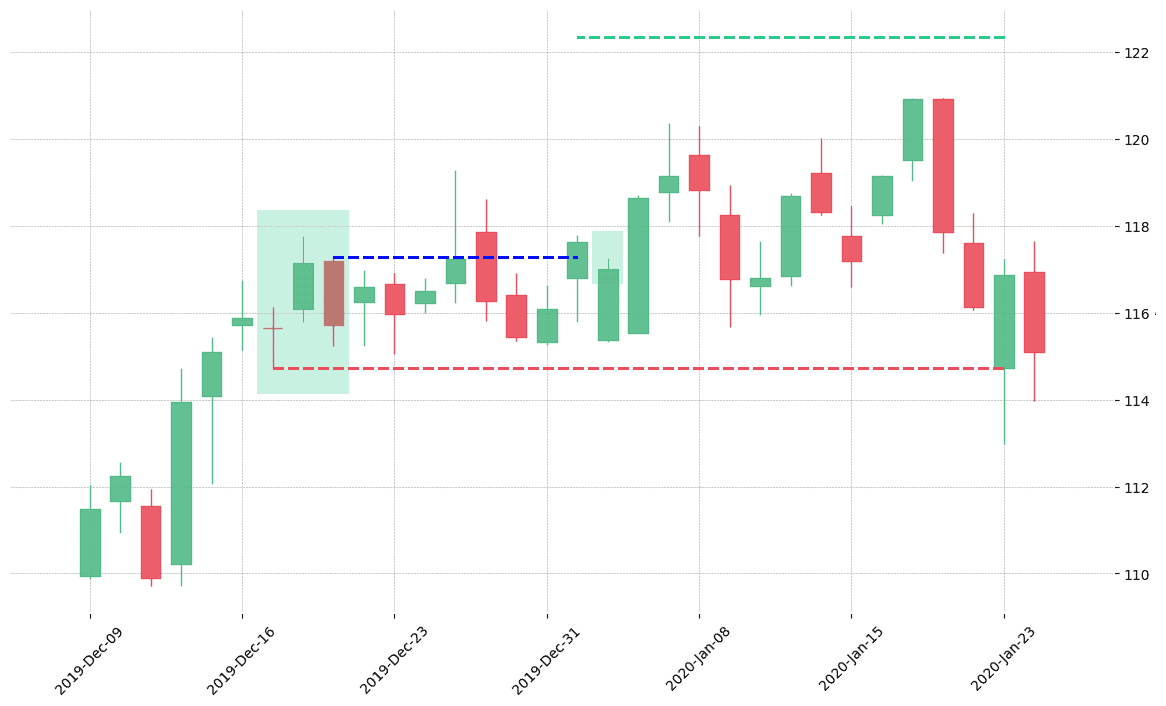
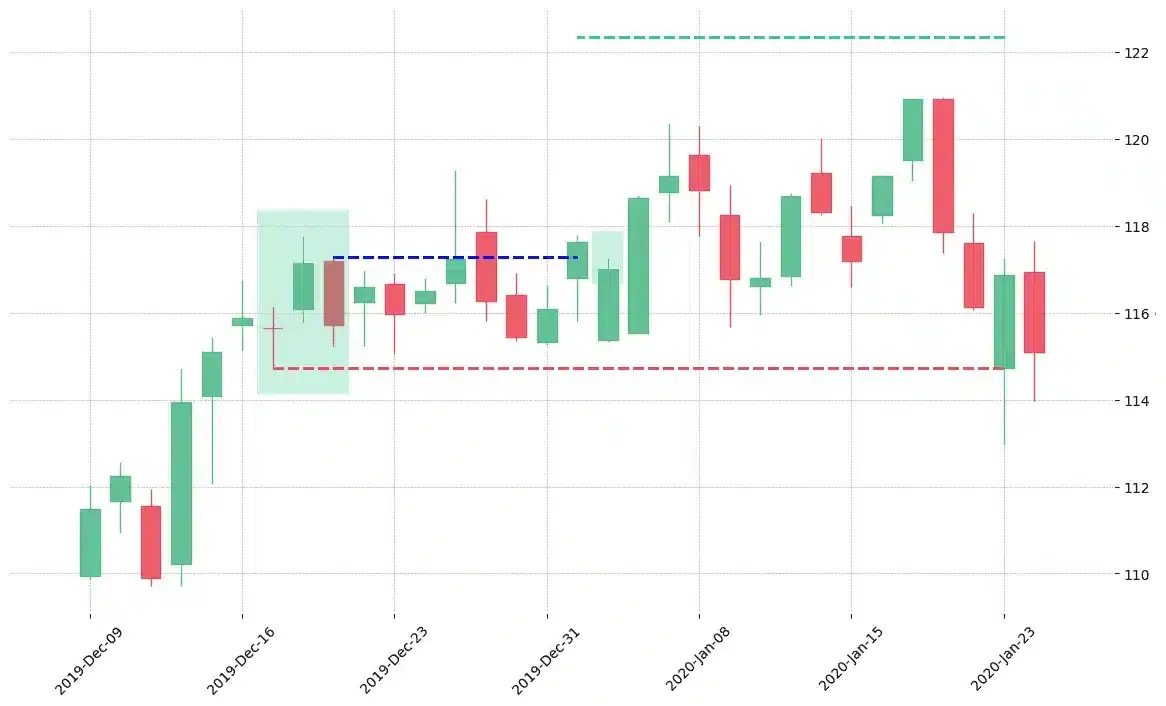
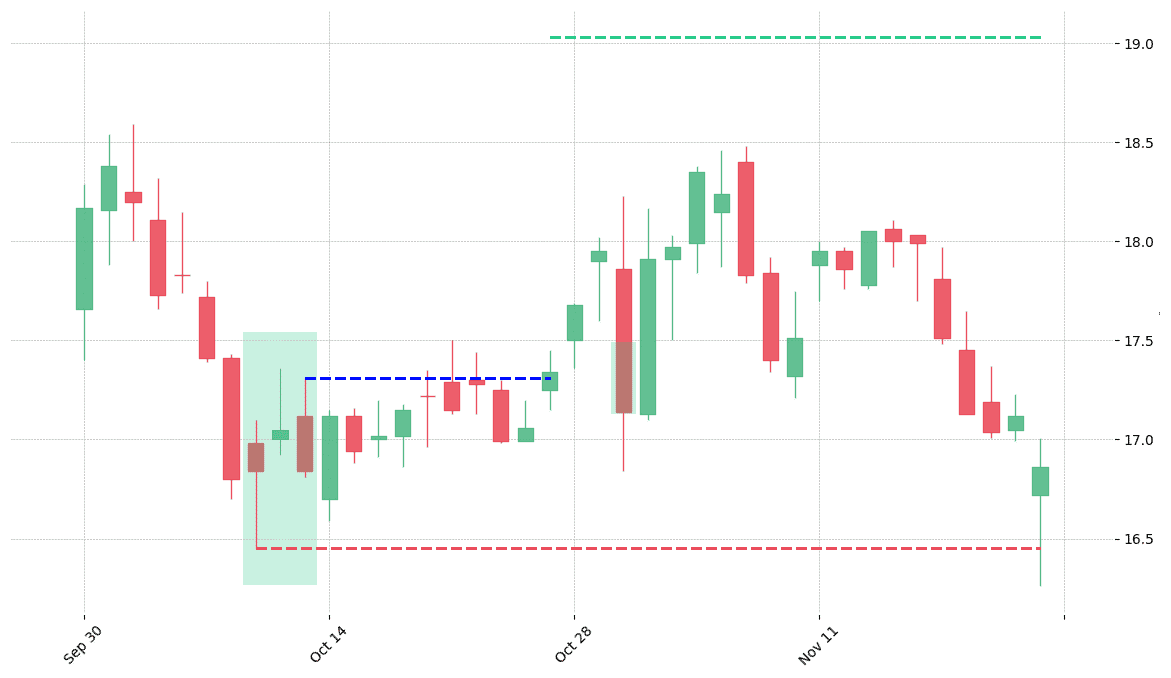
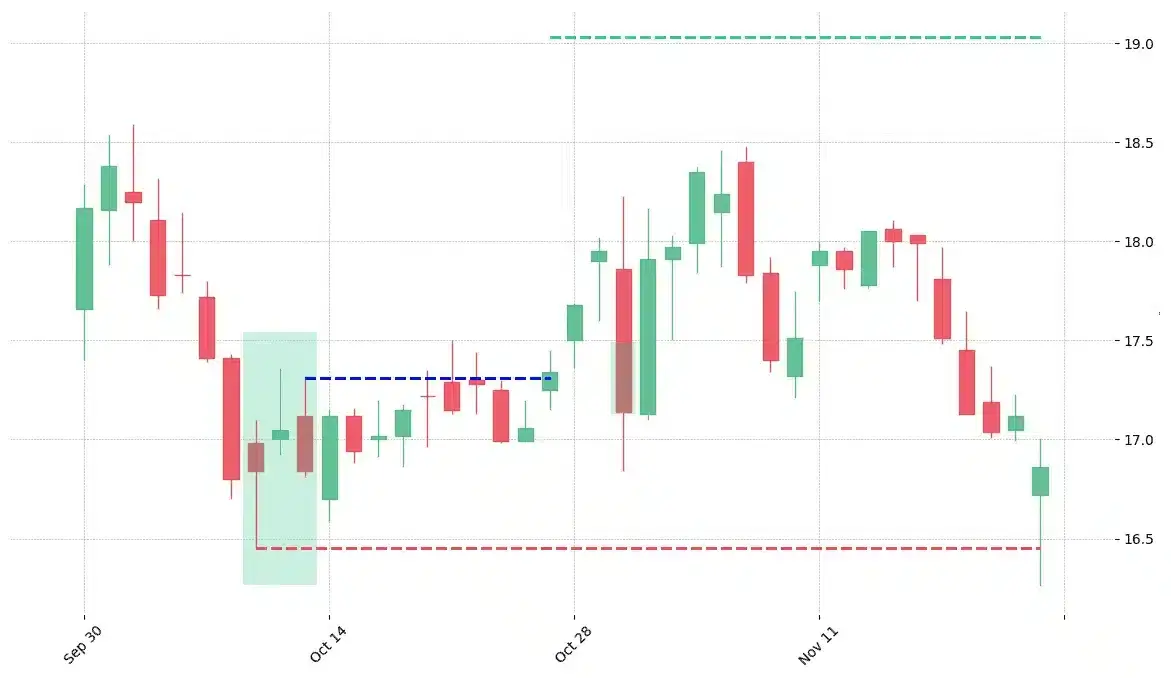
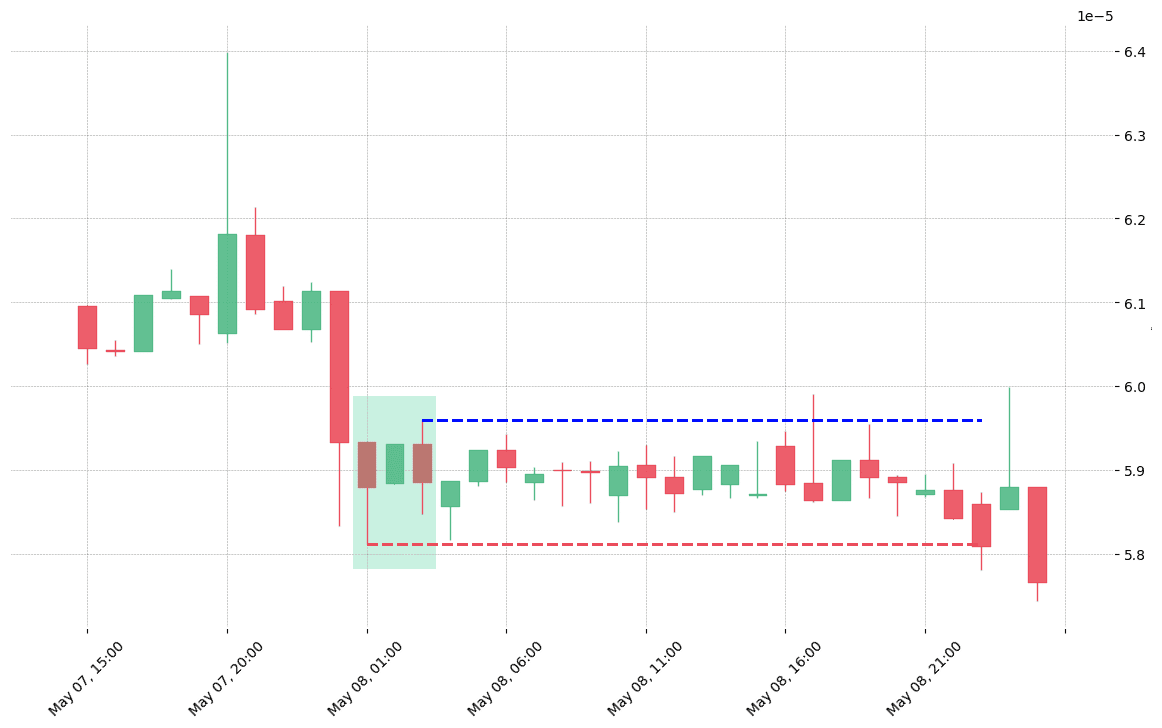
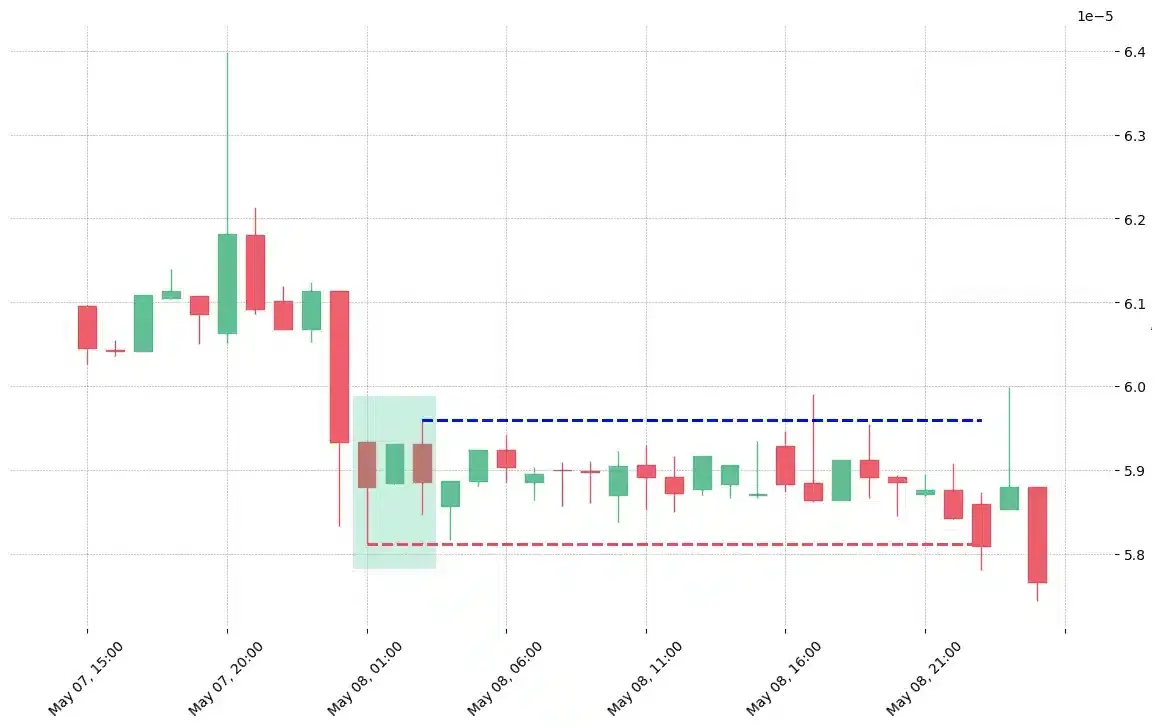
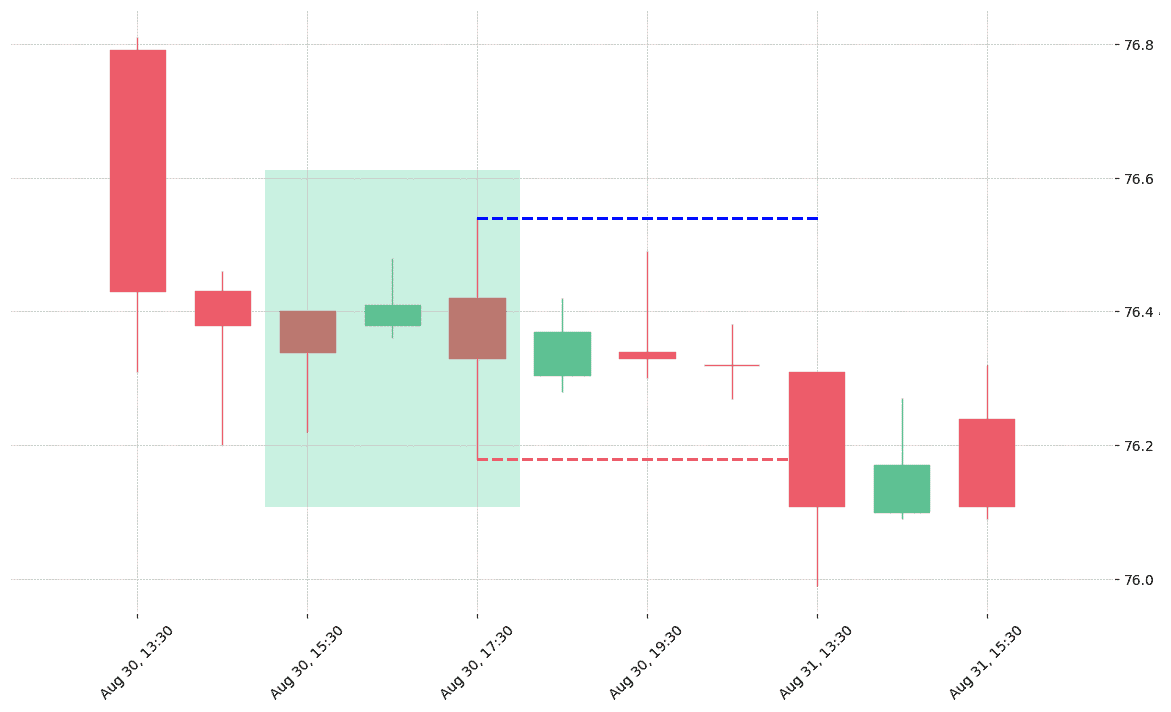
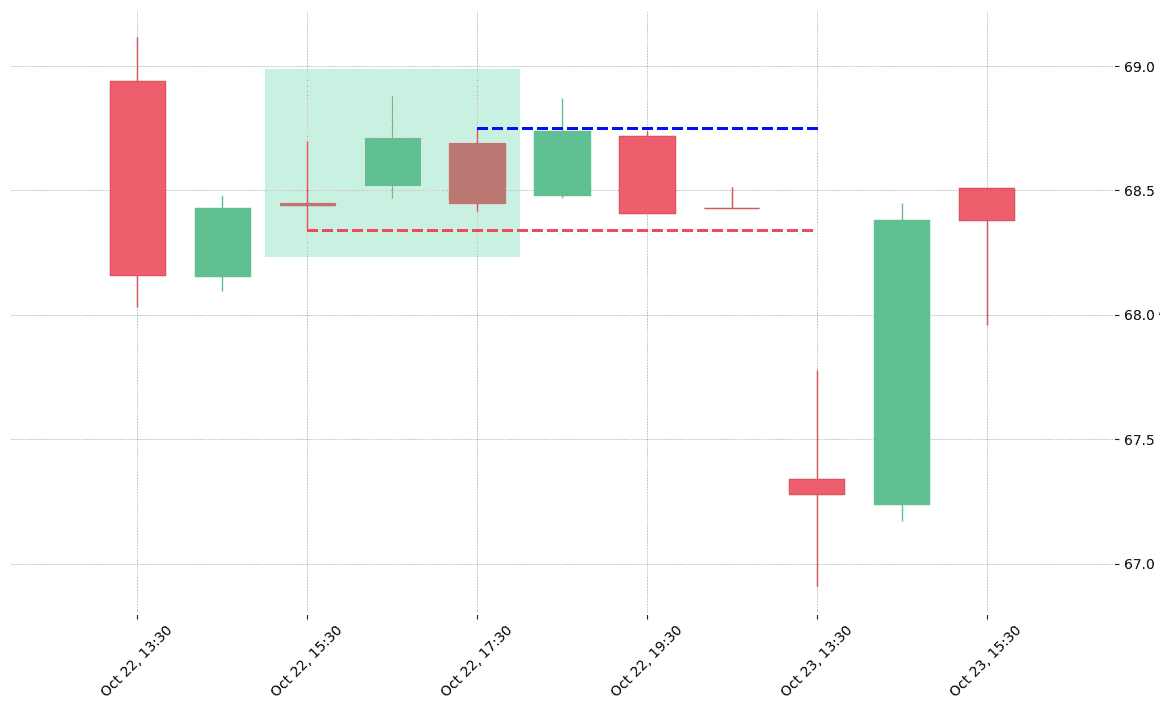
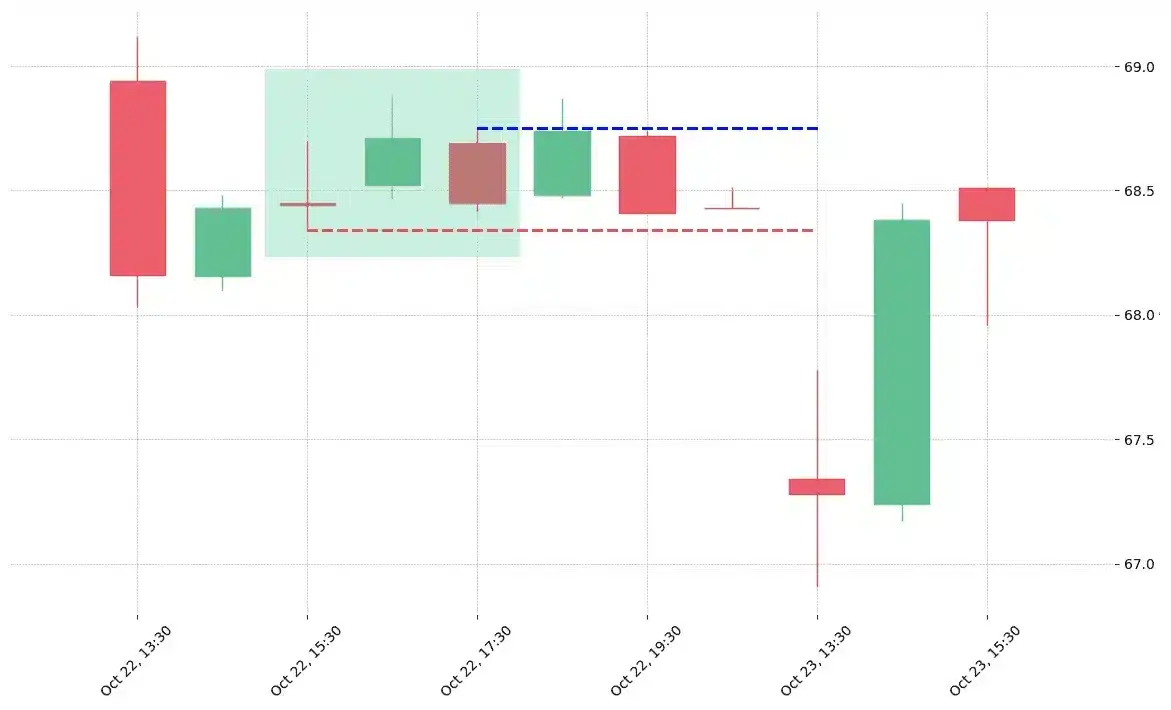
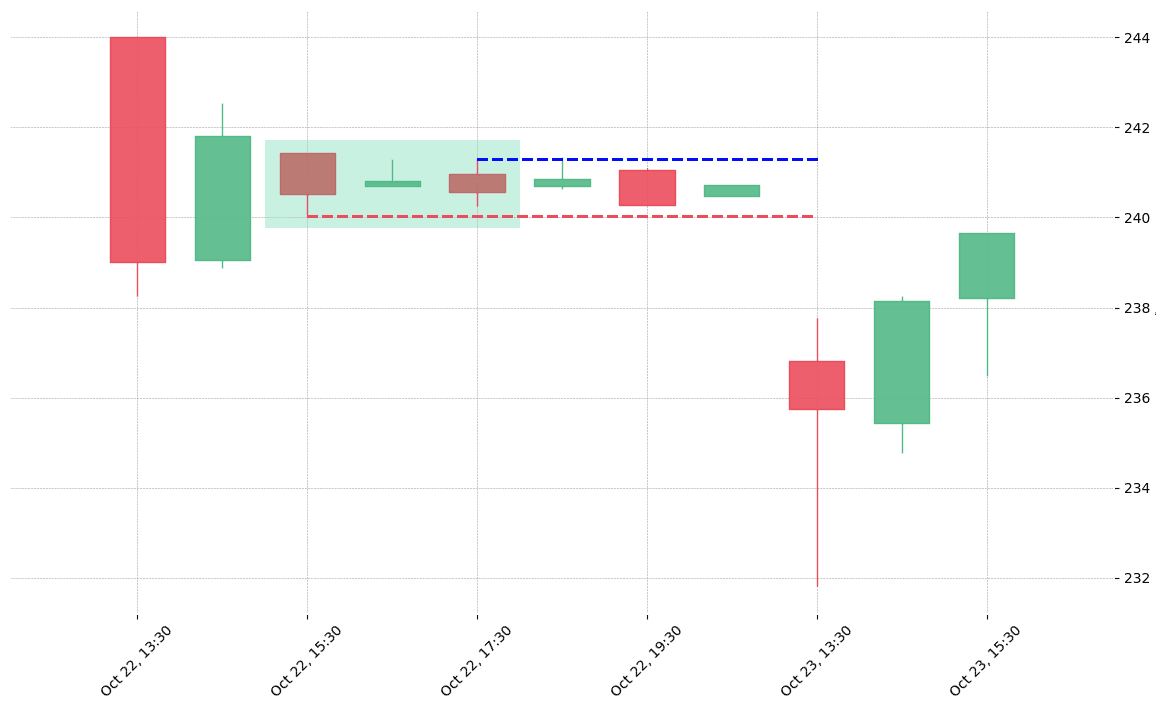
How does the Stick Sandwich pattern look in real life?


Looking to learn more about this pattern?
You should take a look at Joe Marwood's online course. In his course, he backtested the 26 main candlestick patterns before to summarize which one is THE best pattern. I really liked his course and you shouldn't miss it!
Click here to signup to his "Candlestick Analysis For Professional Traders" course now!


 We loved Marwood Research’s course “Candlestick Analysis For Professional Traders“. Do you want to follow a great video course and deep dive into 26 candlestick patterns (and compare their success rates)? Then make sure to check this course!