Unique Three River Candlestick Pattern

Candlestick patterns

unique three river
  • The unique three river bottom candlestick pattern is a bullish reversal pattern.
  • It occurs during a downtrend in the market.

Statistics to prove if the Unique Three River pattern really works

Are the odds of the Unique Three River pattern in your favor?


How does the Unique Three River behave with a 2:1 target R/R ratio?

Success rate

From our research the Unique Three River pattern confirms 61.3% of the time on average overall all the 4120 markets we analysed. Historically, this patterns confirmed within 2.4 candles or got invalidated within 3.8 candles. If confirmed, it reached the 2:1 R/R target 40.2% of the time and it retested it's entry price level 95.2% of the time.
Not accounting for fees, it has an expected outcome of 0.206 $/$. It means for every $100 you risk on a trade with the Unique Three River pattern you make $20.6 on average.
Want to account for your trading fees? Have the detailled stats for your favorite markets / timeframes? Or get the stats for another R/R than 2:1?
🚀 Join us now and get fine-tuned stats you care about!

How to handle risk with the Unique Three River pattern?


We analysed 4120 markets for the last 59 years and we found 5 341 occurrences of the Unique Three River pattern.
On average markets printed 1 Unique Three River pattern every 2 921 candles.

For 2:1 R/R trades, the longest winning streak observed was 9 and the longest losing streak was 12. A trading strategy relying solely on this pattern is not advised. Anyway, make sure to use proper risk management.

Stack the odds in my favor NOW!

Keep in mind all these informations are for educational purposes only and are NOT financial advice.

If you want to learn more and deep dive into candlestick patterns performance statistics, I strongly recommend you follow the best available course about it. Joe Marwood (who's a famous trader with more than 45 000 Twitter followers) created an online course called "Candlestick Analysis For Professional Traders" in his Marwood Research University. There he will take you through the extensive backtesting of the 26 main candlestick patterns. He then summarizes which one is THE best pattern. Do you know which one it is?
Remember, don't trade if you don't know your stats. Click here to signup to the course now!

What is the unique three river candlestick pattern?

The unique three river bottom candlestick pattern is a bullish reversal pattern that occurs during a downtrend in the market. It identifies the turning point at which the bearish sentiment in the market changes. The three unique river can see upcoming oversold market conditions during an overbought market. Although it is a proven bullish reversal pattern, the testing has proved that the prices can move in any direction after the appearance of the unique three river patterns. Therefore, traders and technical analysts should wait for the confirmation candle after the appearance of the unique three river. 

How to identify the unique three river candlestick pattern? 

The unique three river pattern occurs during a strong downtrend in the market. It is among the rarest candlestick patterns. A pattern needs to meet the following conditions to be a unique three river bottom pattern.

  • The first day’s candle must be a long bearish black candle consistent with the current downtrend in the market. 
  • The second candle must be a hammer with a long lower wick setting a new low.
  • The third candle is a white short candle below the real body of the second candle. 
  • The third candle must not go above the high or low of the second candle. 

What does the pattern tell traders? 

The unique three river bottom candlestick pattern is really a unique pattern. It generally is a bullish reversal pattern that predicts an upcoming reversal of the trend. However, testing has also proved that it is not 100% a reversal pattern, and price may go in either direction. 

The appearance of the first long black candle indicates that the market is in complete control of the bears and the market hits the extremely low. The formation of the second hammer candle shows that bulls are trying to take back control of the market. The third candle opens higher than the previous low and has a small white body that illustrates that there are strong chances of market stability and an uptrend. All these hints point towards a bullish reversal in the market. However, there are also chances of bearish continuation. Therefore, it is always a wise decision to wait for the confirmation provided by the fourth candle appearing after the unique three river bottom pattern. 

The unique three river pattern also helps to devise some trading strategies to gain profit. If the prices move higher after the confirmation, traders can go for a long position and set a stop-loss below the second candle’s low. On the other hand, if the prices move low after the confirmation, it indicates a bearish continuation. Now, traders should go for a short position and place stop-loss above the high of the second candle. 

Hence, the unique three river pattern is quite a useful trading pattern that conveys multiple pieces of information. However, it has a limitation that it doesn’t allow traders to set profit targets, so traders need other profit taking methods. 

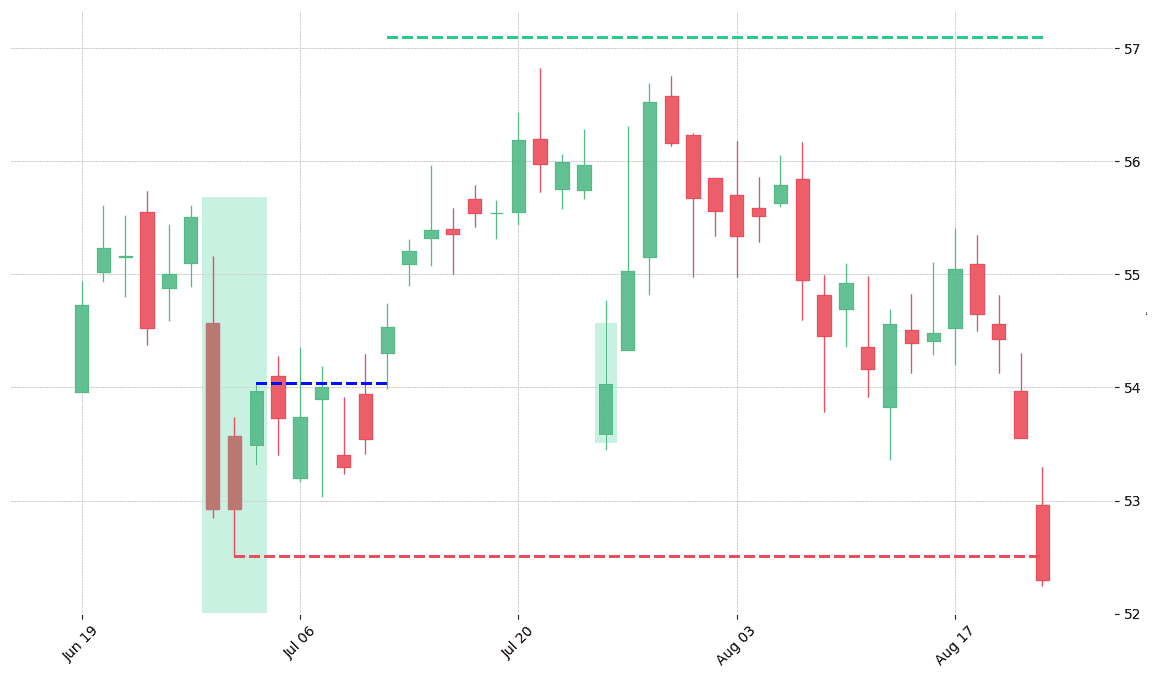
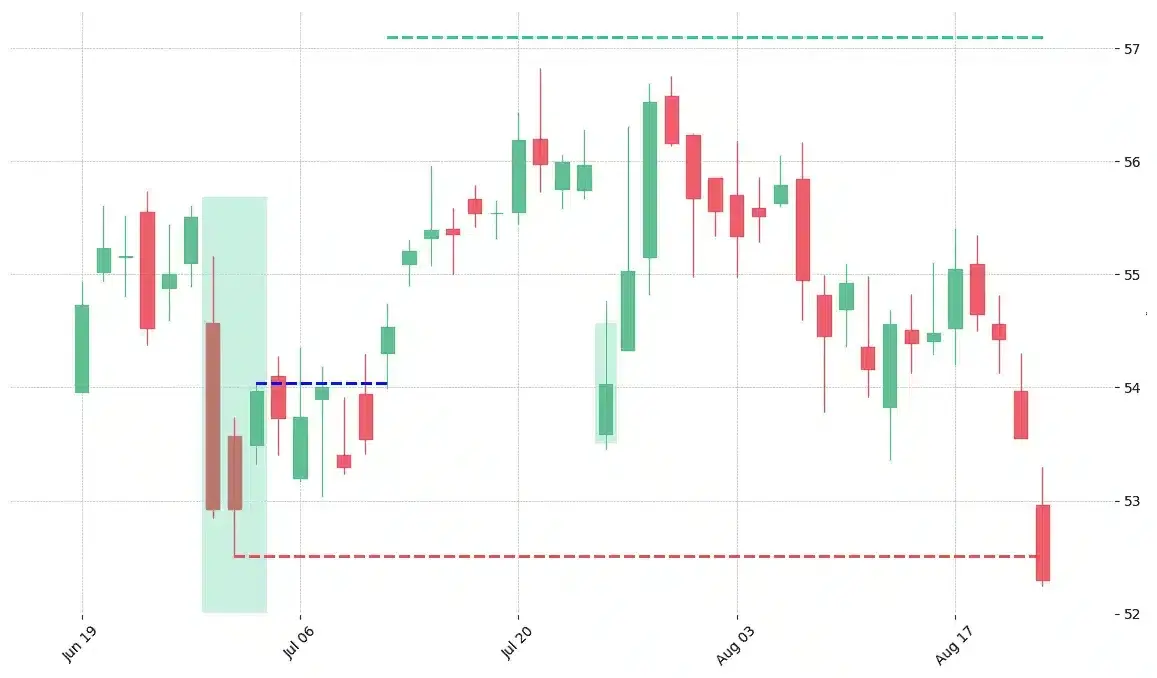
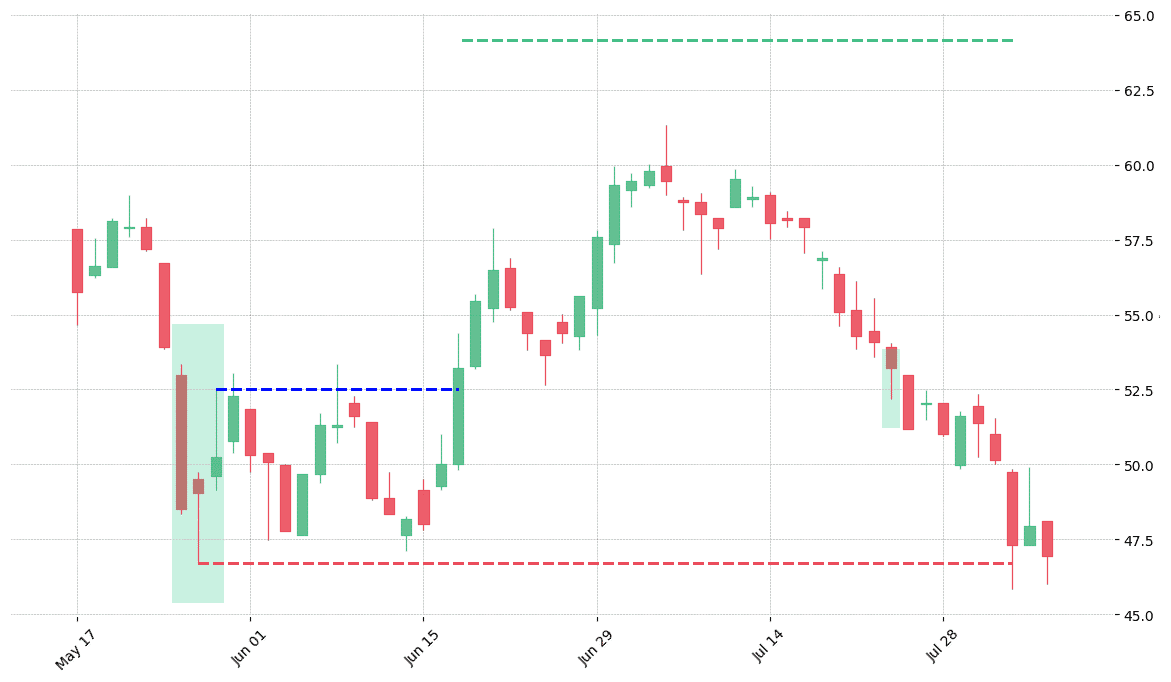
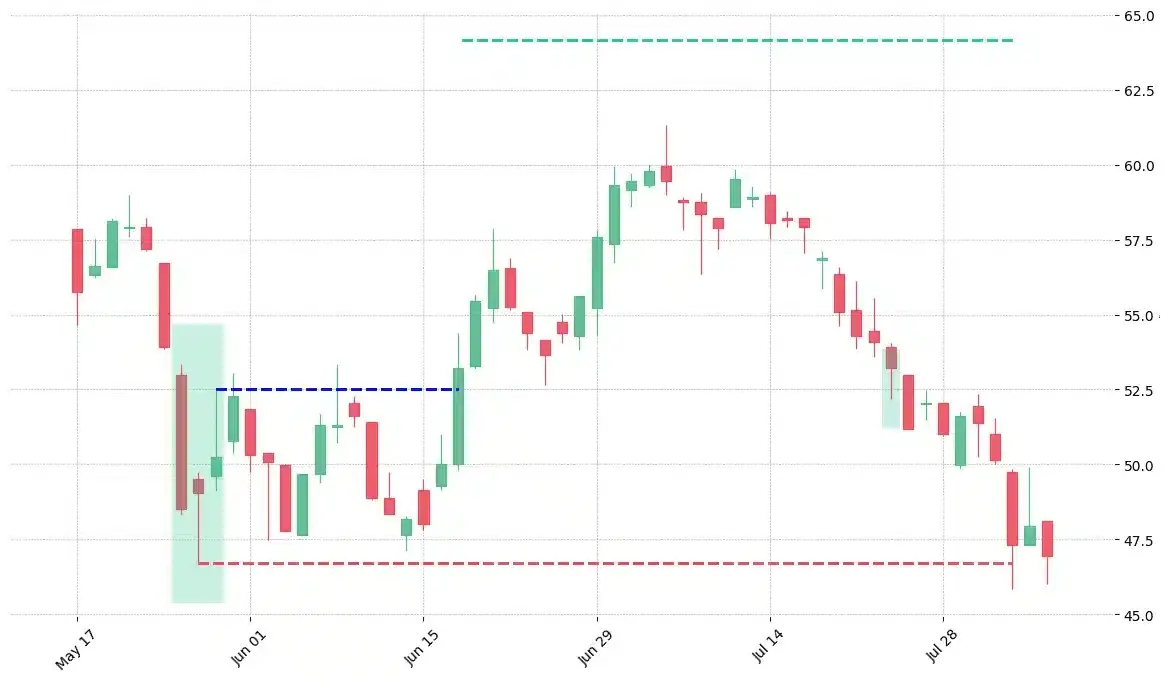
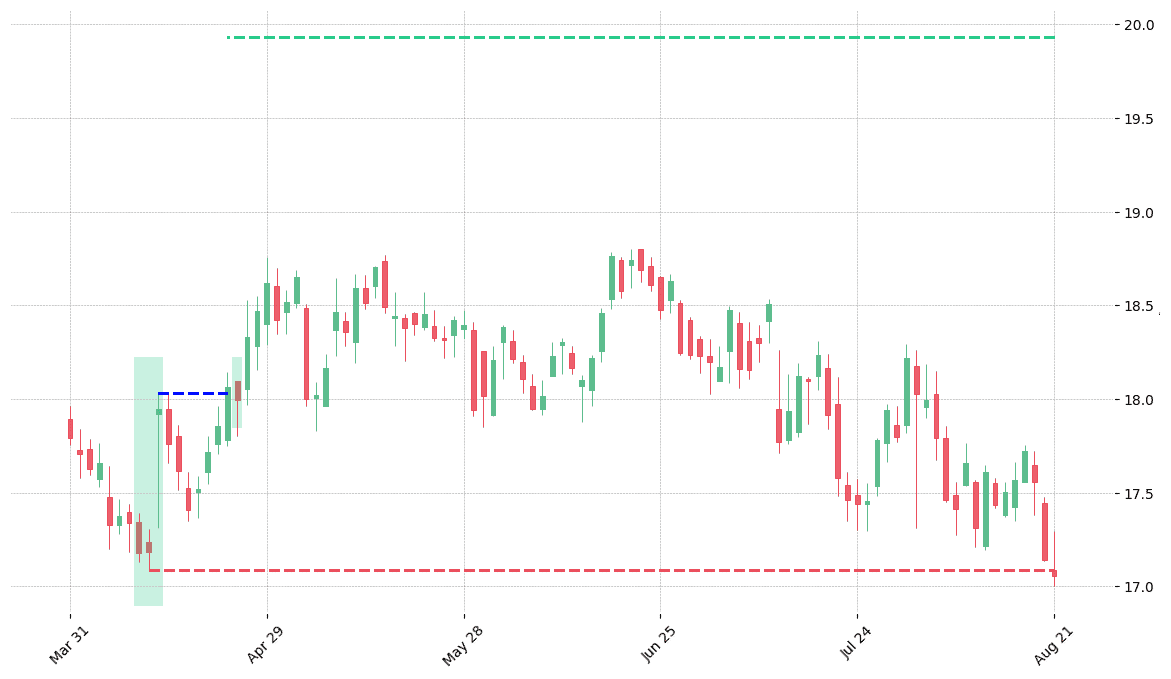
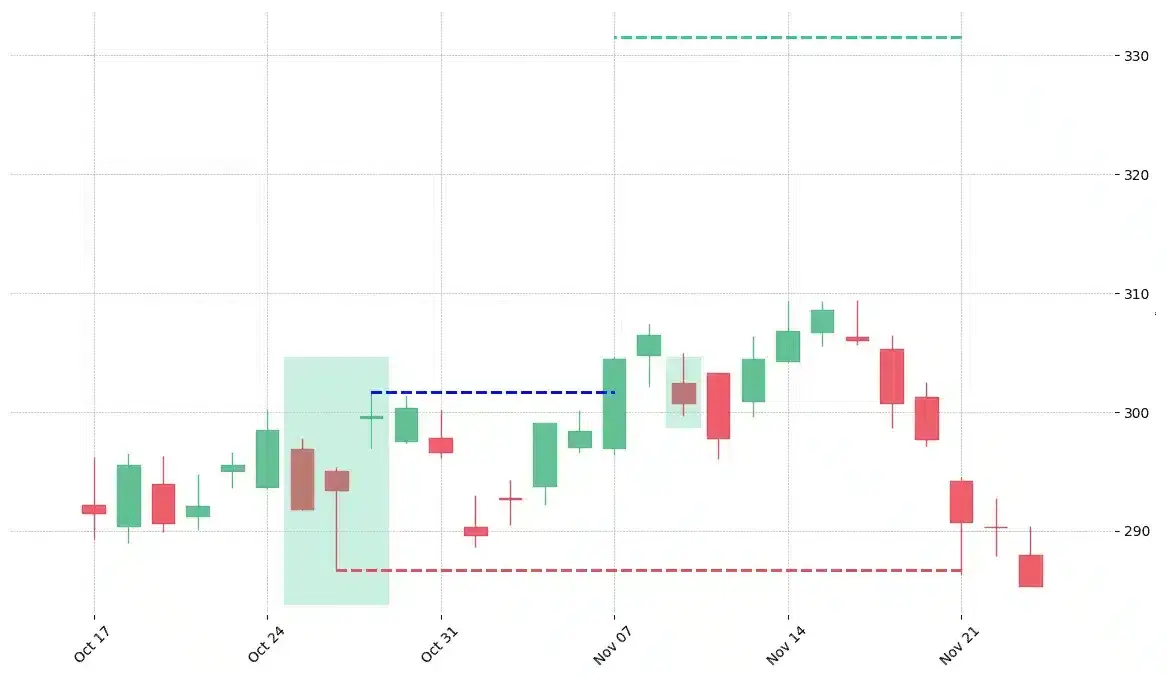
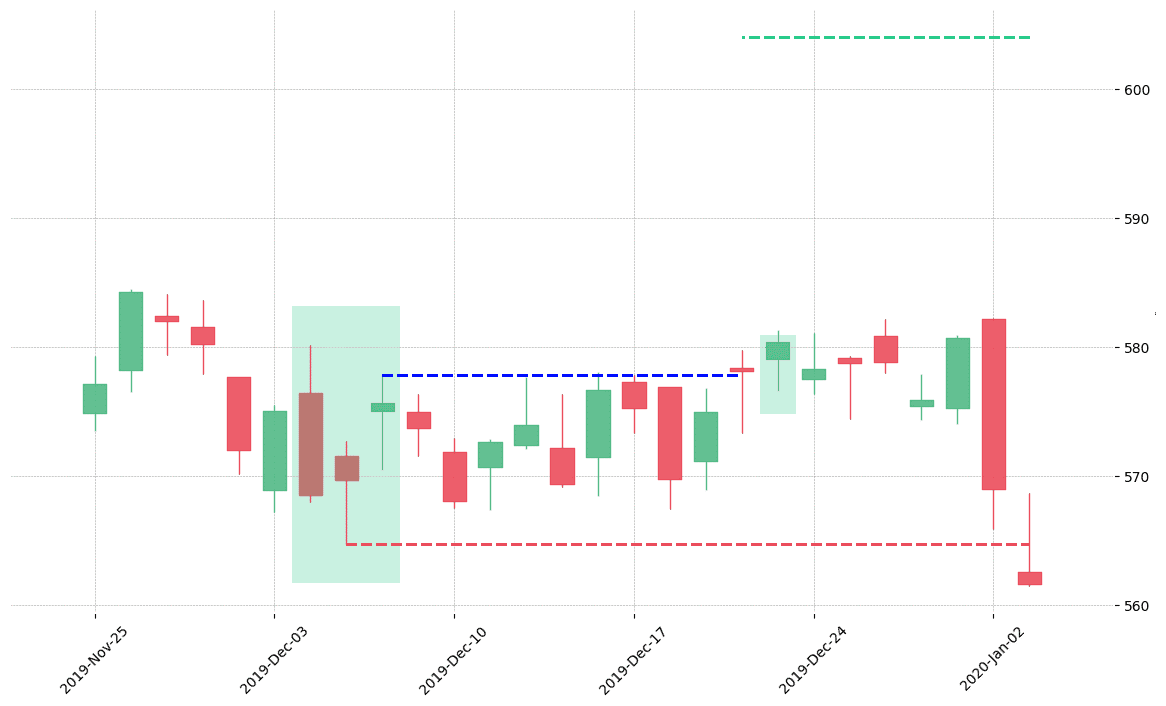
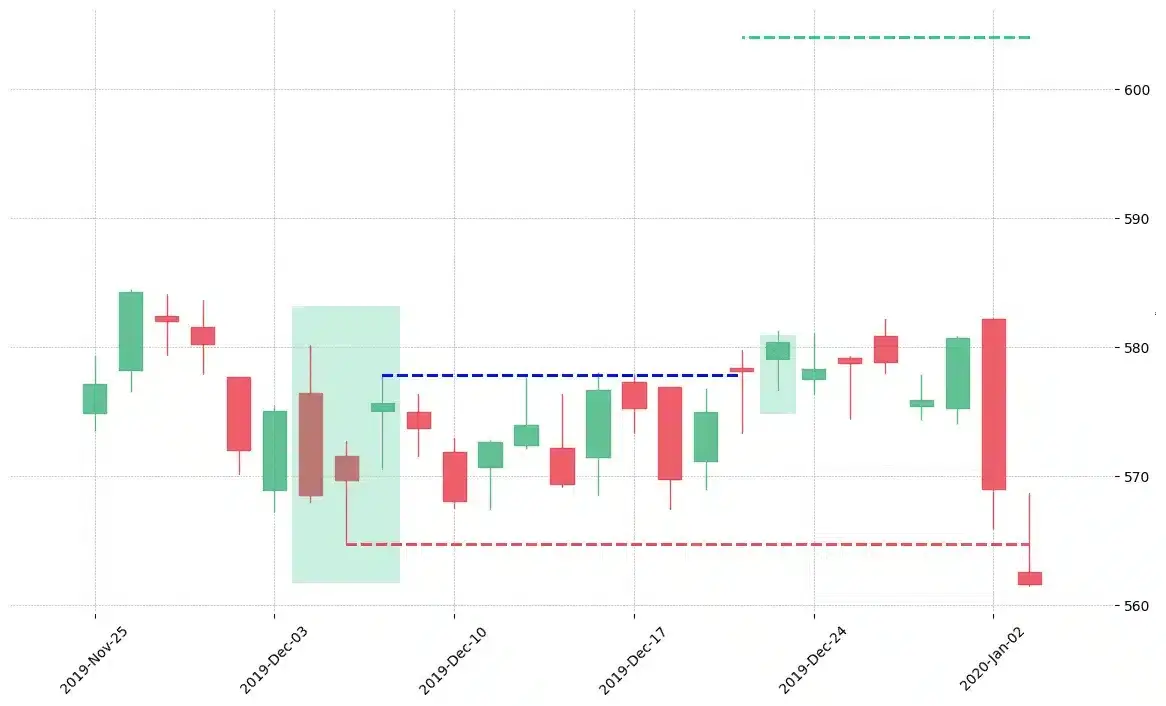
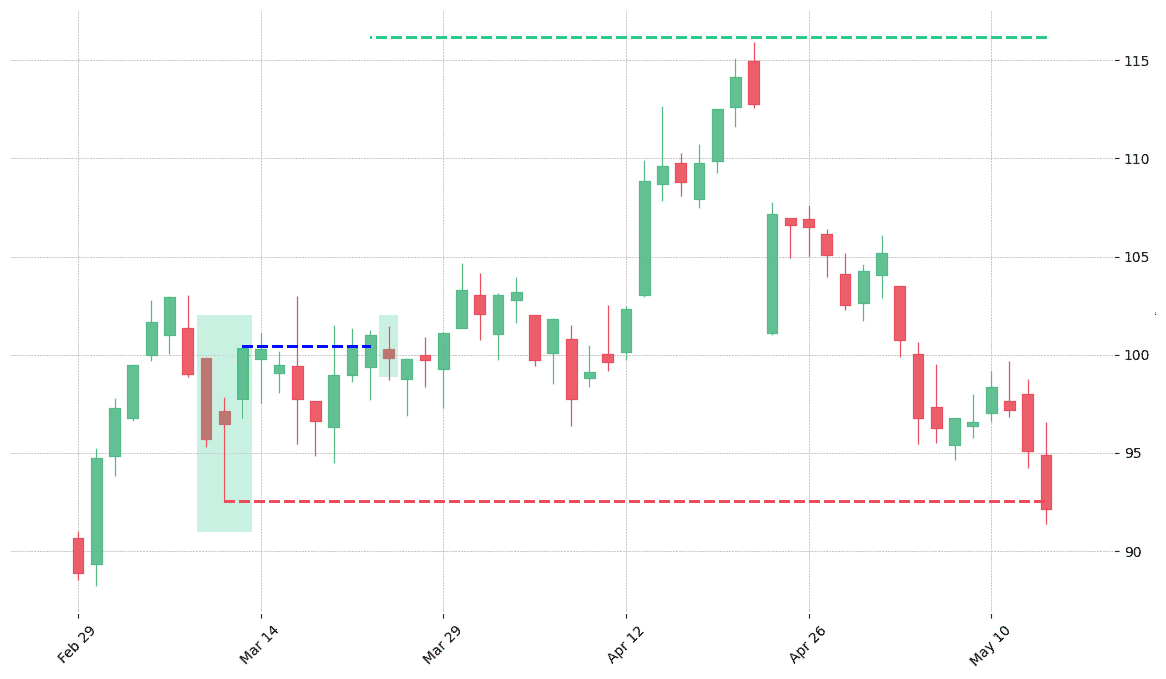
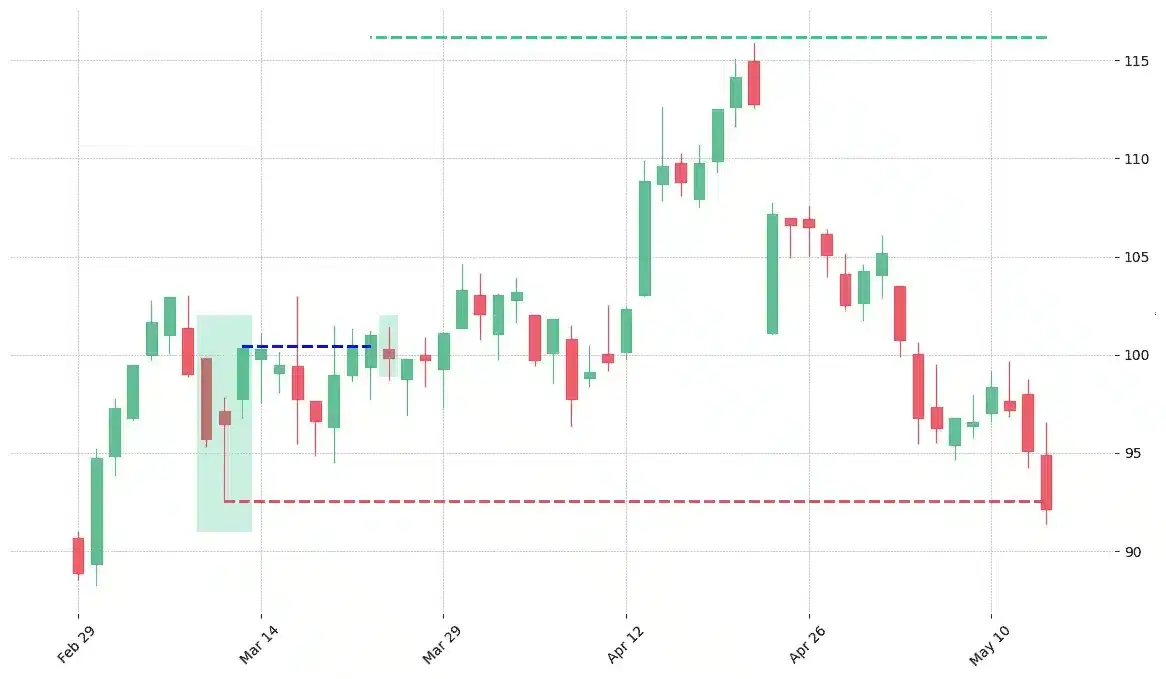
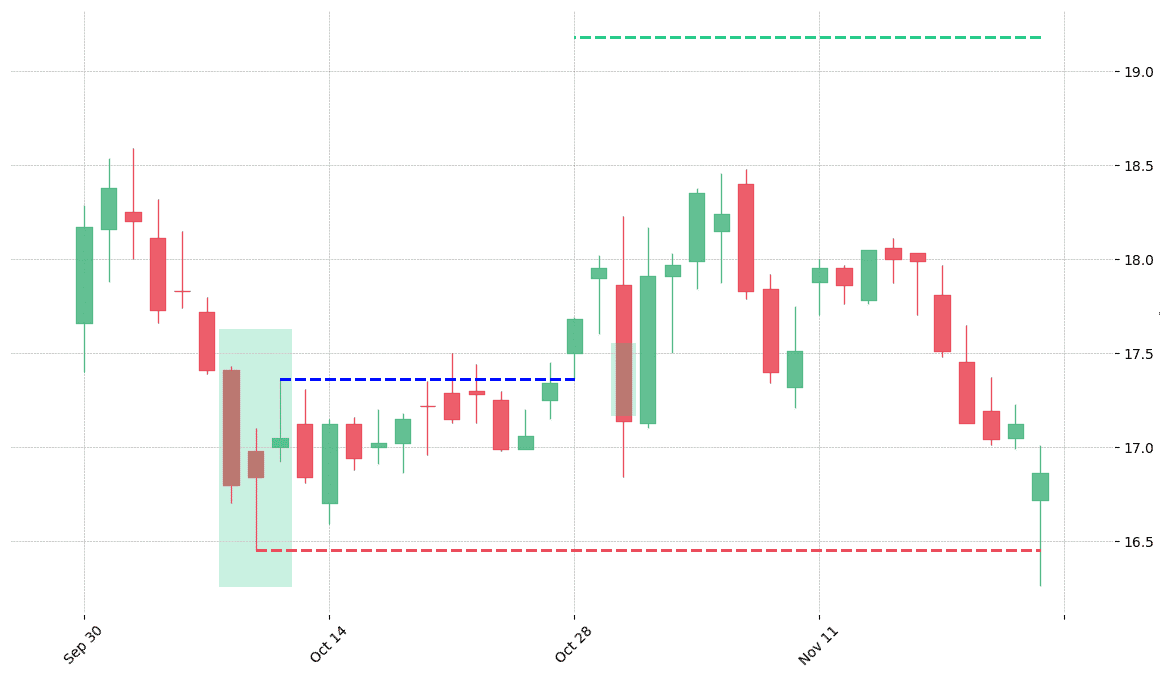
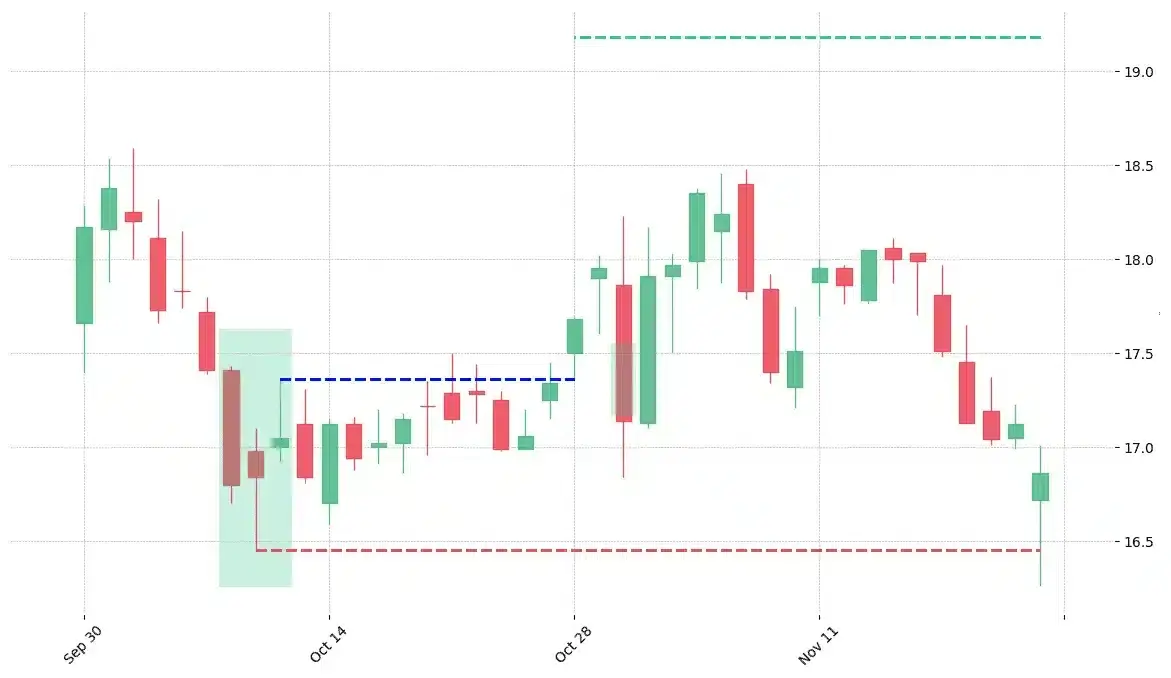
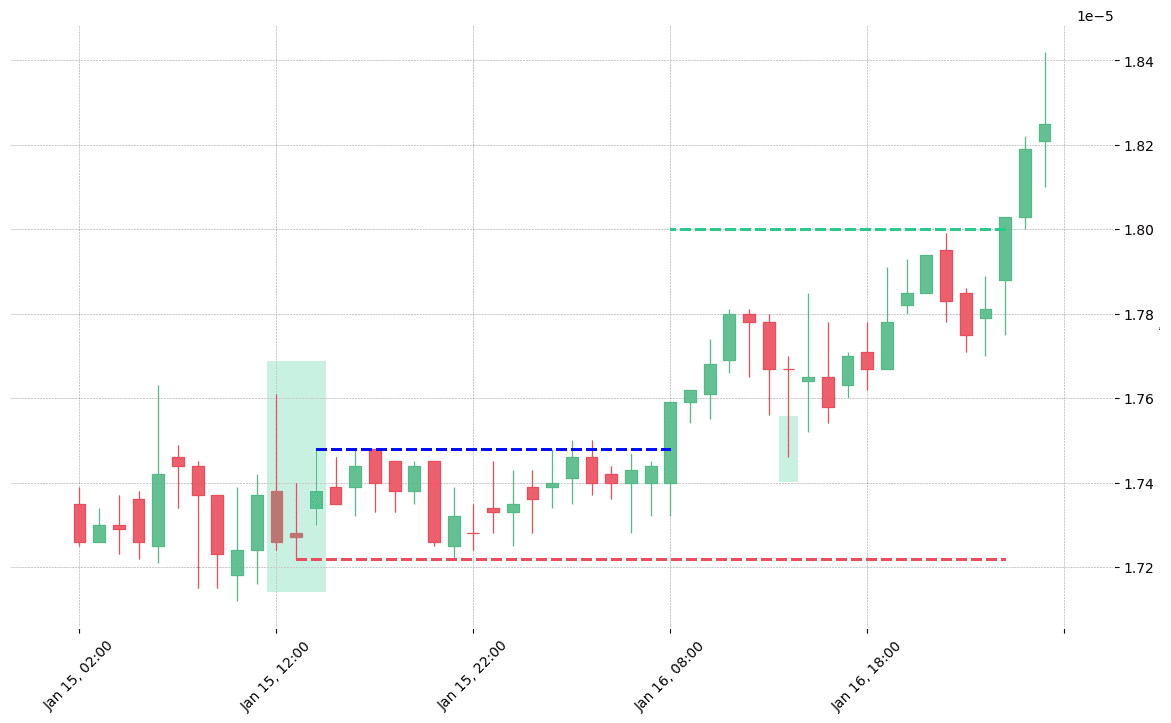
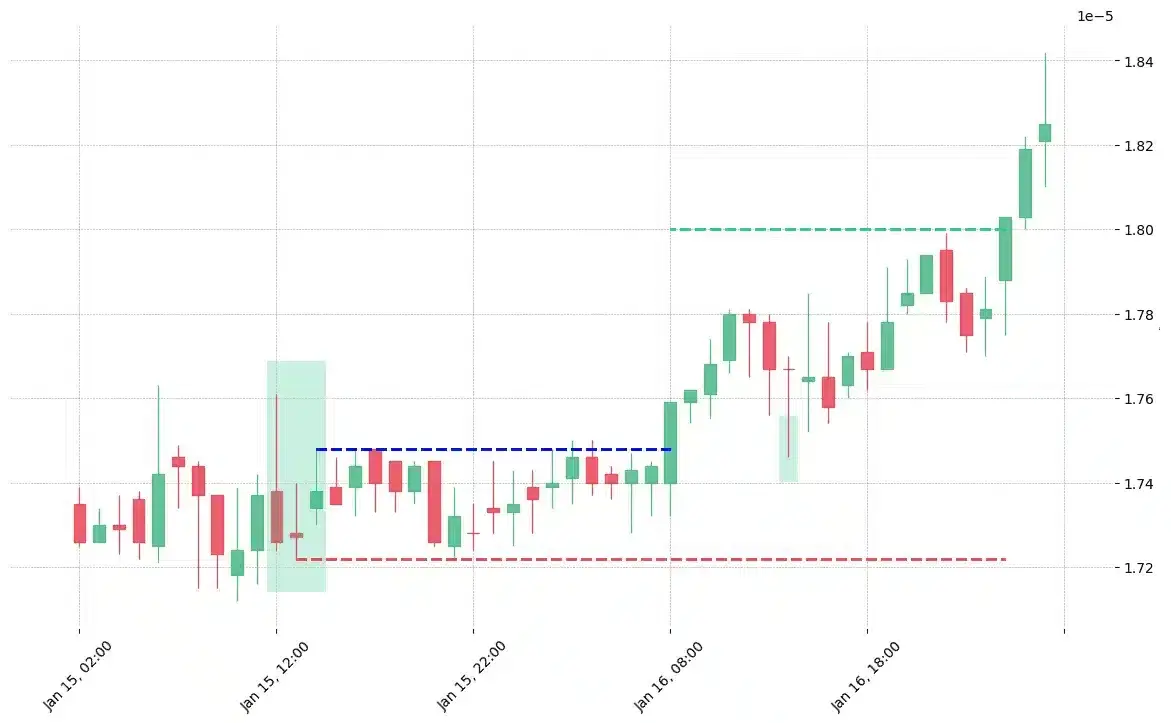
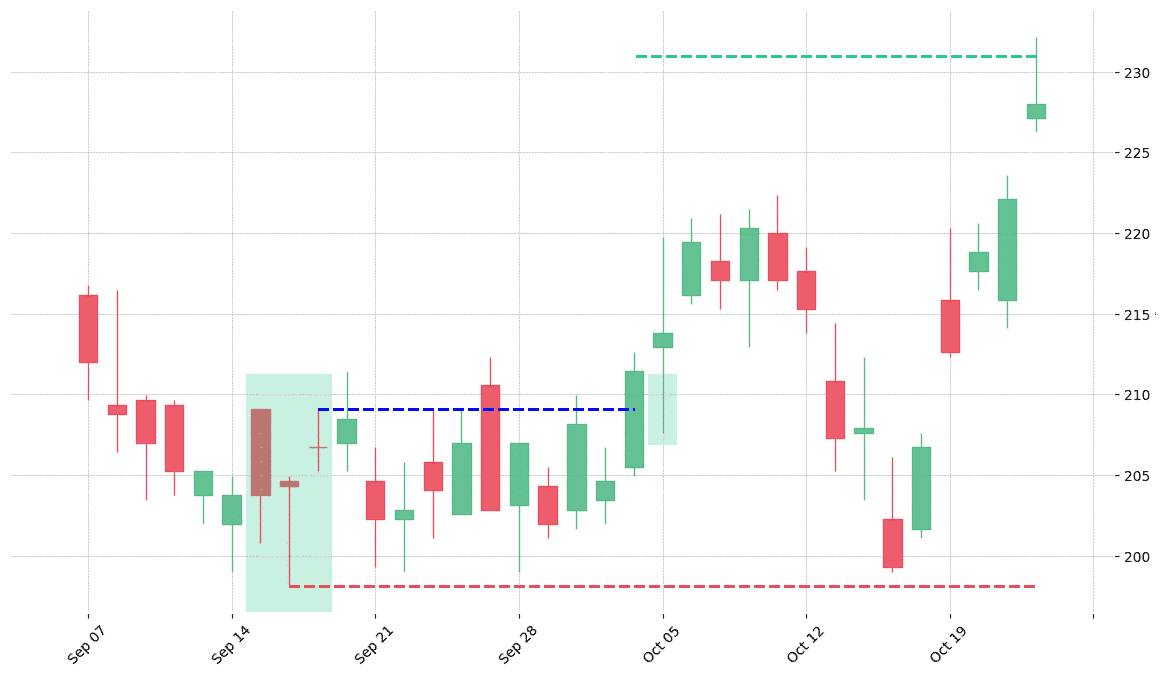
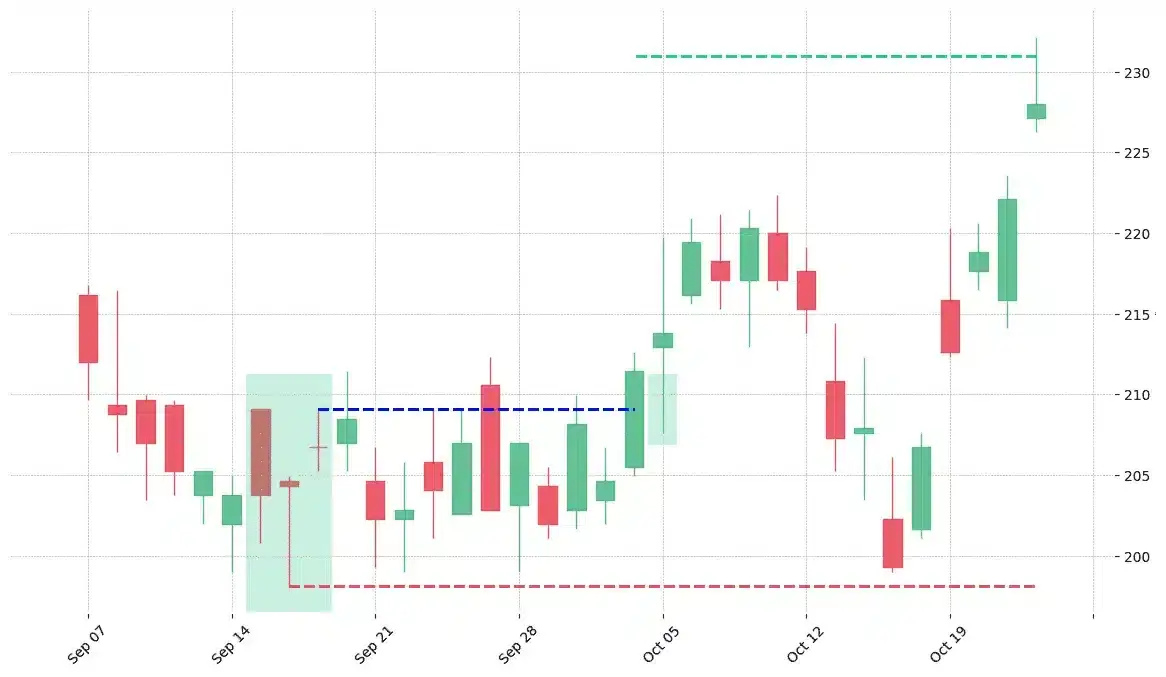
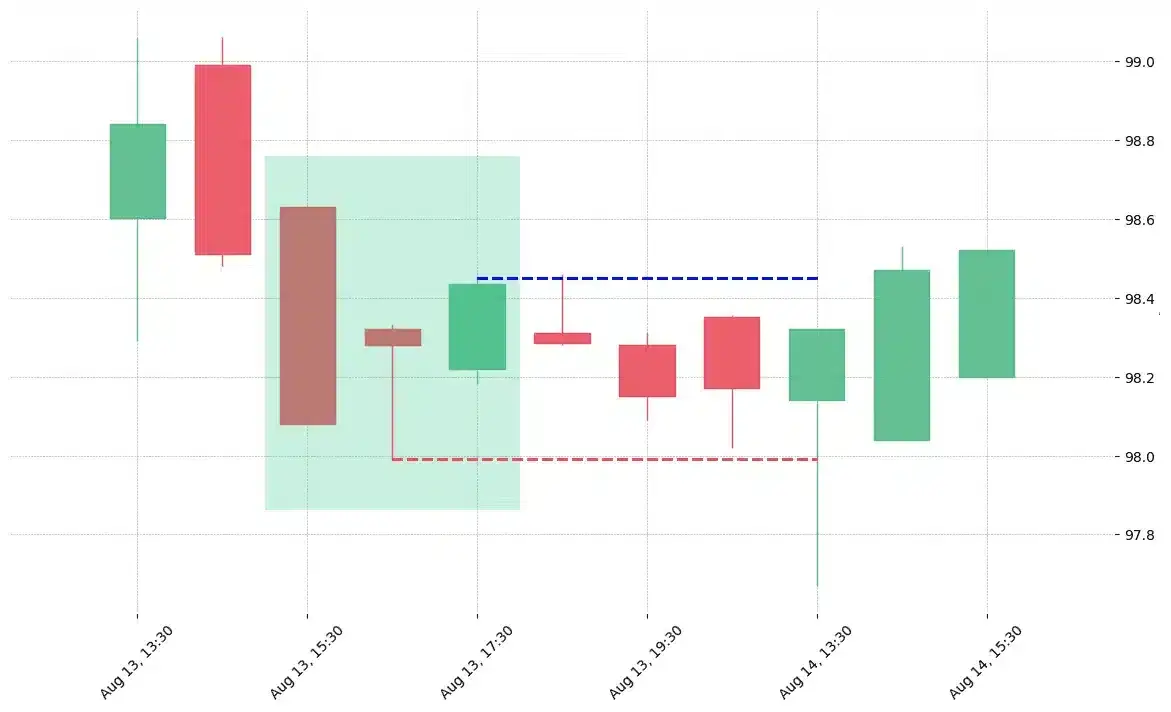
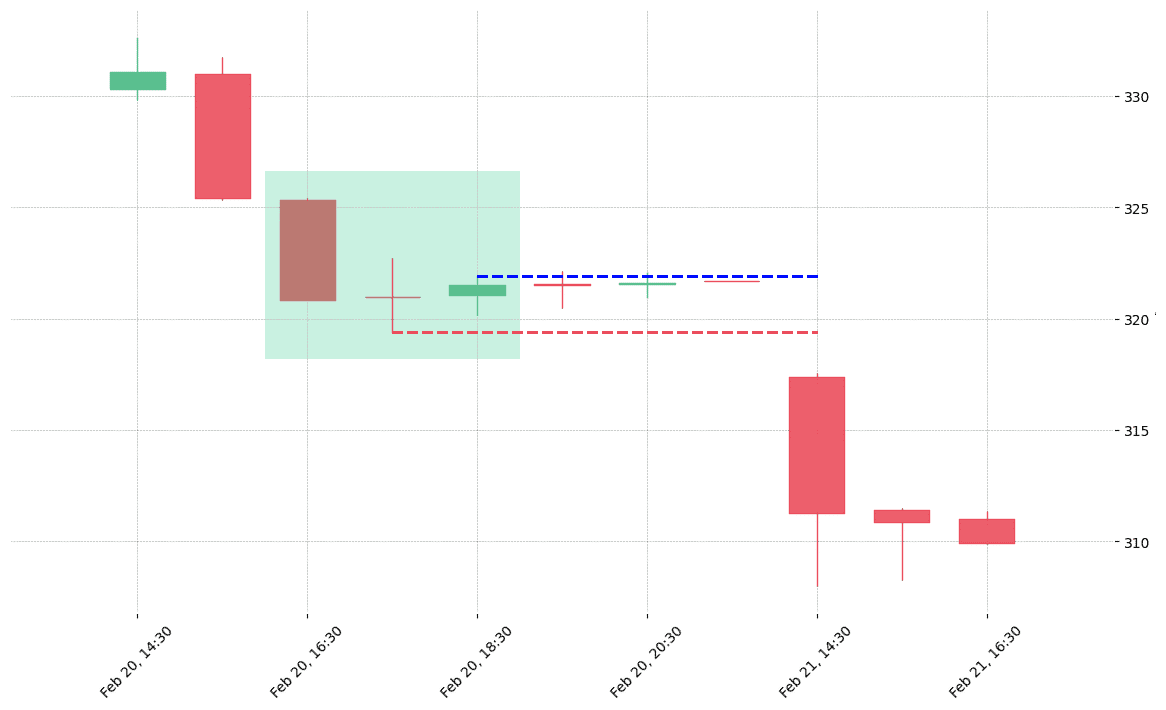
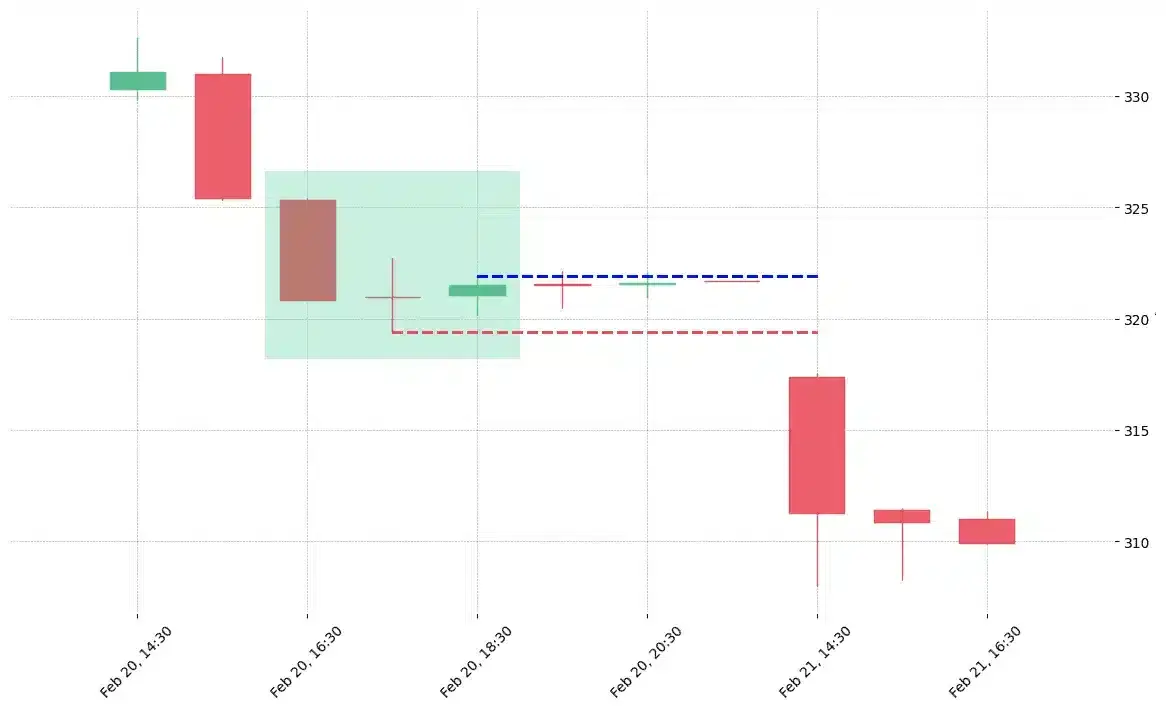
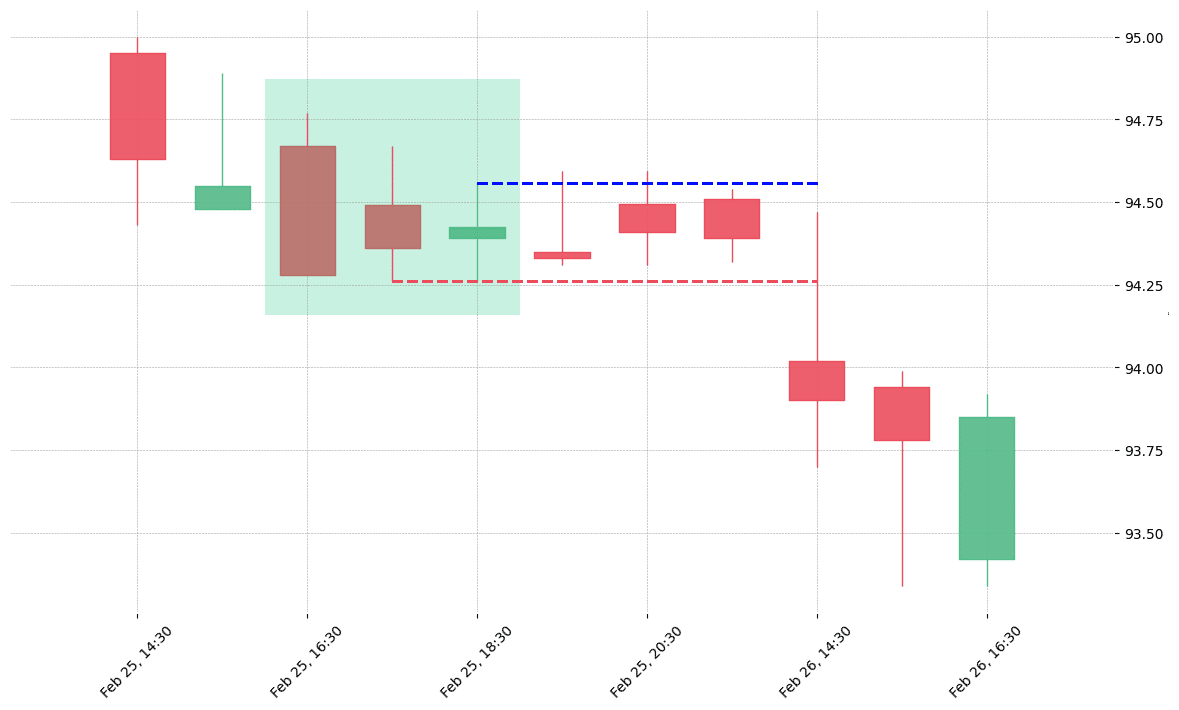
How does the Unique Three River pattern look in real life?

The stock ABBV printed a bullish Unique Three River on 2015-06-29. It confirmed on 2015-07-10 (meaning price closed above entry level). It retested the trade entry level on 2015-07-24. Then it failed to reach the 2:1 R/R target and got stopped on 2015-08-21.
The stock KSU printed a bullish Unique Three River on 1999-05-25. It confirmed on 1999-06-17 (meaning price closed above entry level). It retested the trade entry level on 1999-07-23. Then it failed to reach the 2:1 R/R target and got stopped on 1999-08-03.
The stock FAST printed a bullish Unique Three River on 2015-04-10. It confirmed on 2015-04-23 (meaning price closed above entry level). It retested the trade entry level on 2015-04-24. Then it failed to reach the 2:1 R/R target and got stopped on 2015-08-21.
The stock GOOGL printed a bullish Unique Three River on 2011-10-25. It confirmed on 2011-11-07 (meaning price closed above entry level). It retested the trade entry level on 2011-11-09. Then it failed to reach the 2:1 R/R target and got stopped on 2011-11-21.
The stock SHW printed a bullish Unique Three River on 2019-12-04. It confirmed on 2019-12-20 (meaning price closed above entry level). It retested the trade entry level on 2019-12-23. Then it failed to reach the 2:1 R/R target and got stopped on 2020-01-03.
The stock SIVB printed a bullish Unique Three River on 2016-03-09. It confirmed on 2016-03-22 (meaning price closed above entry level). It retested the trade entry level on 2016-03-23. Then it failed to reach the 2:1 R/R target and got stopped on 2016-05-13.
The stock TTWO printed a bullish Unique Three River on 2013-10-08. It confirmed on 2013-10-28 (meaning price closed above entry level). It retested the trade entry level on 2013-10-30. Then it failed to reach the 2:1 R/R target and got stopped on 2013-11-22.
The cryptocurrency pair GNT/BTC printed a bullish Unique Three River on 2019-01-15 12:00:00. It confirmed on 2019-01-16 08:00:00 (meaning price closed above entry level). It retested the trade entry level on 2019-01-16 14:00:00. Then it successfully reached the 2:1 R/R target.
The stock C printed a bullish Unique Three River on 1999-09-15. It confirmed on 1999-10-04 (meaning price closed above entry level). It retested the trade entry level on 1999-10-05. Then it successfully reached the 2:1 R/R target.
The stock ALL printed a bullish Unique Three River on 2018-08-13 15:30:00. Unfortunately it invalidated on 2018-08-14 13:30:00 before the trade could trigger (it triggered the stop before entering).
The stock MSCI printed a bullish Unique Three River on 2020-02-20 16:30:00. Unfortunately it invalidated on 2020-02-21 14:30:00 before the trade could trigger (it triggered the stop before entering).
The stock ZTS printed a bullish Unique Three River on 2019-02-25 16:30:00. Unfortunately it invalidated on 2019-02-26 14:30:00 before the trade could trigger (it triggered the stop before entering).

Looking to learn more about this pattern?
You should take a look at Joe Marwood's online course. In his course, he backtested the 26 main candlestick patterns before to summarize which one is THE best pattern. I really liked his course and you shouldn't miss it!
Click here to signup to his "Candlestick Analysis For Professional Traders" course now!

Russell Crane

Russell Crane

Russell is an Algorithmic & Technical Analyst Trader @ PatternsWizard.
His passion is to share his knowledge about TA, patterns & more. Why hope for your trading to work when you can precisely know the performance stat of every pattern?

Are Candlestick Patterns Reliable

candlesticksWe loved Marwood Research’s course “Candlestick Analysis For Professional Traders“. Do you want to follow a great video course and deep dive into 26 candlestick patterns (and compare their success rates)? Then make sure to check this course!

Want to know which markets just printed a pattern?

Market Timeframe Printed on

Get “Every Candlestick Patterns Statistics”, The Last Trading Book You’ll Ever Need! 📖

PatternsWizard book - Every Candlestick Patterns Statistics

"Every Candlestick Patterns Statistics", the last trading book you'll ever need!

Pre-register now and receive the candlestick patterns statistics ultimate ebook for free before anyone else!

"All you need is one pattern to make a living."
- Linda Raschke

Awesome move! We are giving the last touch to the "Every Candlestick Patterns Statistics" book. We are very excited to send it to you right when it's ready. In the meantime, we'd like to gift you our trading roadmap and its best 55 resources. You'll shortly receive an email with the link. Don't miss it ;) Stay tuned 📈