Ladder Bottom candlestick pattern: Definition

Candlestick patterns

Ladder Bottom
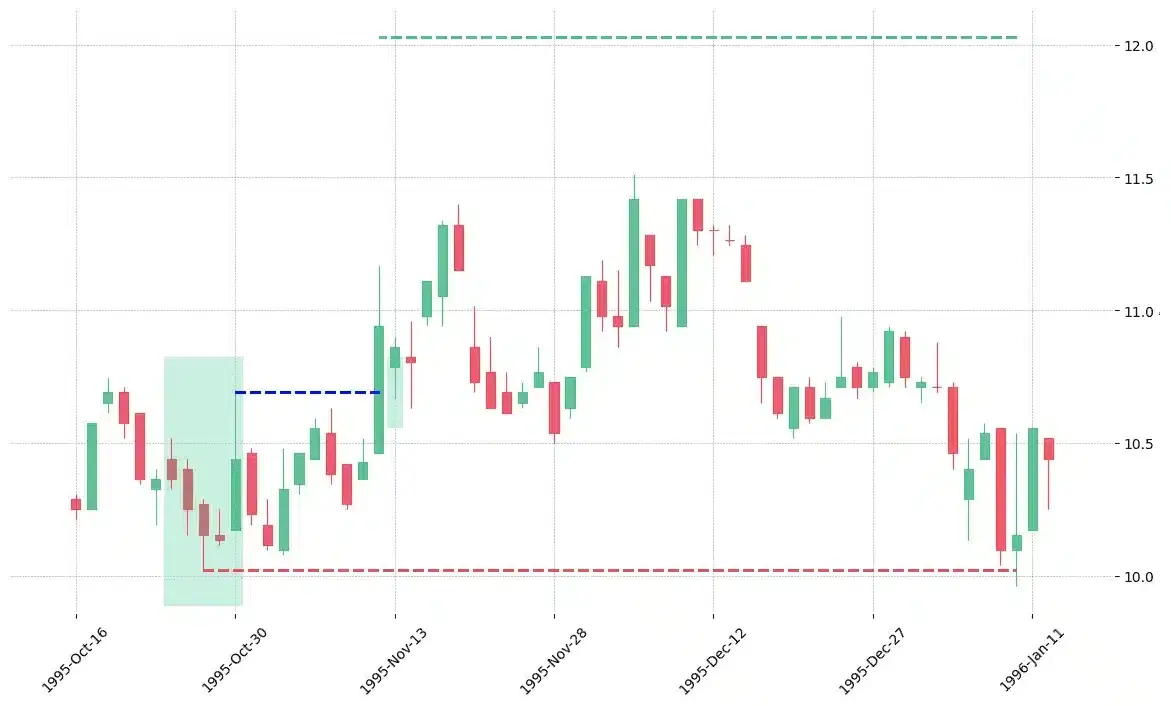
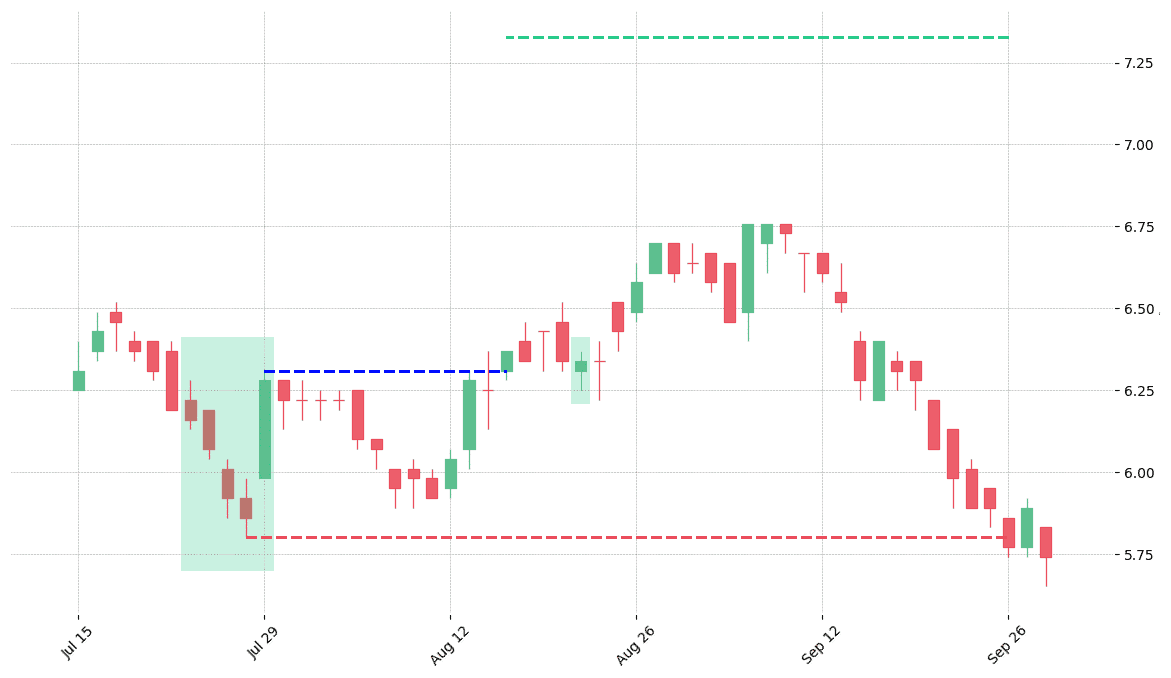
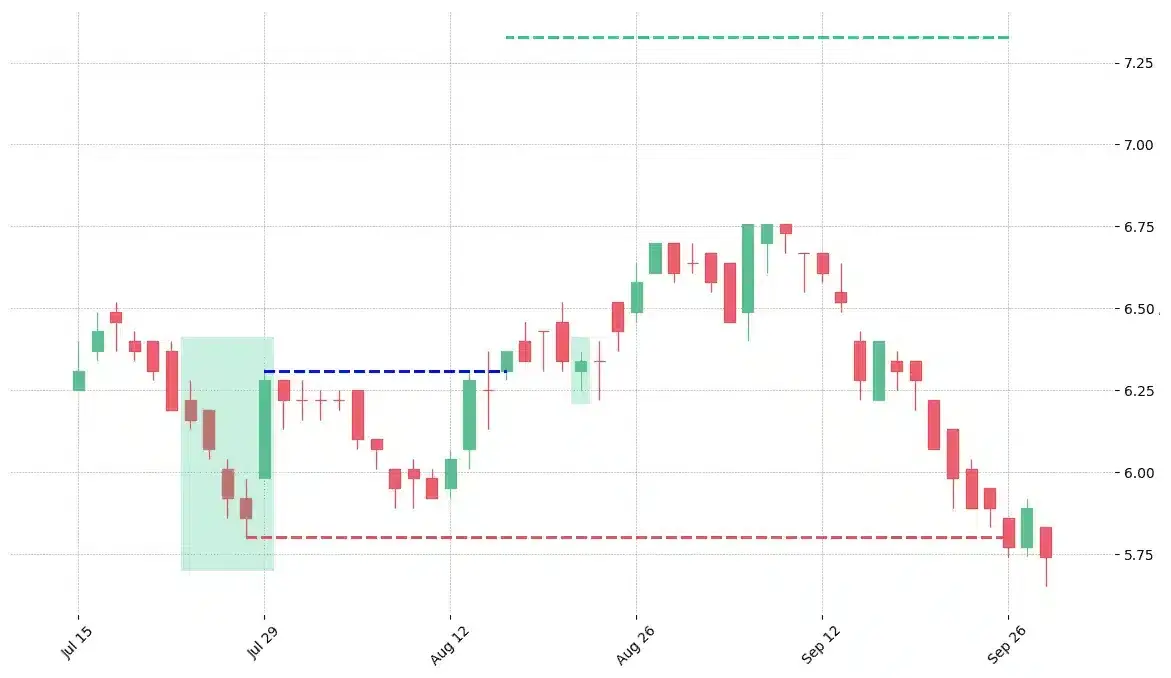
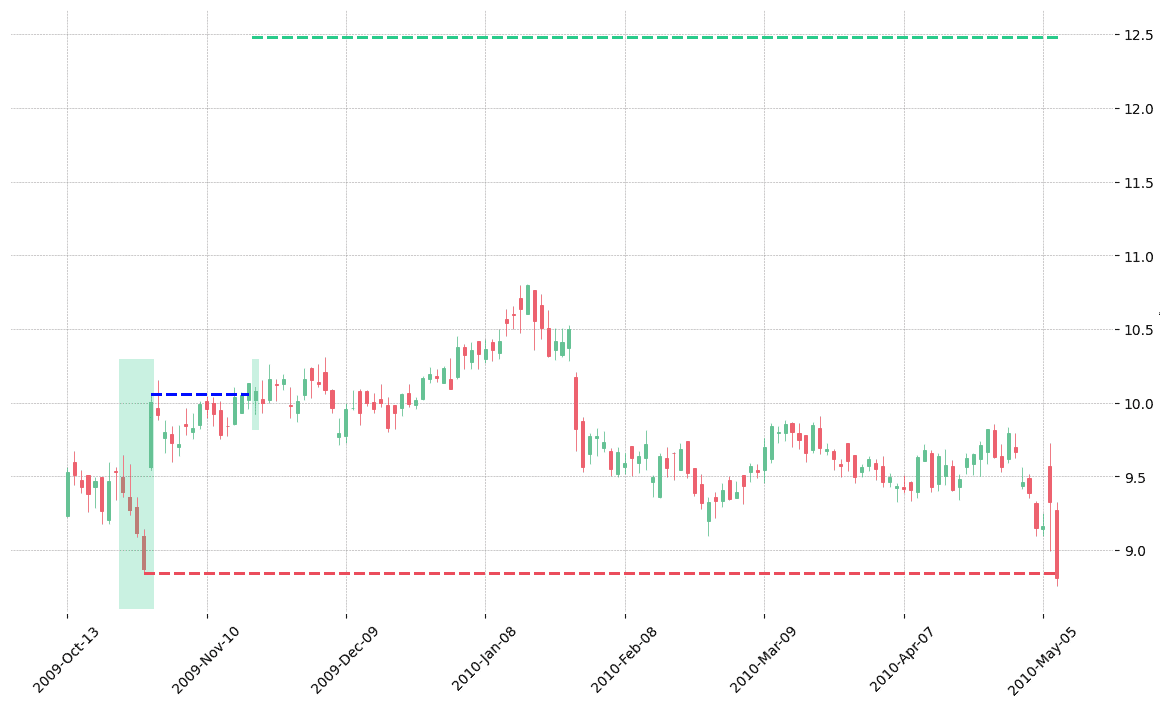
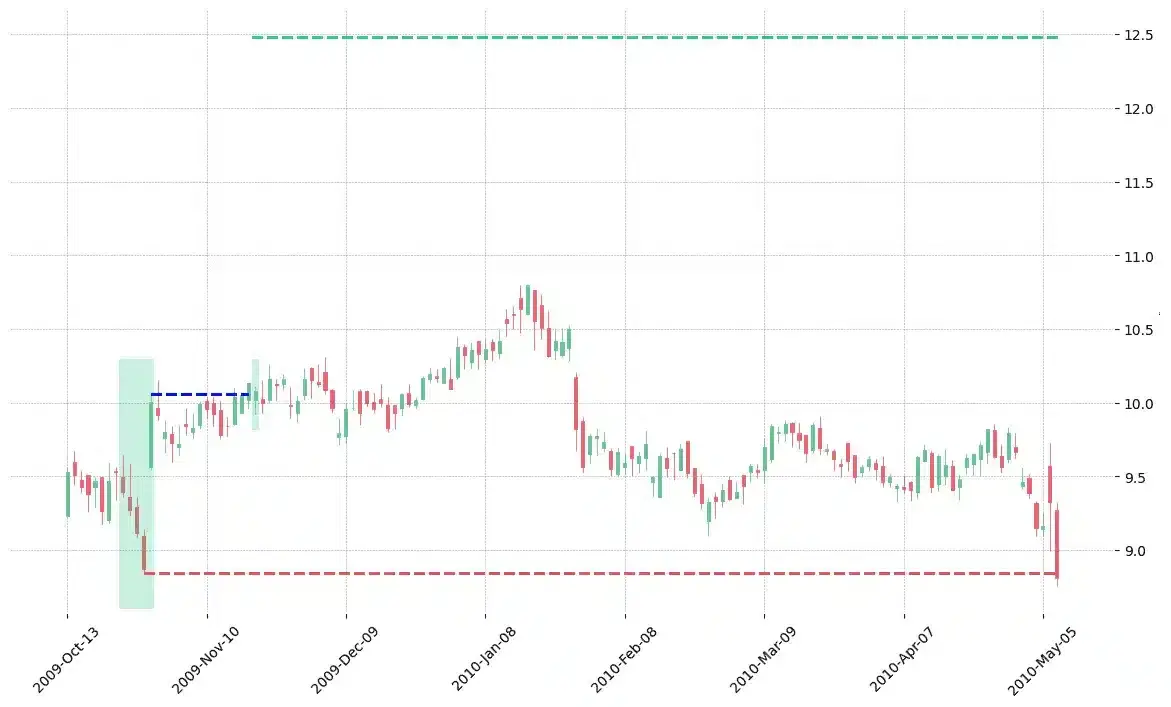
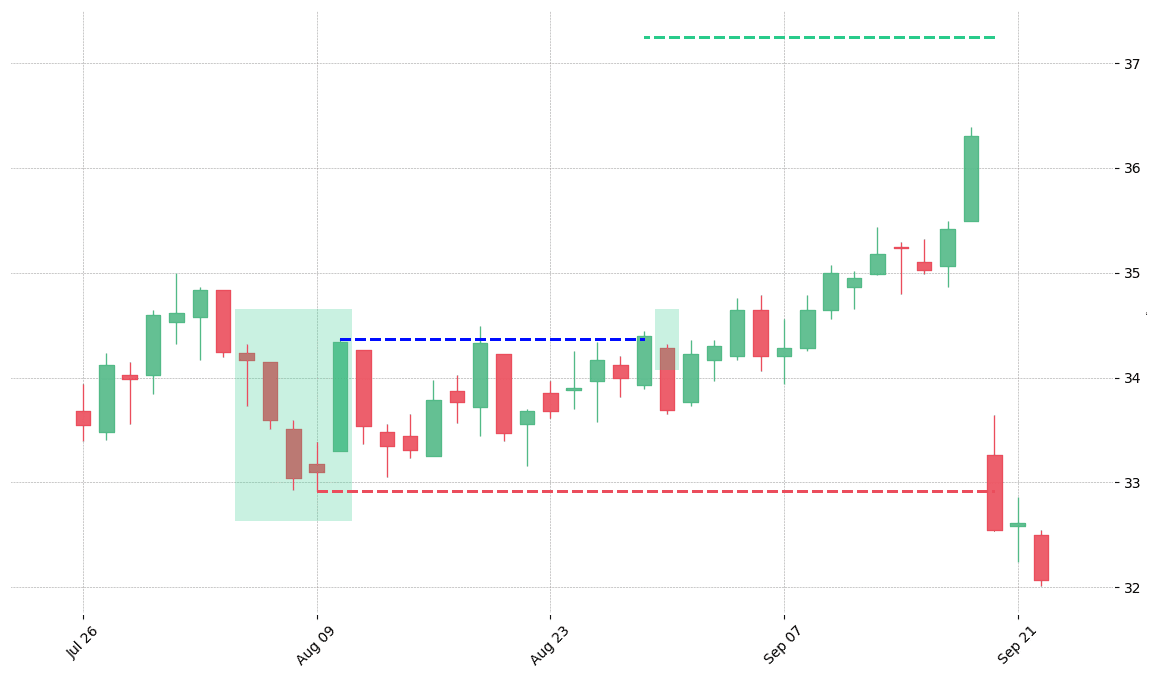
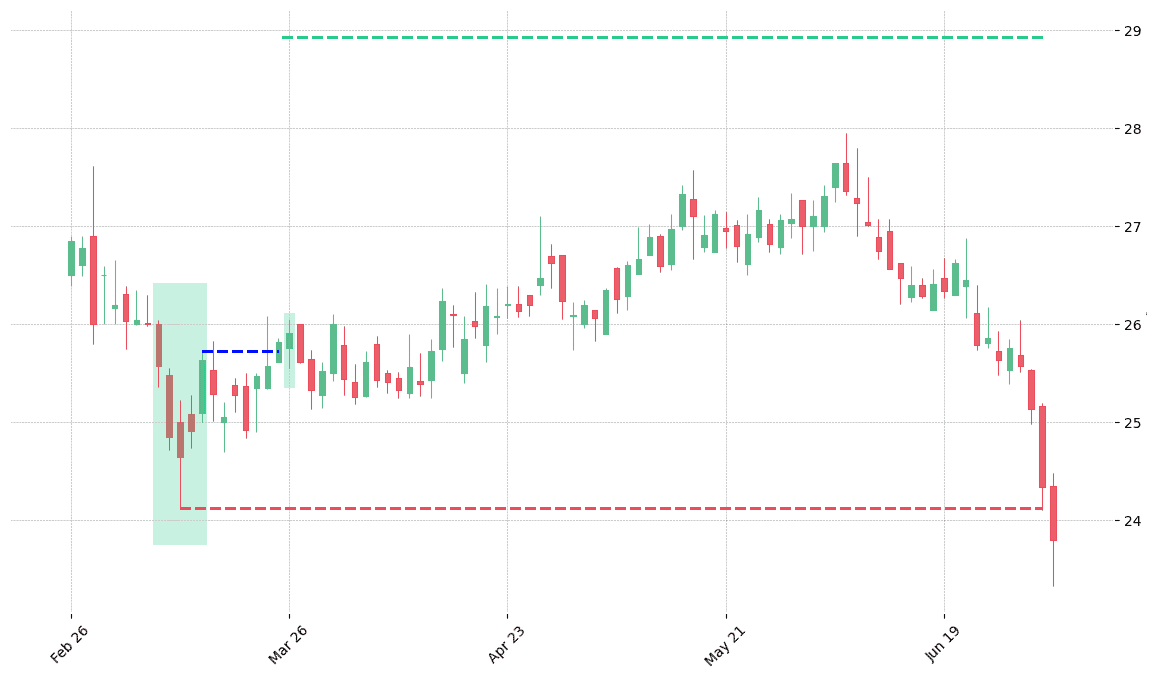
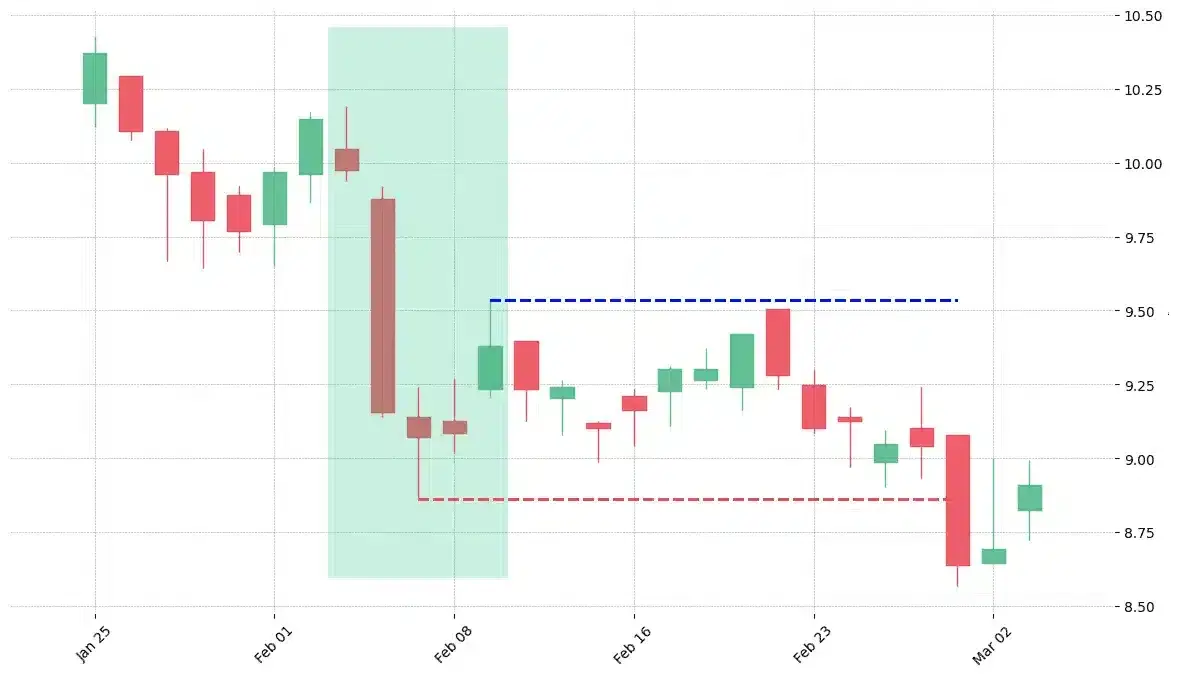
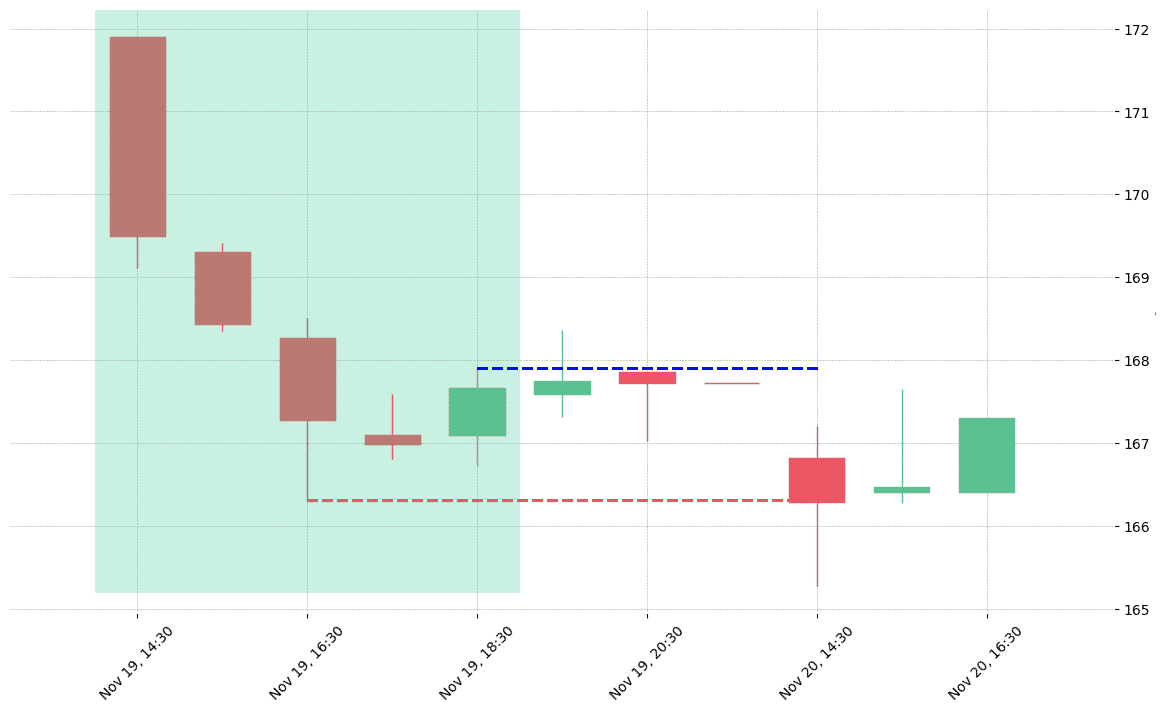
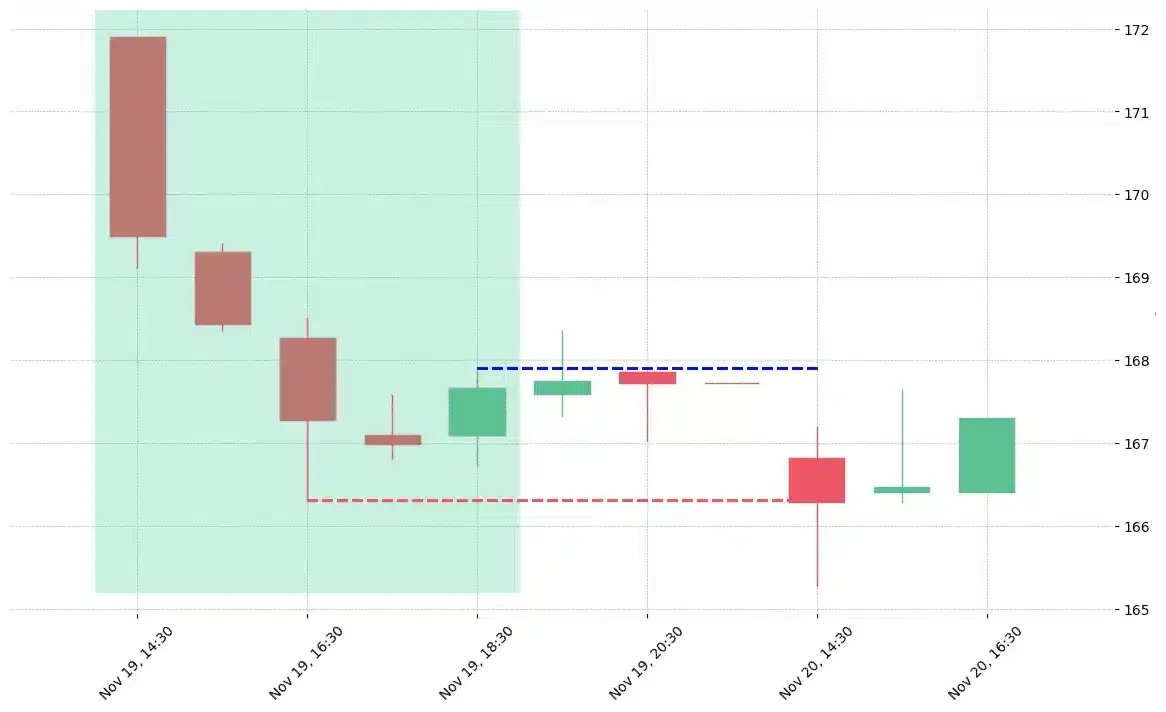
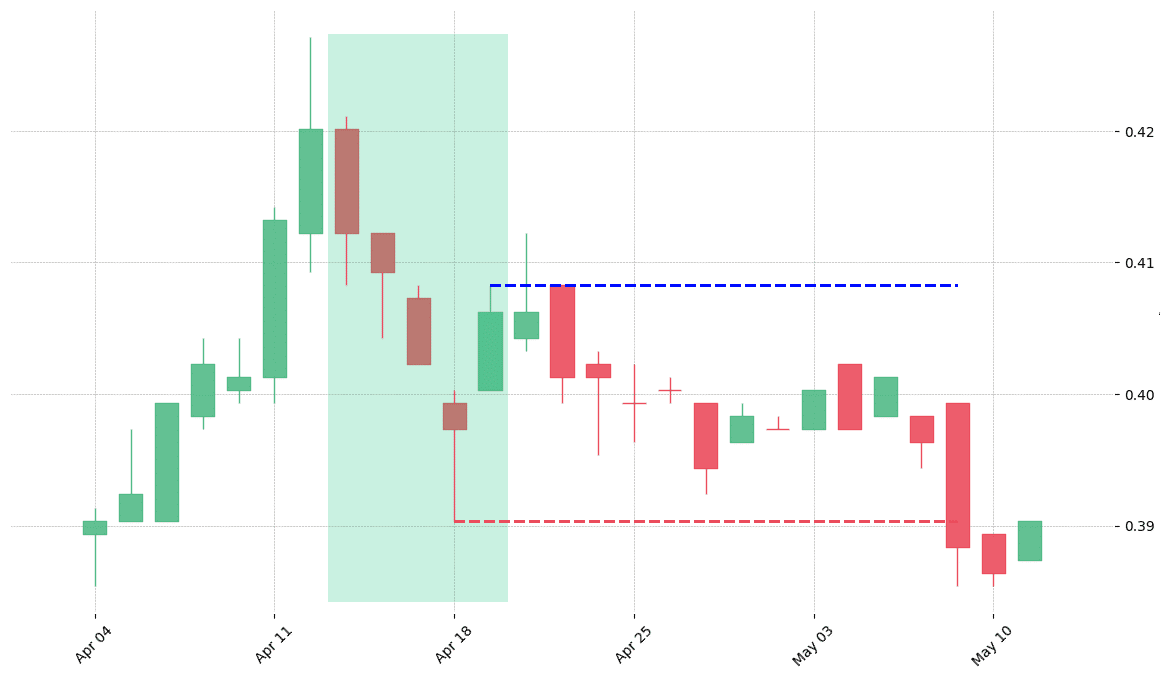
  • The ladder bottom candlestick pattern is a 5-bar bullish reversal pattern.
  • It forms following these characteristics:
    • The first three long black candlesticks, resembling three black crows formation, with successive lower opens and close
    • The fourth is also a black candlestick but with a short body and an upper wick
    • The fifth white candlestick opening above the body of the fourth candlestick 

Statistics to prove if the Ladder Bottom pattern really works

Are the odds of the Ladder Bottom pattern in your favor?


How does the Ladder Bottom behave with a 2:1 target R/R ratio?

Success rate

From our research the Ladder Bottom pattern confirms 72.8% of the time on average overall all the 4120 markets we analysed. Historically, this patterns confirmed within 3 candles or got invalidated within 6 candles. If confirmed, it reached the 2:1 R/R target 38.2% of the time and it retested it's entry price level 96.3% of the time.
Not accounting for fees, it has an expected outcome of 0.147 $/$. It means for every $100 you risk on a trade with the Ladder Bottom pattern you make $14.7 on average.
Want to account for your trading fees? Have the detailled stats for your favorite markets / timeframes? Or get the stats for another R/R than 2:1?
🚀 Join us now and get fine-tuned stats you care about!

How to handle risk with the Ladder Bottom pattern?


We analysed 4120 markets for the last 59 years and we found 3 750 occurrences of the Ladder Bottom pattern.
On average markets printed 1 Ladder Bottom pattern every 4 161 candles.

For 2:1 R/R trades, the longest winning streak observed was 9 and the longest losing streak was 14. A trading strategy relying solely on this pattern is not advised. Anyway, make sure to use proper risk management.

Stack the odds in my favor NOW!

Keep in mind all these informations are for educational purposes only and are NOT financial advice.

If you want to learn more and deep dive into candlestick patterns performance statistics, I strongly recommend you follow the best available course about it. Joe Marwood (who's a famous trader with more than 45 000 Twitter followers) created an online course called "Candlestick Analysis For Professional Traders" in his Marwood Research University. There he will take you through the extensive backtesting of the 26 main candlestick patterns. He then summarizes which one is THE best pattern. Do you know which one it is?
Remember, don't trade if you don't know your stats. Click here to signup to the course now!

What is the Ladder Bottom candlestick pattern?

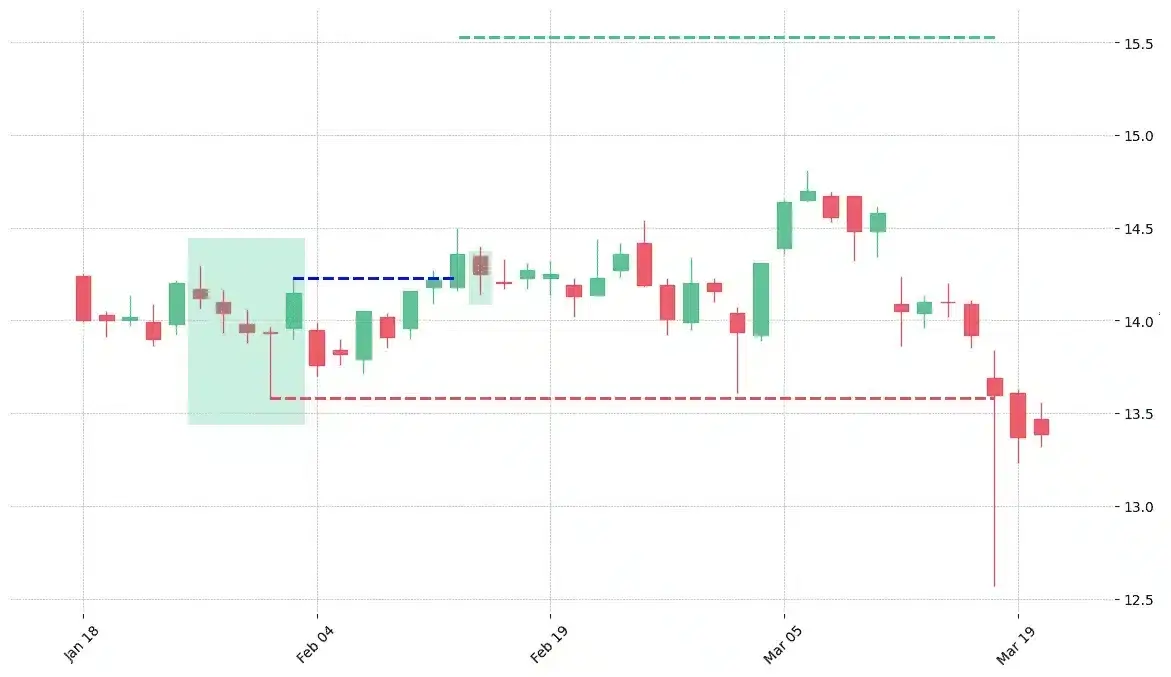
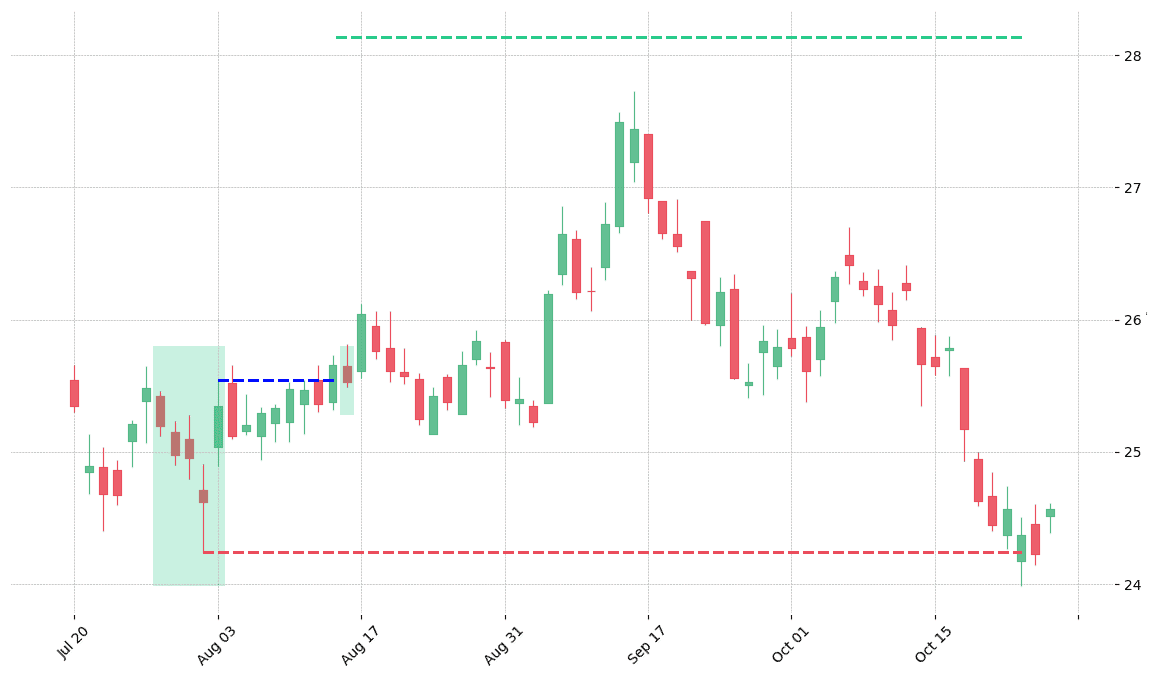
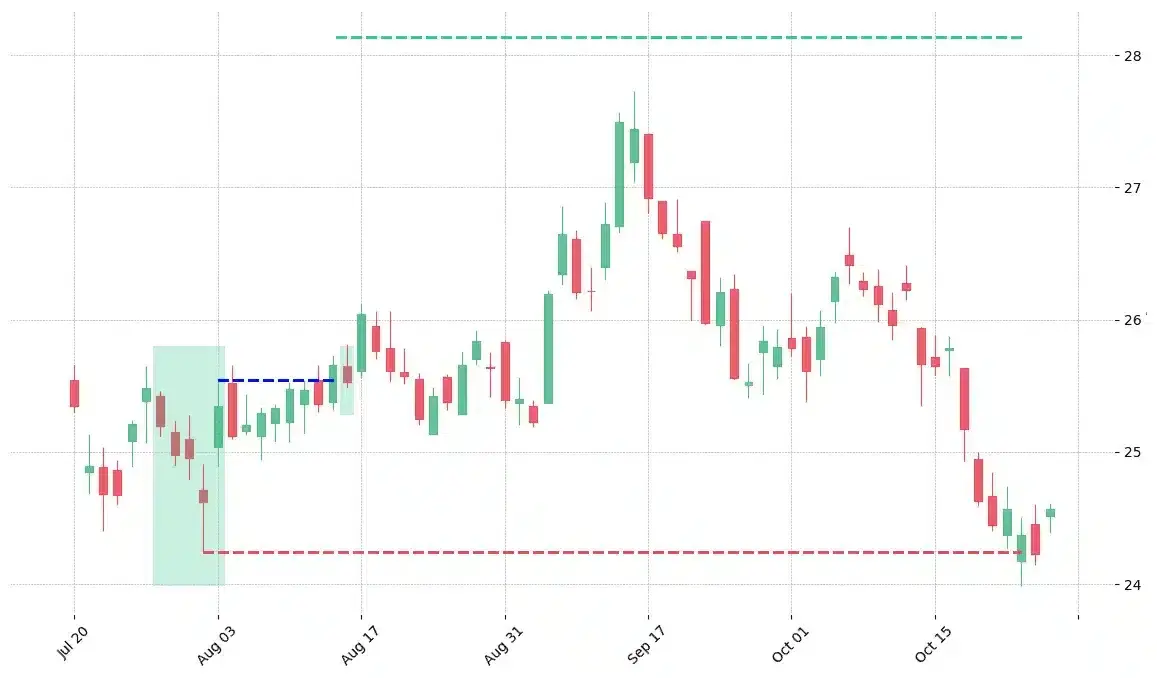
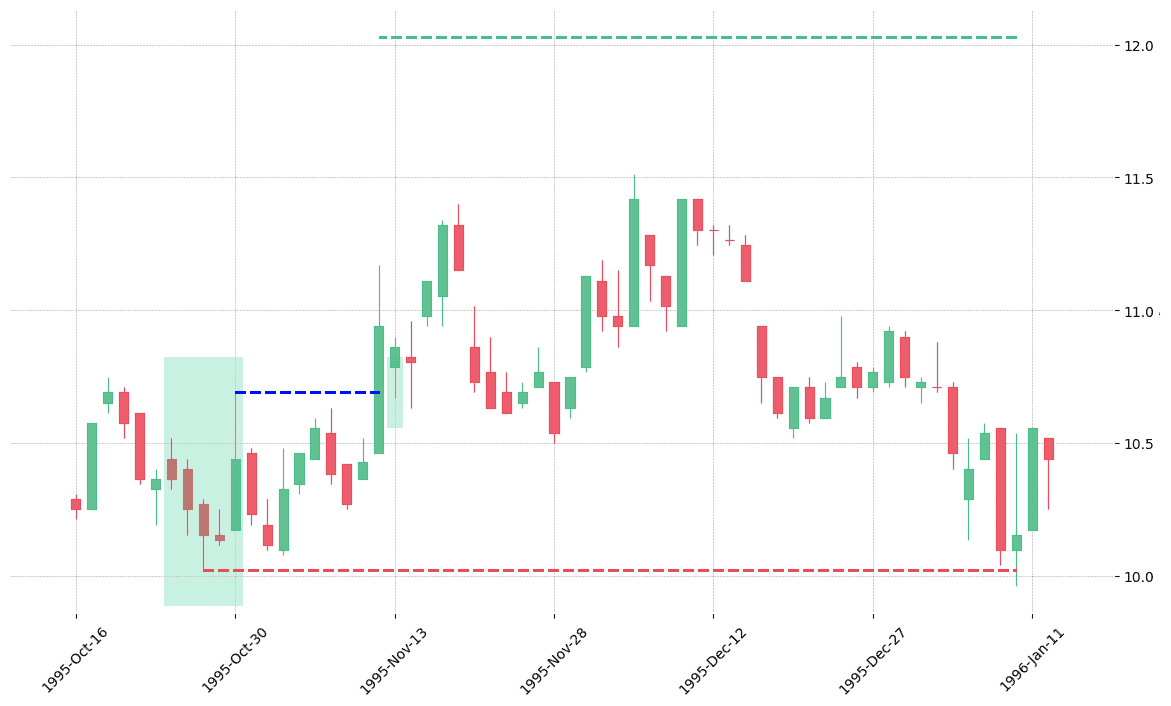
The ladder bottom candlestick pattern is a bullish reversal pattern with the following five candles. 

  1. The first three long black candlesticks, resembling three black crows formation, with successive lower opens and close
  2. The fourth is also a black candlestick but with a short body and an upper wick
  3. The fifth white candlestick opening above the body of the fourth candlestick 

The first three decreasing candlesticks strictly follow the downtrend but the appearance of the fourth one indicates the weaknesses of the downtrend. Finally, the fifth one blows the whistle to inform about the beginning of a new trend in the market.

Being a bullish reversal pattern, the ladder bottom pattern appears at the end of a downtrend. It is the most popular pattern for giving early signs of downtrend’s deterioration. The formation of the ladder bottom indicates that the impetus of the downtrend is slowing down. However, its formation is very rare and it is not a reliable source to base trading strategies on. Therefore, confirmation is important. 

How to identify the ladder bottom candlestick pattern? 

The ladder bottom candlestick pattern is a very rare one and it isn’t always easy to identify the pattern. However, there are certain hints that are useful to identify the ladder bottom. 

  • For a ladder bottom to form, the market must be in a downtrend as we already know that it is a bullish pattern. 
  • The first three candles must have long black bodies opening and closing below the open and close of the previous day.
  • The fourth candle must have a short real body with a long overhead shadow. 
  • The fifth candle is white that opens above the previous candle’s real body.

What does the pattern tell traders? 

The ladder bottom pattern sheds light on the underlying forces that set the course of the movements of the market. It is essential to understand those movements to have a better understanding of the market and its mechanism. Traders can get valuable insights through analyzing the market that can prove very fruitful when devising trading strategies. As we have discussed earlier that the ladder bottom is a bullish pattern and the prevailing trend in the market is a bearish one. Hence, we can analyze the market and deduce that selling pressure is stronger than the buying pressure and bears are dominating the market. The first three long black candles indicate exactly the same. 

However, the appearance of the fourth candle helps to predict an upcoming change in the market. Although the market still closes lower than the opening level but bulls attempt to take control back also becomes clear. Here, the upper long wick of the fourth candle shows exactly the same. The appearance of the fifth candle makes it certain that a change towards an uptrend is about to happen.

The ladder bottom candlestick pattern also tells traders to exit short positions or place their stop-loss levels. However, going long requires confirmation of the bullish reversal. Technical analysts and expert traders always advise using the bottom ladder in combination with other technical analysis tools to predict the bullish reversals and for successful trading. 

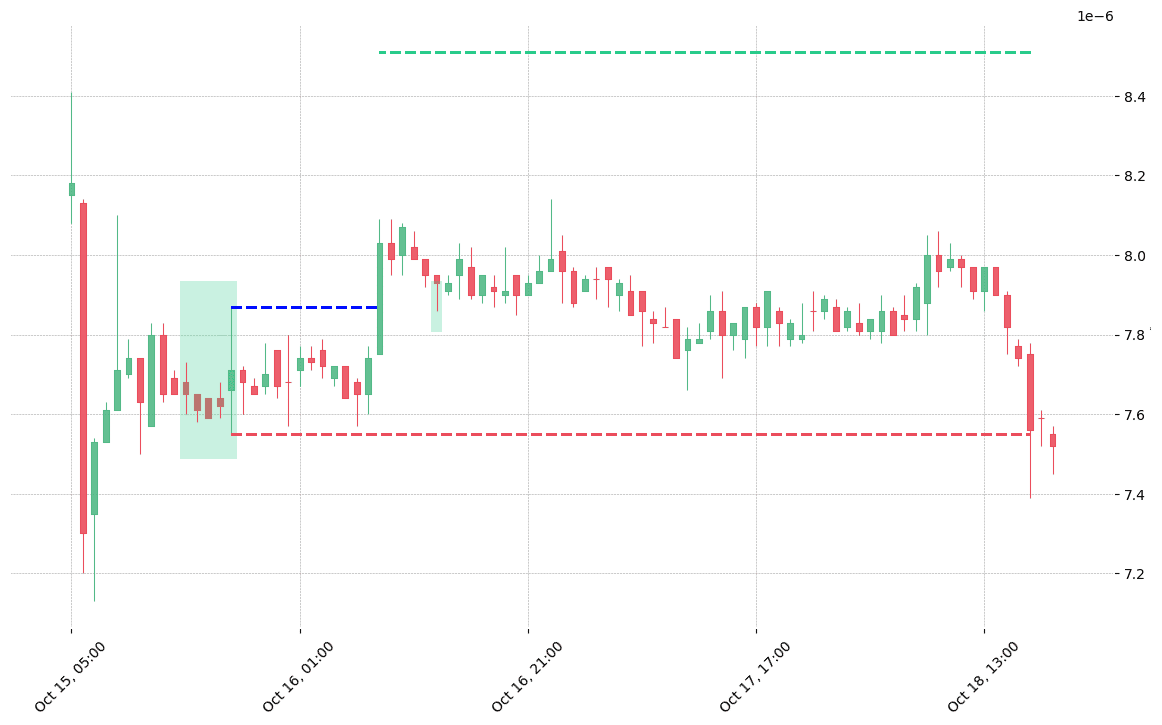
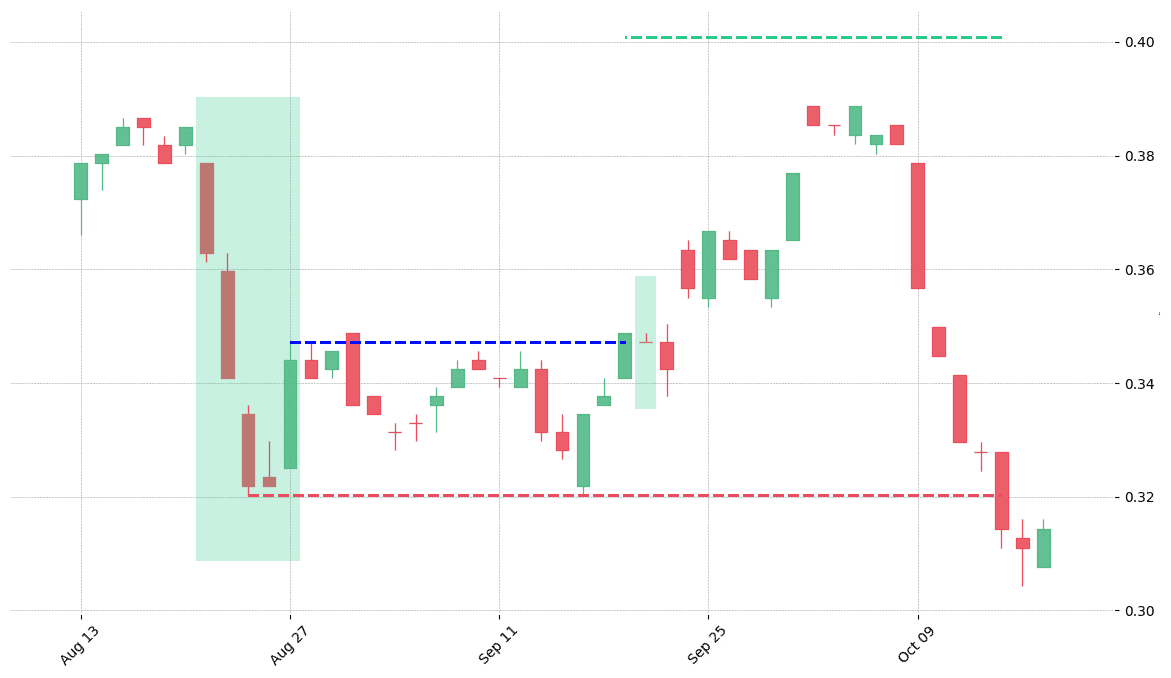
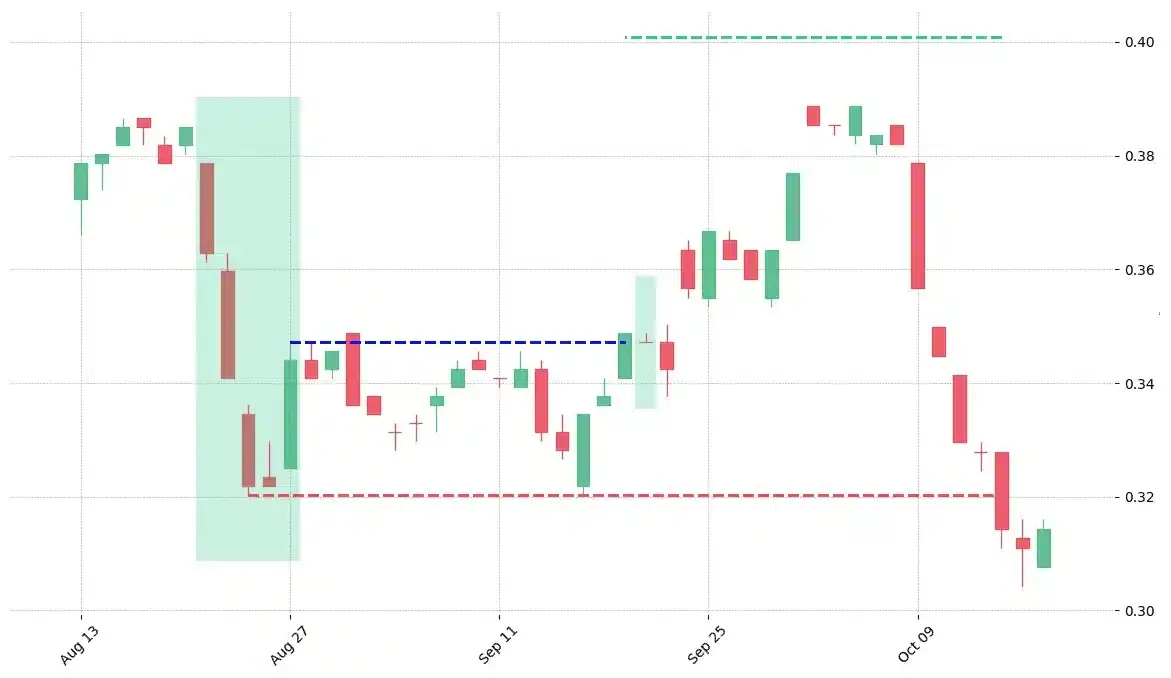
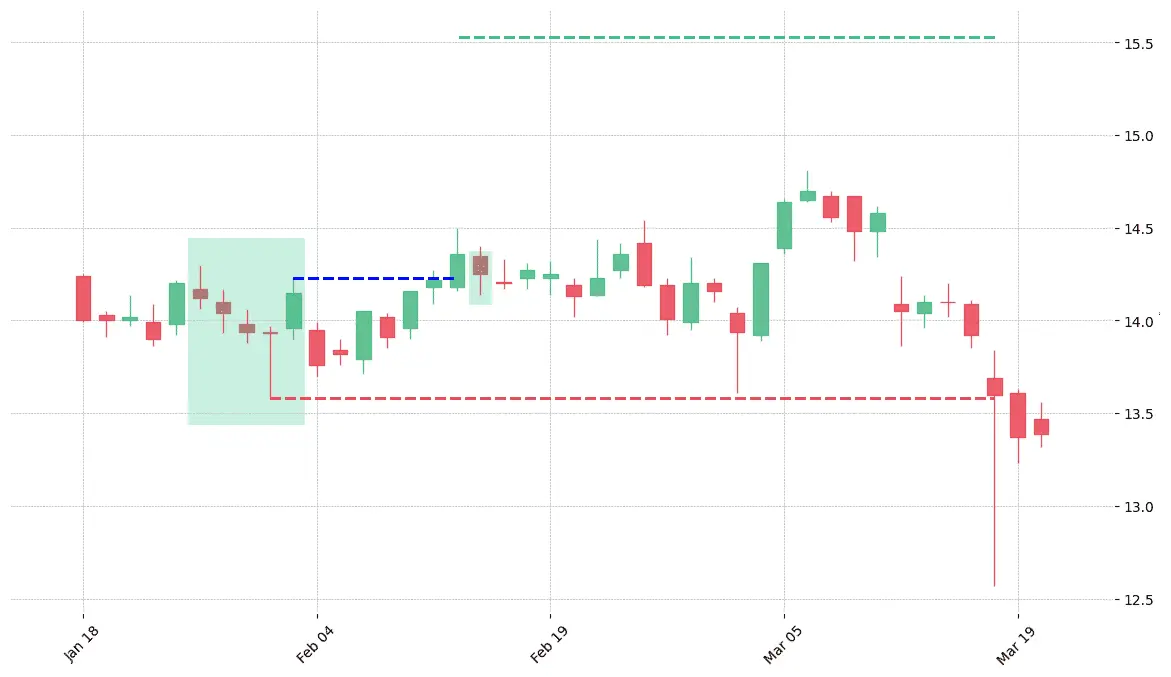
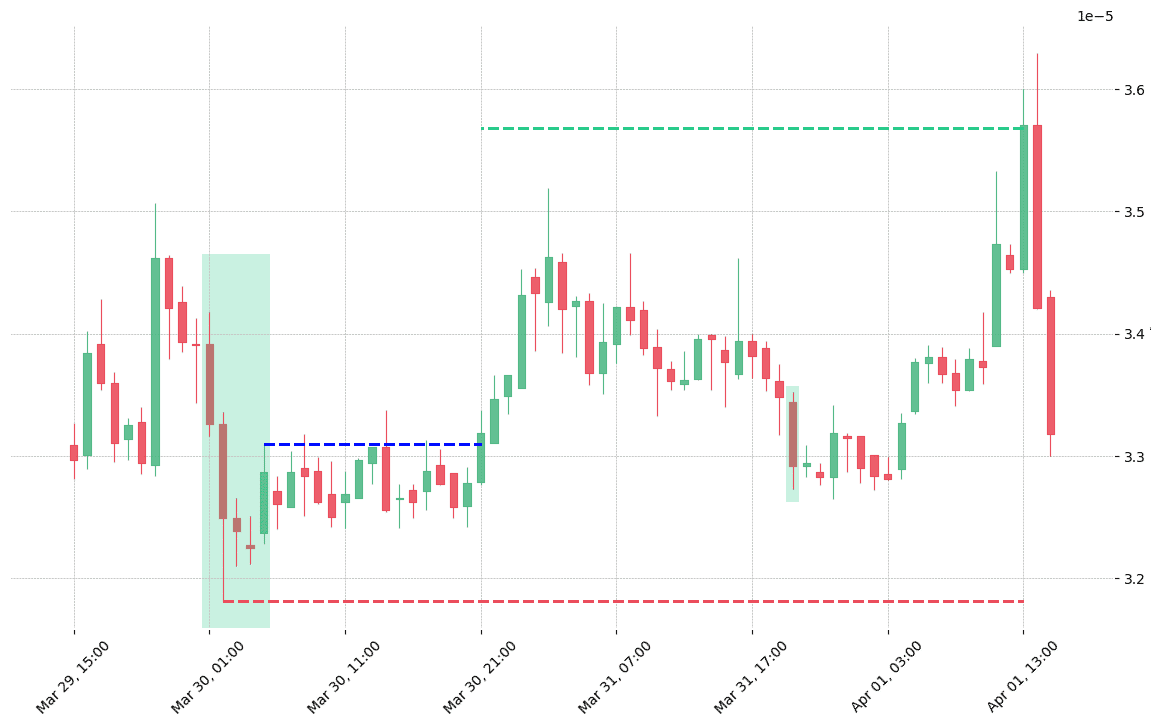
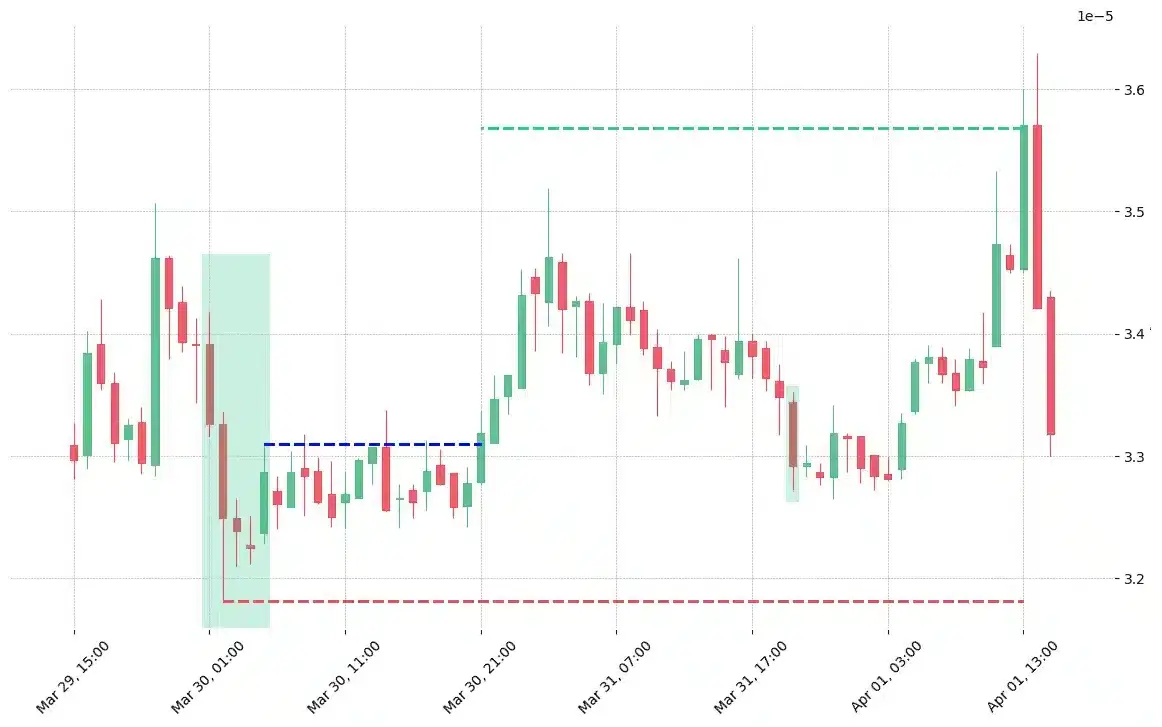
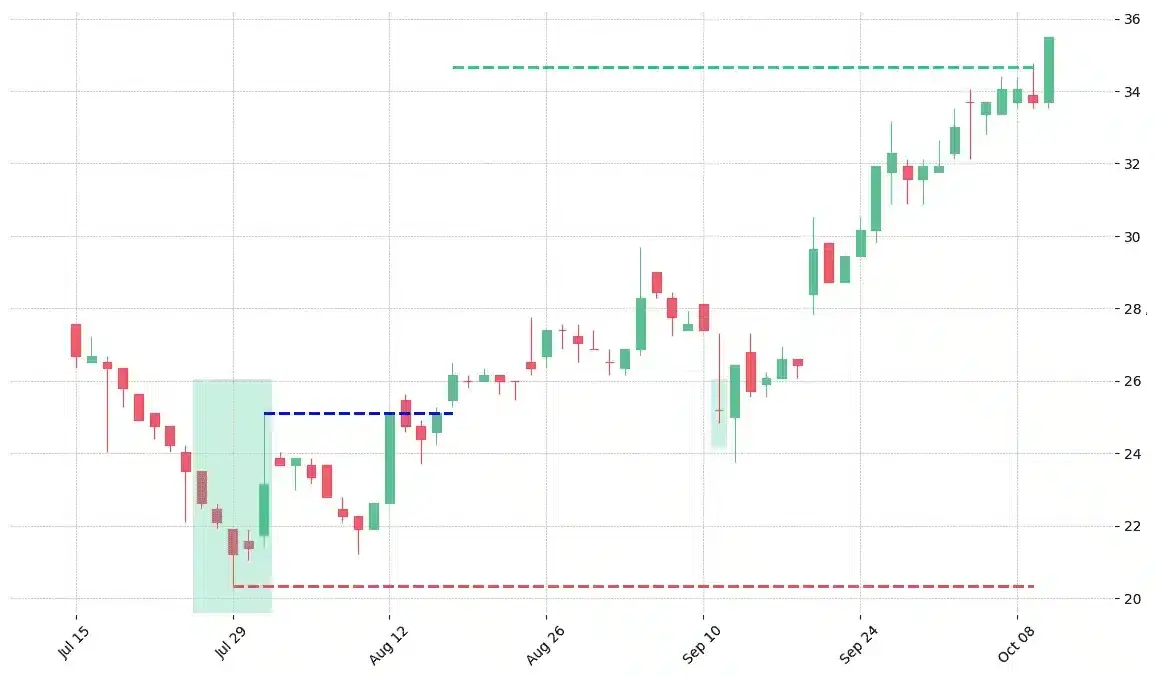
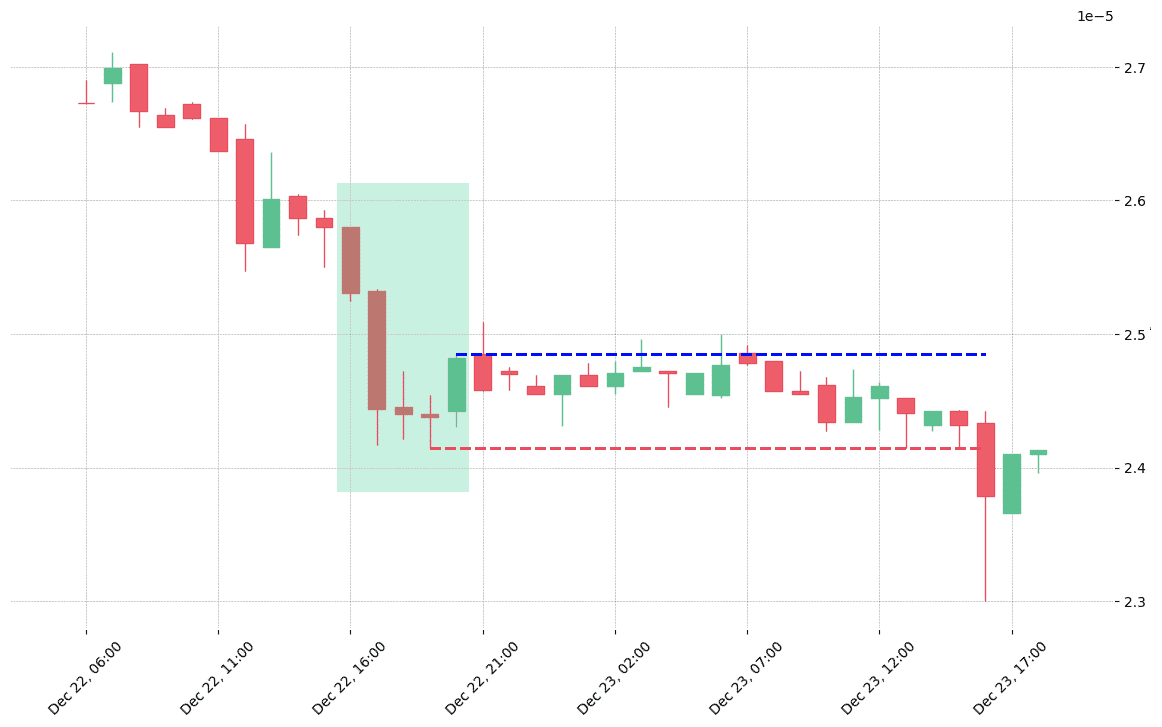
How does the Ladder Bottom pattern look in real life?

The cryptocurrency pair QLC/BTC printed a bullish Ladder Bottom on 2018-10-15 15:00:00. It confirmed on 2018-10-16 08:00:00 (meaning price closed above entry level). It retested the trade entry level on 2018-10-16 13:00:00. Then it failed to reach the 2:1 R/R target and got stopped on 2018-10-18 17:00:00.
The stock BEN printed a bullish Ladder Bottom on 1990-08-21. It confirmed on 1990-09-19 (meaning price closed above entry level). It retested the trade entry level on 1990-09-20. Then it failed to reach the 2:1 R/R target and got stopped on 1990-10-15.
The stock CDNS printed a bullish Ladder Bottom on 2013-01-28. It confirmed on 2013-02-12 (meaning price closed above entry level). It retested the trade entry level on 2013-02-13. Then it failed to reach the 2:1 R/R target and got stopped on 2013-03-18.
The stock CMA printed a bullish Ladder Bottom on 2012-07-30. It confirmed on 2012-08-15 (meaning price closed above entry level). It retested the trade entry level on 2012-08-16. Then it failed to reach the 2:1 R/R target and got stopped on 2012-10-23.
The stock DXC printed a bullish Ladder Bottom on 1995-10-24. It confirmed on 1995-11-10 (meaning price closed above entry level). It retested the trade entry level on 1995-11-13. Then it failed to reach the 2:1 R/R target and got stopped on 1996-01-10.
The stock MAS printed a bullish Ladder Bottom on 1994-07-25. It confirmed on 1994-08-17 (meaning price closed above entry level). It retested the trade entry level on 1994-08-23. Then it failed to reach the 2:1 R/R target and got stopped on 1994-09-26.
The stock NLOK printed a bullish Ladder Bottom on 2009-10-23. It confirmed on 2009-11-18 (meaning price closed above entry level). It retested the trade entry level on 2009-11-19. Then it failed to reach the 2:1 R/R target and got stopped on 2010-05-07.
The stock TFX printed a bullish Ladder Bottom on 2004-08-04. It confirmed on 2004-08-27 (meaning price closed above entry level). It retested the trade entry level on 2004-08-30. Then it failed to reach the 2:1 R/R target and got stopped on 2004-09-20.
The stock TTWO printed a bullish Ladder Bottom on 2008-03-07. It confirmed on 2008-03-25 (meaning price closed above entry level). It retested the trade entry level on 2008-03-26. Then it failed to reach the 2:1 R/R target and got stopped on 2008-07-02.
The cryptocurrency pair AST/BTC printed a bullish Ladder Bottom on 2018-03-30 01:00:00. It confirmed on 2018-03-30 21:00:00 (meaning price closed above entry level). It retested the trade entry level on 2018-03-31 20:00:00. Then it successfully reached the 2:1 R/R target.
The stock COO printed a bullish Ladder Bottom on 1986-07-25. It confirmed on 1986-08-18 (meaning price closed above entry level). It retested the trade entry level on 1986-09-11. Then it successfully reached the 2:1 R/R target.
The cryptocurrency pair VIA/BTC printed a bullish Ladder Bottom on 2019-12-22 16:00:00. Unfortunately it invalidated on 2019-12-23 16:00:00 before the trade could trigger (it triggered the stop before entering).
The stock AES printed a bullish Ladder Bottom on 2010-02-03. Unfortunately it invalidated on 2010-03-01 before the trade could trigger (it triggered the stop before entering).
The stock SYK printed a bullish Ladder Bottom on 2018-11-19 14:30:00. Unfortunately it invalidated on 2018-11-20 14:30:00 before the trade could trigger (it triggered the stop before entering).
The stock VFC printed a bullish Ladder Bottom on 1994-04-13. Unfortunately it invalidated on 1994-05-09 before the trade could trigger (it triggered the stop before entering).

Looking to learn more about this pattern?
You should take a look at Joe Marwood's online course. In his course, he backtested the 26 main candlestick patterns before to summarize which one is THE best pattern. I really liked his course and you shouldn't miss it!
Click here to signup to his "Candlestick Analysis For Professional Traders" course now!

Russell Crane

Russell Crane

Russell is an Algorithmic & Technical Analyst Trader @ PatternsWizard.
His passion is to share his knowledge about TA, patterns & more. Why hope for your trading to work when you can precisely know the performance stat of every pattern?

Are Candlestick Patterns Reliable

candlesticksWe loved Marwood Research’s course “Candlestick Analysis For Professional Traders“. Do you want to follow a great video course and deep dive into 26 candlestick patterns (and compare their success rates)? Then make sure to check this course!

Want to know which markets just printed a Ladder Bottom pattern?

Market Timeframe Printed on

Get “Every Candlestick Patterns Statistics”, The Last Trading Book You’ll Ever Need! 📖

PatternsWizard book - Every Candlestick Patterns Statistics

"Every Candlestick Patterns Statistics", the last trading book you'll ever need!

Pre-register now and receive the candlestick patterns statistics ultimate ebook for free before anyone else!

"All you need is one pattern to make a living."
- Linda Raschke

Awesome move! We are giving the last touch to the "Every Candlestick Patterns Statistics" book. We are very excited to send it to you right when it's ready. In the meantime, we'd like to gift you our trading roadmap and its best 55 resources. You'll shortly receive an email with the link. Don't miss it ;) Stay tuned 📈