
 Good Trading requires the Best Charting Tool!
- The Three Stars in the South candlestick pattern is a very rare pattern that doesn’t typically precede large price moves.
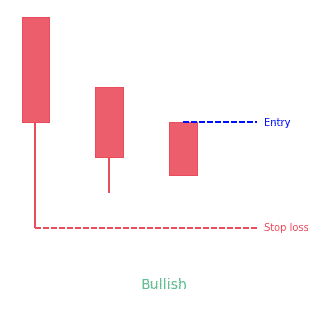
- The bullish pattern forms with three black or red (down) candles of decreasing size. It usually follows a price decline.
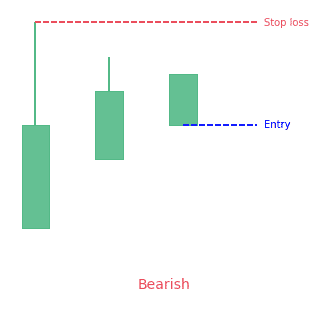
- The bearish pattern forms with three white or green (up) candles of decreasing size. It usually follows a price increase.
Statistics to prove if the Three Stars in the South pattern really works
Are the odds of the Three Stars in the South pattern in your favor?
How does the Three Stars in the South behave with a 2:1 target R/R ratio?
From our research the Three Stars in the South pattern confirms 61.1% of the time on average overall all the 4120 markets we analysed. Historically, this patterns confirmed within 1.8 candles or got invalidated within 4 candles. If confirmed, it reached the 2:1 R/R target 40% of the time and it retested it's entry price level 95.5% of the time.
Not accounting for fees, it has an expected outcome of 0.2 $/$.
It means for every $100 you risk on a trade with the Three Stars in the South pattern you make $20 on average.
Want to account for your trading fees? Have the detailled stats for your favorite markets / timeframes? Or get the stats for another R/R than 2:1?
🚀 Join us now and get fine-tuned stats you care about!
How to handle risk with the Three Stars in the South pattern?
We analysed 4120 markets for the last 59 years and we found 36 occurrences of the Three Stars in the South pattern.
On average markets printed 1 Three Stars in the South pattern every 433 394 candles.
For 2:1 R/R trades, the longest winning streak observed was 3 and the longest losing streak was 3. A trading strategy relying solely on this pattern is not advised. Anyway, make sure to use proper risk management.
Keep in mind all these informations are for educational purposes only and are NOT financial advice.
If you want to learn more and deep dive into candlestick patterns performance statistics, I strongly recommend you follow the best available course about it. Joe Marwood (who's a famous trader with more than 45 000 Twitter followers) created an online course called "Candlestick Analysis For Professional Traders" in his Marwood Research University. There he will take you through the extensive backtesting of the 26 main candlestick patterns. He then summarizes which one is THE best pattern. Do you know which one it is?
Remember, don't trade if you don't know your stats. Click here to signup to the course now!
What is the Three Stars in the South candlestick pattern?
The three stars in the south is a bullish reversal pattern made up of three candles, and it comes up on candlestick charts. It may appear after a price fall, and it indicates that the bearishness is reducing. The pattern is very rare, it doesn’t appear easily.
It is discovered when during a downtrend, a long bearish candlestick with a long lower shadow is preceded by a smaller version of the initial candlestick with a lower high and a higher low, followed by a small black Marubozu which starts and ends in the range of the initial candlestick. It is necessary to remember that every price range is completely covered by the range of the previous candle.
How to identify the Three Stars in the South pattern?
4 characteristics
The pattern has four characteristics:
- The market has to be in a downtrend
- The first candlestick is black, with a long real body, long lower shadow, and it lacks an upper shadow
- The second candlestick is black with a shorter real body and a low that’s higher than that of the first low candle
- The third candlestick is black with a short real body, without shadows, and a close that is within the second candle’s high-low range
The theory behind the pattern is that bears are slowly losing strength, since each of the three candles advances, which eventually causes the bulls to attempt a rally to reverse the trend.
A lot of traders observe to see a confirmation after the pattern forms. The confirmation, in this instance, should be the price going higher after the pattern, since that is what the pattern is supposed to show. If the price declines following the pattern, it is not a bullish reversal, but rather a bearish continuation chart pattern.
Practical advices
Practically, it is hard to get this pattern on candlestick charts. The reversals can also be relatively muted, which means little upside for traders betting on a rally. This pattern, as well as other candlestick patterns, doesn’t have a profit goal. So, even if they are efficient, and the price rises after the pattern forms, in this case, there is no indication of how far it will increase.
Traders could make use of the pattern as an indication to leave a short position or to enter a long position, although ideally going in on the confirmation bar as the price starts to rise is preferred by traders. Also, traders should look for confirmations by using other chart patterns or technical indicators to support a reversal theory.
For instance, if a stock is trending higher but has recently gone through a pullback, a trader could watch for three stars in the south pattern together with a bullish stochastic crossover in oversold areas. All used together, these pieces of information create a more convincing trade idea, particularly if the three stars in the south is followed by any bullish confirmation candlesticks.
What does the Three Stars in the South tell traders?
A strong and consistent downtrend lays the foundation for this candlestick pattern. But a crack shows up in this foundation when the pattern is seen. With each new candle that is formed in the three-candle signal, the downtrend loses strength. The momentum of the bears deteriorates, and the candlesticks get shorter and shorter, reducing the power of the downward movement.
Even though every day ends lower than the previous, the bears are making less progress than they were initially. Every candle covers the subsequent candle. Therefore, traders predict that the prevailing downtrend will change direction and form an uptrend. At any period, the bulls should step-in to raise the price again. Higher prices will soon appear.
When you notice this pattern, you know that a change is on the horizon. As the downtrend reduces, the chance of a reversal increases. Even though this is not a particularly dependable bullish reversal pattern, it proves greatly uncommon. Thus, if you notice it, thank your lucky stars!
Also, confirm by waiting for the price to cross above the middle of the last black body. When you see this, you can confidently say that the bulls have taken control of the reins and an uptrend will occur.
How to trade when you see the Three Stars in the South candlestick pattern?
The markets shows the trade
Let’s imagine a commodity is engaged in an active downtrend, with confident bears looking for decreased prices. The first candlestick in the pattern confirms this view with a sizable drop in price. The bulls can only draw slight optimism from this candlestick, which is that it closes below the low of the day.
On the next candlestick, the commodity opens above the low of the first candle and doesn’t post a new low. The close lower than the open also reduces bull confidence.
The commodity opens higher on the third candlestick in a show of renewed bull commitment, but again, they fail to capitalize on the drop in price. Bears fail to reduce the security to a new low once more, showing a decrease in selling power. The three bars form a small pennant pattern, showing that the bears are tired while bulls now have an opportunity to begin a rally. The rally can only start if the price goes higher following the pattern.
Signals come with meanings
The three stars in the south candlestick pattern reflect a slowly decreasing downtrend. It is characterized by decreasing daily price ranges and consecutively higher lows. Buying enthusiasm is shown by the long lower shadow of the first trading day. The next day opens at a higher level, trades lower, but its low is not lower than that of the previous day. This second day also closes off its low. Then we notice a small black Marubozu forming on the third day, which is engulfed by the range of the previous day.
Higher lows make shorts uneasy. The last day of the pattern shows market indecision with rarely any movement in price. Shorts are now ready to take positions if they see anything in the upside. Everything points out that the tide is slowly changing direction towards the side of the bulls.
Examples and trades are difficult to come by with this pattern because it is rare. Ideally, the pattern has no shadows. Also, the third candle makes a slightly higher high than the prior candle. Also, the third candle should be contained within the second candle.
Buy/Stop-Loss
The confirmation level is seen as the middle of the last black body. Prices should cross over this level for confirmation.
The stop-loss point is defined as the lower of the last two lows. Following the buy, if prices go down rather than increase, and close or make two consecutive daily lows below the stop-loss point, while no bearish pattern is detected, then the stop-loss is triggered.
Difference between Three Stars in the South and Three Black Crows
Three black crows is a bearish reversal pattern that forms after a price advance. It is formed by three long black candles (facing downwards), with the second and third candles opening within the real body of the previous candle and ending lower than they opened and below the prior close.
Limitations of the Three Stars in the South candlestick pattern
It is a very rare pattern, and it also doesn’t produce big moves after it forms, which means it is not particularly important for trading purposes. The pattern doesn’t have a profit objective; so, it is up to the trader to know how they will leave a profitable trade.
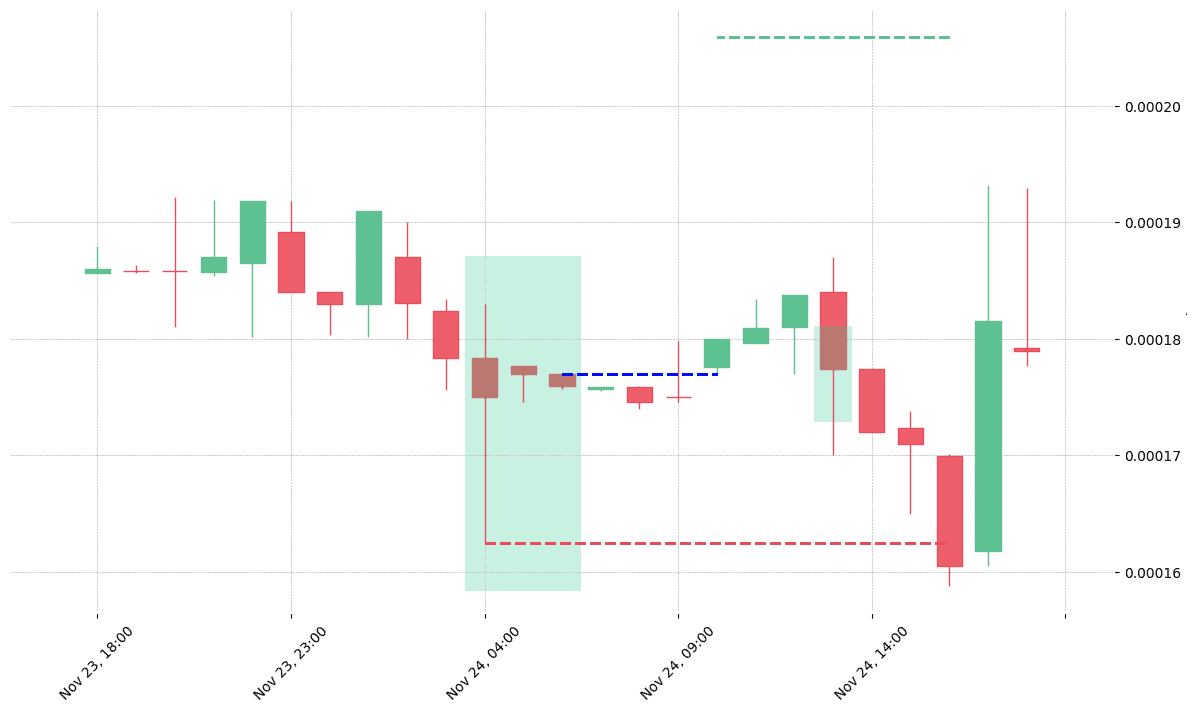
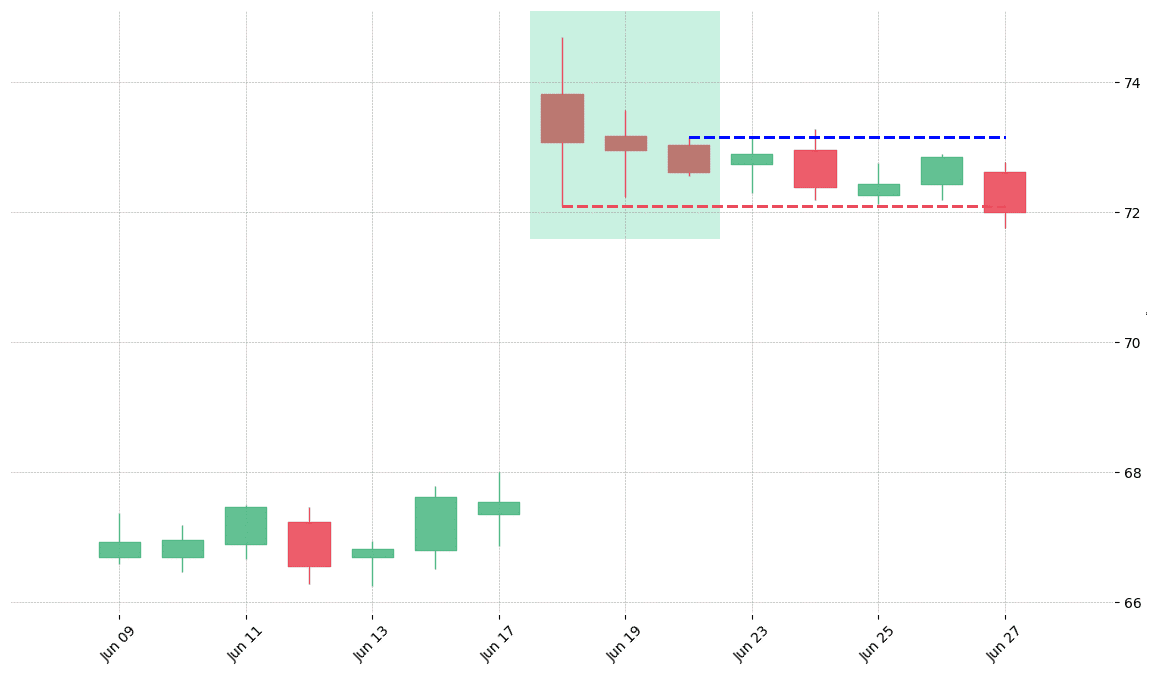
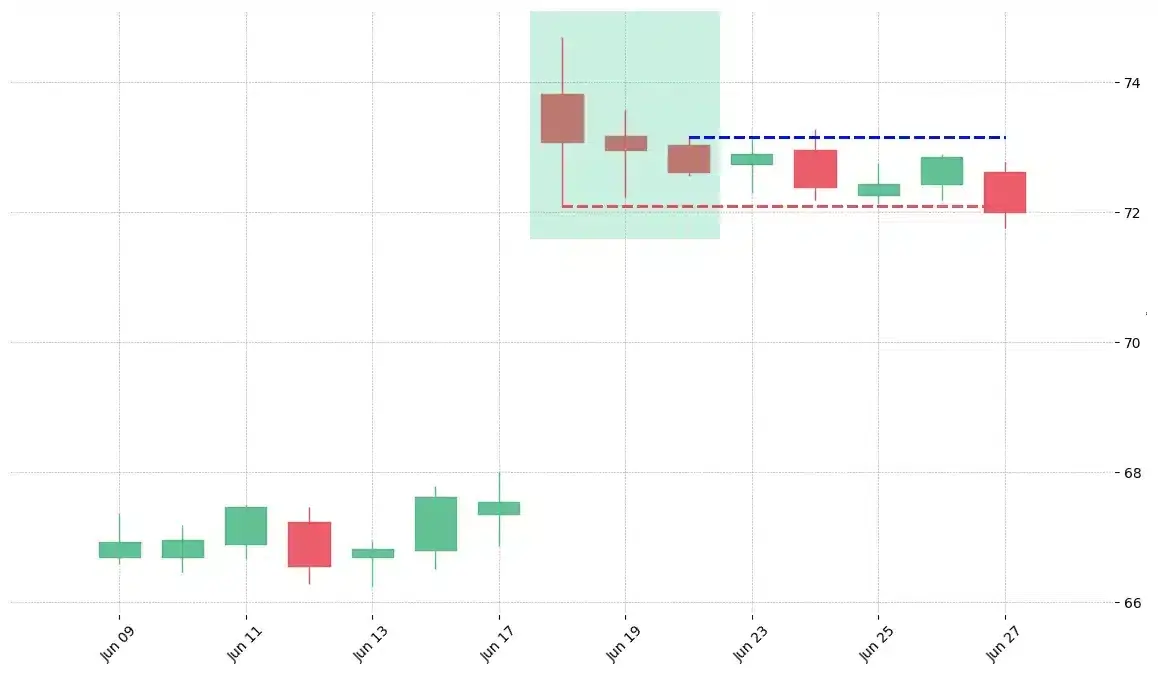
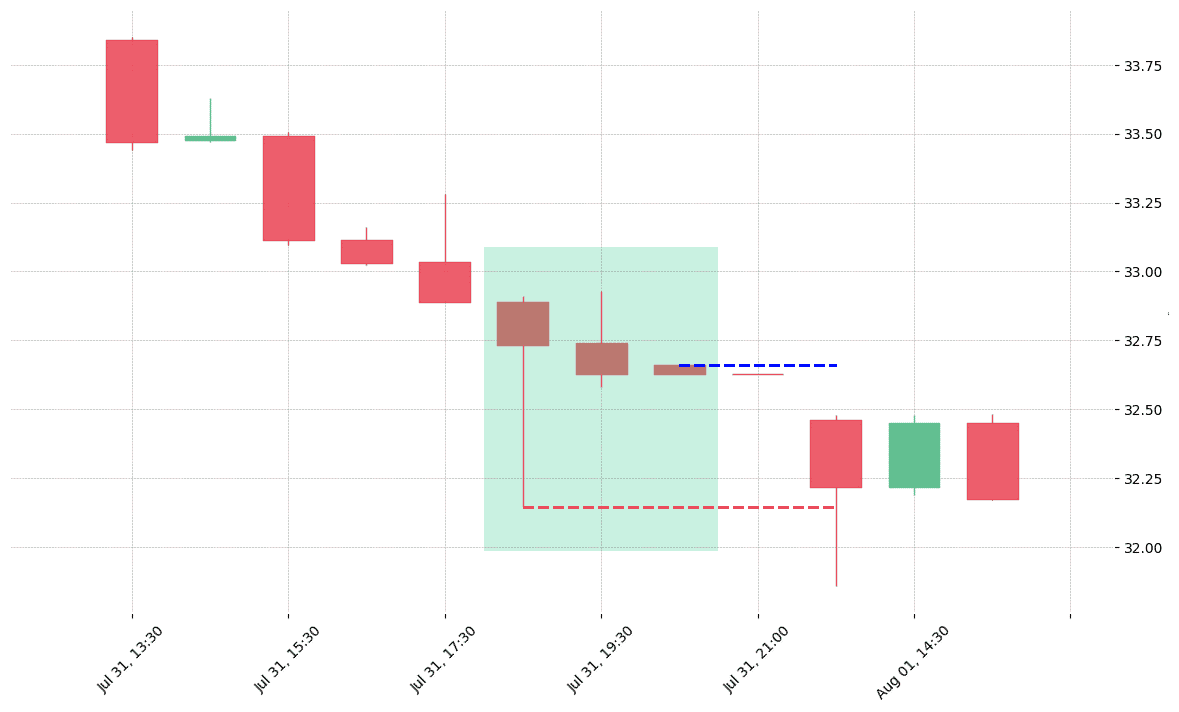
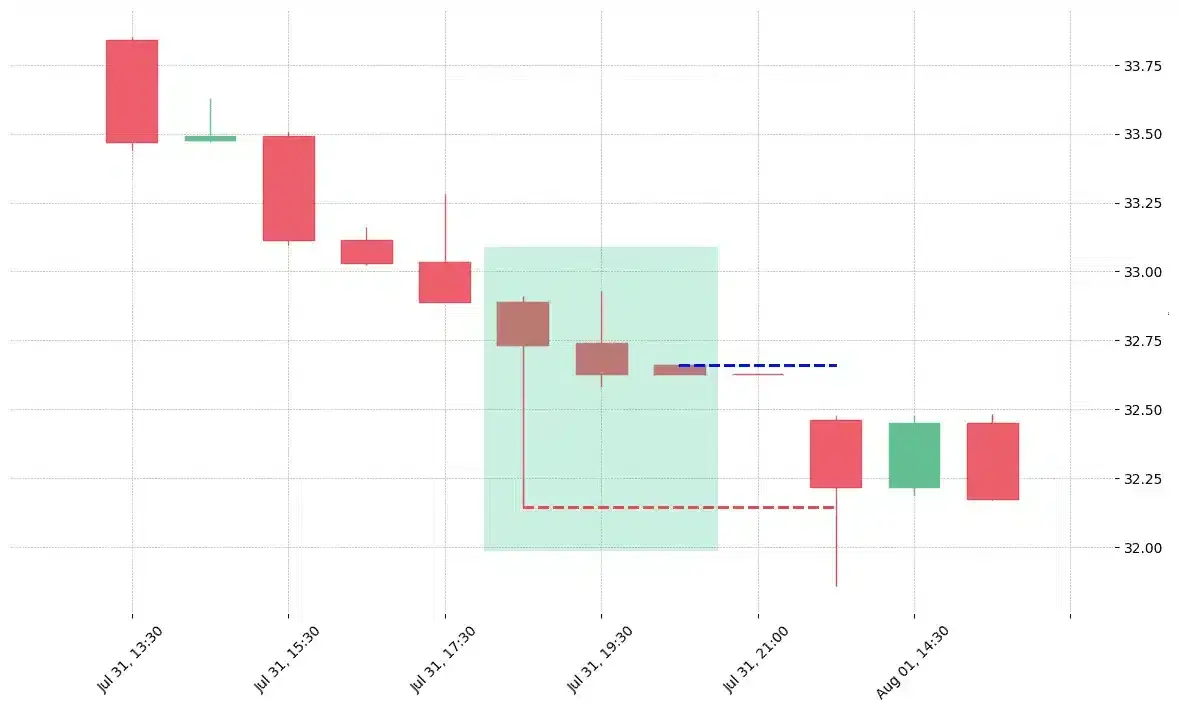
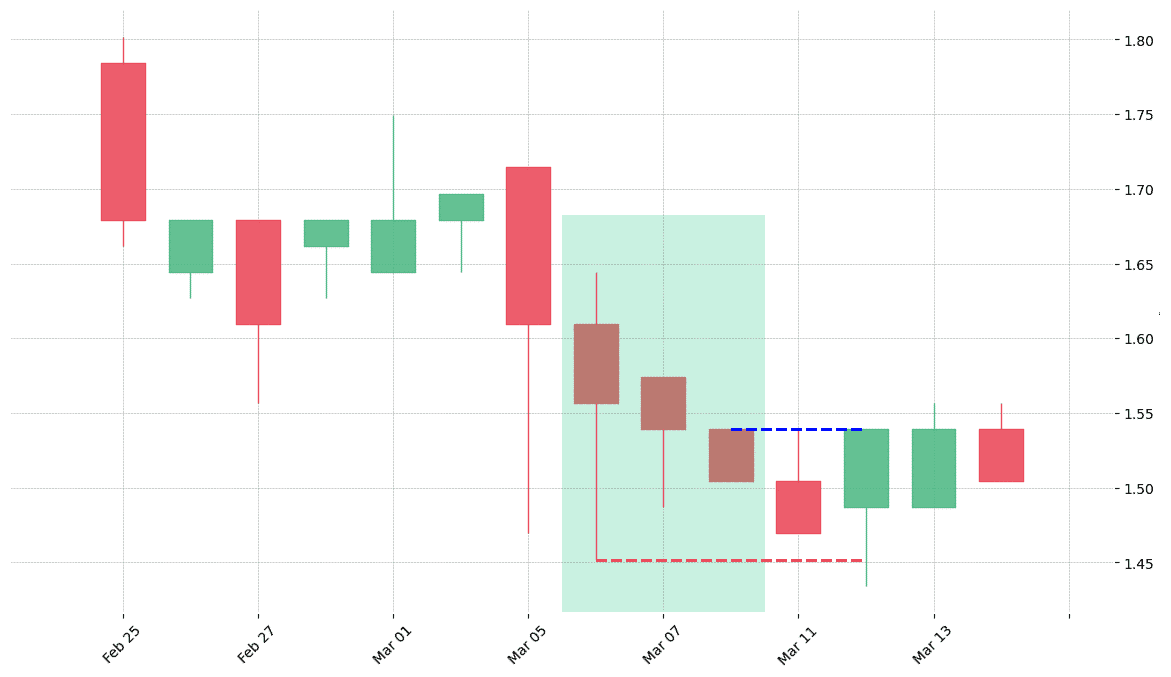
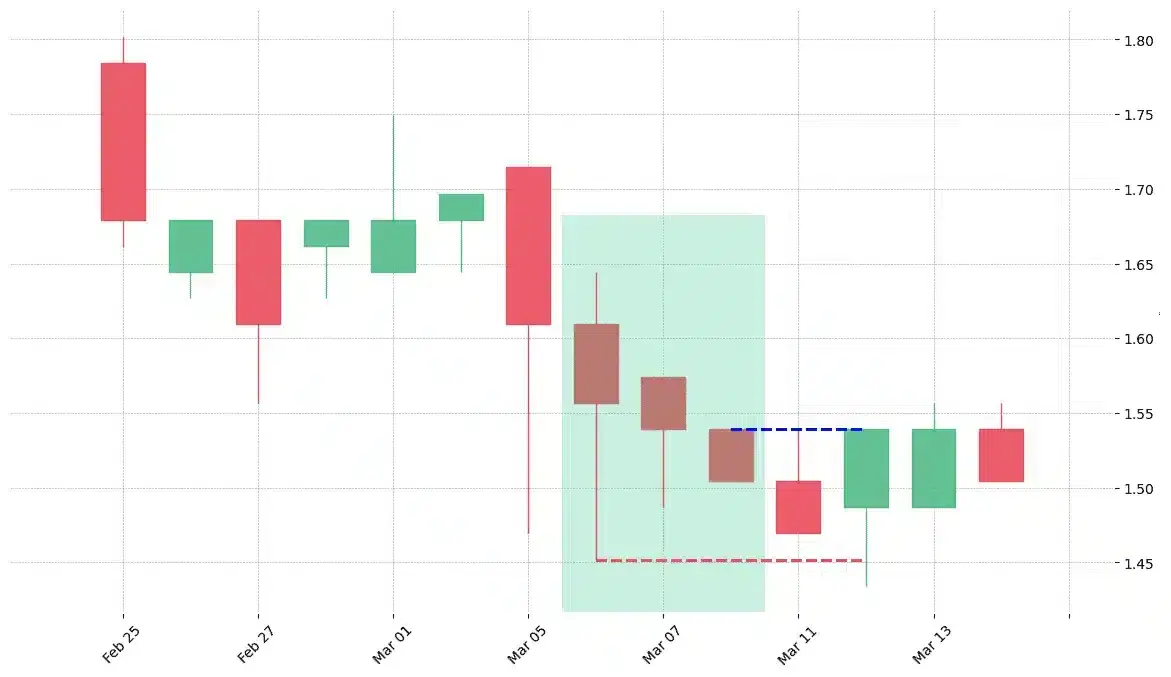
How does the Three Stars in the South pattern look in real life?

Looking to learn more about this pattern?
You should take a look at Joe Marwood's online course. In his course, he backtested the 26 main candlestick patterns before to summarize which one is THE best pattern. I really liked his course and you shouldn't miss it!
Click here to signup to his "Candlestick Analysis For Professional Traders" course now!


 We loved Marwood Research’s course “Candlestick Analysis For Professional Traders“. Do you want to follow a great video course and deep dive into 26 candlestick patterns (and compare their success rates)? Then make sure to check this course!