
 Good Trading requires the Best Charting Tool!
- The AB=CD harmonic is reversal pattern
- Depending on the context, it can be bullish or bearish
- It should follow specific fibonnaci ratios :
- BC is the 61.8 percent Fibonacci retracement of AB
- CD is the 127.2 percent Fibonacci extension of BC
Interested in learning more about harmonics pattern in general?
You’ll love this two courses I shortlisted for you on Udemy:
- Forex Harmonic Pattern Trading – With Multiple Chart Examples: it’ll teach you step-by-step how to identify most harmonic pattern applied to forex markets.
- Harmonic Trading: The Art Of Trading With Low Risk: it’ll guide you to your first harmonic trades, what are potential reversal zones and it’ll give you practical applications so you can truly understand how to use it and manage your risk.
If you prefer to skip the learning part and are just looking for a harmonic patterns scanner, you might want to check this harmonic patterns screener here. You’ll get a 7-days free trial (+ 50% off your 1st month subscription if you decide to continue).
Or you can just continue reading and learn more with our article below about AB=CD patterns.
What is the AB=CD trading pattern?
Created by Larry Pesavento and Scott Carney, after being discovered originally by H. M. Gartley, the AB=CD trading pattern has become very effective as a trading technique for technical traders. This trading pattern helps you to identify when the price is about to change direction. The idea is that you can purchase when the price is low and about to rise or sell when the price is high and is about to go down. It is a well-known harmonic group of patterns. Some traders sometimes also refer to it as ABCD pattern.
The AB=CD pattern is considered the simplest harmonic pattern because it has significantly less requirements than most of the other harmonic setups. In addition to that, the AB=CD formation is much easier to detect on the price chart. After weeks of research, back testing and live trading, experts feel comfortable to recommend this setup to traders.
There are two types of AB=CD harmonic patterns
There are two types of AB=CD trading patterns – the bullish AB=CD and the bearish AB=CD.
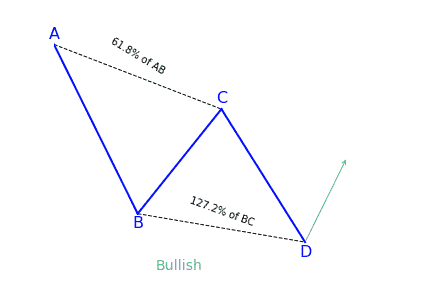
Bullish AB=CD
This pattern begins with a decrease in price (AB), followed by a reversal and a rise (BC). The BC move then reverses into a new bearish move (CD), which goes below the bottom made at point B. It is expected that there will be a reversal and an increase in price after the price completes the CD move.
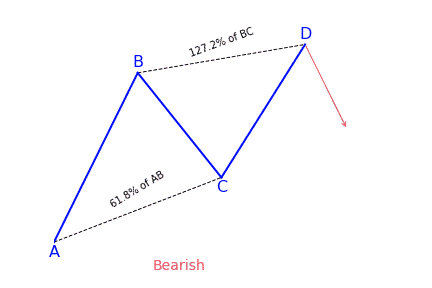
Bearish AB=CD
This chart pattern is the same as the bullish AB=CD pattern, but it is upside down. The pattern starts with a bullish AB line, which can be reversed by a new bearish move. The BC move then gets reversed by a new bullish move, which goes above the top point. After noticing these qualities, traders can expect the price to reverse again, creating a new bearish run.
How does Fibonacci Ratios integrate with the pattern?
This pattern needs to conform to particular Fibonacci ratios. Usually, there are two Fibonacci rules associated with the ABCD figure:
- BC is the 61.8 percent Fibonacci retracement of AB
- CD is the 127.2 percent Fibonacci extension of BC
When trading the ABCD pattern, always conform to the Fibonacci levels. There are various indicators to assist you in confirming the patter requirements.
What does the AB=CD trading pattern tell traders?
Usually, the price action behavior of the ABCD pattern begins with the price going in a new direction A, which later creates a swing level B, then retraces a portion at C, and finally resumes to take out the important swing at the second position. It continues until it gets to a distance equivalent to AB or D. When the CD portion gets to an equivalent distance to AB, it is expected that there will be a reversal of the CD price move. At the same time, BC and CD will respond to particular Fibonacci levels.
When there’s a confirmation of AB=CD pattern, traders look to set entry points on the chart at the beginning of the emerging reversal after the CD move. The idea is to enter the market early enough with a trading position just after the reversal of the CD move.
How to trade the AB=CD harmonic trading pattern?
General principle
Trading the ABCD pattern involves rules meant to guide people on how to enter trade, lock potential profits and exit with minimum loss if the market follows the opposite direction. The entry of a trade, whether buy or sell, triggers when the pattern is in place.
After the AB=CD harmonic pattern has been identified, you can start looking for a trading opportunity at point D. The buy and sell signals are generated after the final C to D leg, when a reversal is expected to occur. If the pattern is trending higher, traders can look to sell or enter a short position at point D. If the pattern is trending lower, it is advisable to buy the security at point D in anticipation of a turnaround.
Protect your trade
It is best to place stop-loss points just above or below point D, depending on the direction of the trade. If the move goes beyond that point, the chart pattern is invalidated and the reversal is less likely to happen. Take-profit points are placed by using the Fibonacci levels. For instance, traders might look for a move back to the original point A and move a trailing stop-loss to 28.2, 50, and 61.8 percent Fibonacci levels along the way.
Follow your strategy
Just as it is with other technical analysis, the AB=CD chart pattern best works when used along with other chart patterns or technical indicators. Also make use of volume as a confirmation of a reversal once the AB=CD pattern makes a prediction.
Study the chart looking at the highs and lows of the price. Observe the price as it forms AB and BC. For a bullish ABCD pattern, C has to be lower than A and should be the intermediate high after the low at B. Point D has to be a new low below B.
When the market gets to a point where D may be found, don’t rush into a trade. Make use of some techniques to ensure that the price reversed up, or down for a bearish ABCD. The best scenario is a reversal candlestick pattern. You can set a buy order at or over the high of the candle at point D.
Setting a profit target for your trade
One way of deciding where to take profits is by drawing a new Fibonacci retracement point from A to D of the pattern. If you are not sure the point to place your profit, set it at the 61.8 percent level, but closely observe how the price reacts around the levels. If the price finds it difficult to break through any of them, close your trade and take an early profit.
Summary
The AB=CD pattern is one of the most popular harmonic patterns. Since it often appears in practice, traders can use it together with other kinds of technical analysis to improve their chances of success. The secret is matching up Fibonacci levels and setting the right stop-loss and take-profits points to manage the trade. Since their appearance in 1935, harmonic patterns have gained momentum lately and have gone through several refinements. The addition of Fibonacci ratios and projections has given the specifications more detail.
Looking for a way to automatically find harmonic patterns in your favorite markets?
You definitely need a screener for that! Check out this harmonic patterns scanner here!
If you come from us (simply click the link below), you’ll get a 7-days free trial and 50% off your first month’s subscription fee. Don’t think more, go test it out for free now!
Click here to signup and claim your 7-days free trial to the best harmonic pattern scanner.


 We loved Marwood Research’s course “Candlestick Analysis For Professional Traders“. Do you want to follow a great video course and deep dive into 26 candlestick patterns (and compare their success rates)? Then make sure to check this course!