 Good Trading requires the Best Charting Tool!
- The three white soldiers candlestick pattern is a 3-bar bullish pattern.
- It has 3 long green candles, each making new higher high.
- Each candle’s body should be approximately the same size.
Statistics to prove if the Three White Soldiers pattern really works
Are the odds of the Three White Soldiers pattern in your favor?
How does the Three White Soldiers behave with a 2:1 target R/R ratio?
From our research the Three White Soldiers pattern confirms 90.7% of the time on average overall all the 4120 markets we analysed. Historically, this patterns confirmed within 1.8 candles or got invalidated within 11.4 candles. If confirmed, it reached the 2:1 R/R target 33.3% of the time and it retested it's entry price level 98.7% of the time.
Not accounting for fees, it has an expected outcome of -0.001 $/$.
It means for every $100 you risk on a trade with the Three White Soldiers pattern you lose $0.1 on average.
Want to account for your trading fees? Have the detailled stats for your favorite markets / timeframes? Or get the stats for another R/R than 2:1?
🚀 Join us now and get fine-tuned stats you care about!
How to handle risk with the Three White Soldiers pattern?
We analysed 4120 markets for the last 59 years and we found 5 402 occurrences of the Three White Soldiers pattern.
On average markets printed 1 Three White Soldiers pattern every 2 888 candles.
For 2:1 R/R trades, the longest winning streak observed was 8 and the longest losing streak was 22. A trading strategy relying solely on this pattern is not advised. Anyway, make sure to use proper risk management.
Keep in mind all these informations are for educational purposes only and are NOT financial advice.
If you want to learn more and deep dive into candlestick patterns performance statistics, I strongly recommend you follow the best available course about it. Joe Marwood (who's a famous trader with more than 45 000 Twitter followers) created an online course called "Candlestick Analysis For Professional Traders" in his Marwood Research University. There he will take you through the extensive backtesting of the 26 main candlestick patterns. He then summarizes which one is THE best pattern. Do you know which one it is?
Remember, don't trade if you don't know your stats. Click here to signup to the course now!
What is the Three White Soldiers candlestick pattern?
The three white soldiers candlestick pattern is a bullish pattern that appears during a downtrend. It indicates an upcoming reversal of the prevailing downtrend in the market to an uptrend. There are numerous trading chart patterns but really useful are those that are in the right context of the market. The three white soldiers pattern is among those and is one of the most reliable patterns. Gregory L. Morris, a trading legend, in his book “Candlestick Charting Explained” said that the three white soldiers candlestick pattern should not be ignored. He said it was the most reliable and rewarding pattern if traded correctly.
How to identify the three white soldiers candlestick pattern?
The three white soldiers pattern is a pattern with three candlesticks that makes it a challenging pattern to identify. It must have the following characteristics that are hints to identify it as well.
- The three white soldiers candlestick pattern must have three consecutive bullish candlesticks.
- All three candles must open and close higher than the previous candle.
- The body of the second candle must be bigger than the first candle.
- The second and third candles must have approximately the same size.
- All three candles must have no wicks or very small wicks. It indicates that the buyers managed to take control of the market. It shows they were able to close the prices at the high of a candle.
- The three white soldiers pattern forms at a support zone when three consecutive long bullish candles follow a downtrend and signal a time of reversal to rally.
What does the pattern tell traders?
The three white soldiers candlestick pattern is a bullish reversal pattern. It indicates that bears are losing control and a reversal of the trend in the market is very much on cards. In this pattern, each candle must be above the close of the previous candle making a staircase where each step is higher than the previous one. This upward movement of the pattern is in fact an indication of the beginning of an uptrend.
As we have already discussed that the three white soldiers pattern is a very powerful and reliable pattern. It especially is when it is used in conjunction with other indicators such as the Relative Strength Index. Therefore, it is a great tool for trading strategies as well. However, traders should also take other factors such as volume into consideration.
The three white soldiers pattern helps to initiate or exit existing trades. For example, a trader can enter a long position when the three white soldiers candlestick appears on the chart and the next candle shows a gap up opening (the opening price is higher than the close of the previous day). It is also useful for intraday trading where traders can look for the three white soldiers at 5 minutes, 15 minutes, or hourly charts as well. After initiating a long position, it is always prudent to define a stop-loss of the last low and take profit whenever there is any other sign of trend reversal. Although it is quite rare to spot the three white soldiers candlestick pattern but a very useful pattern that traders should never ignore.
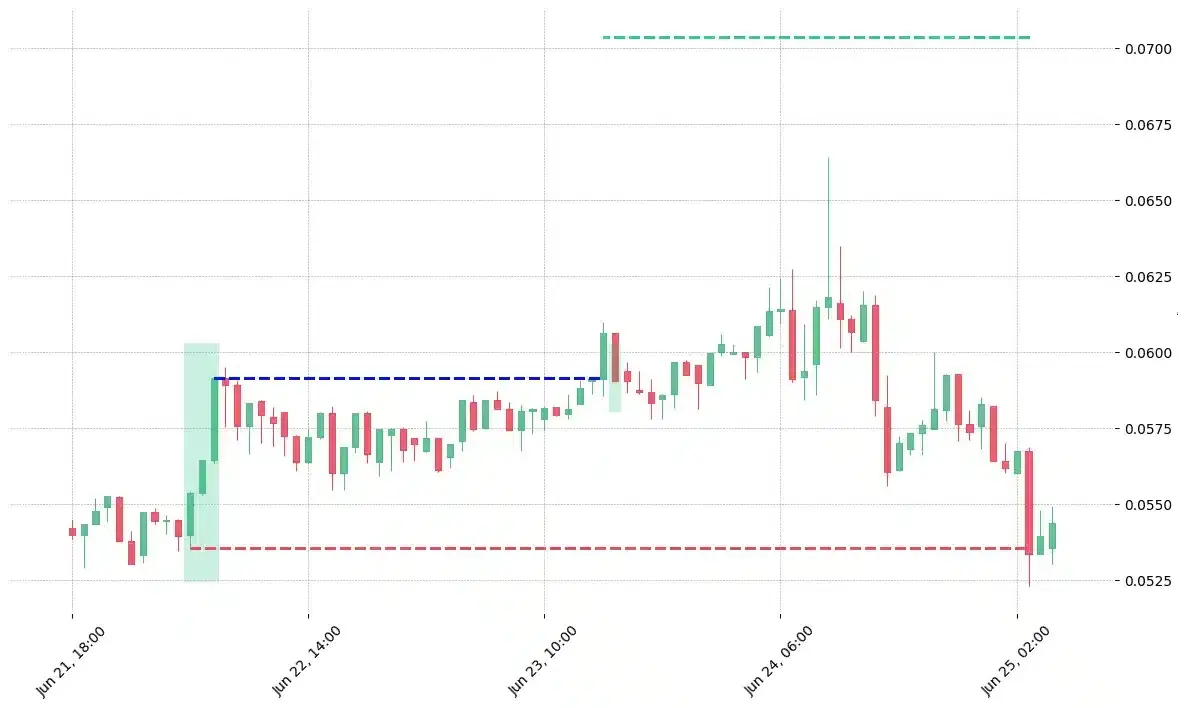
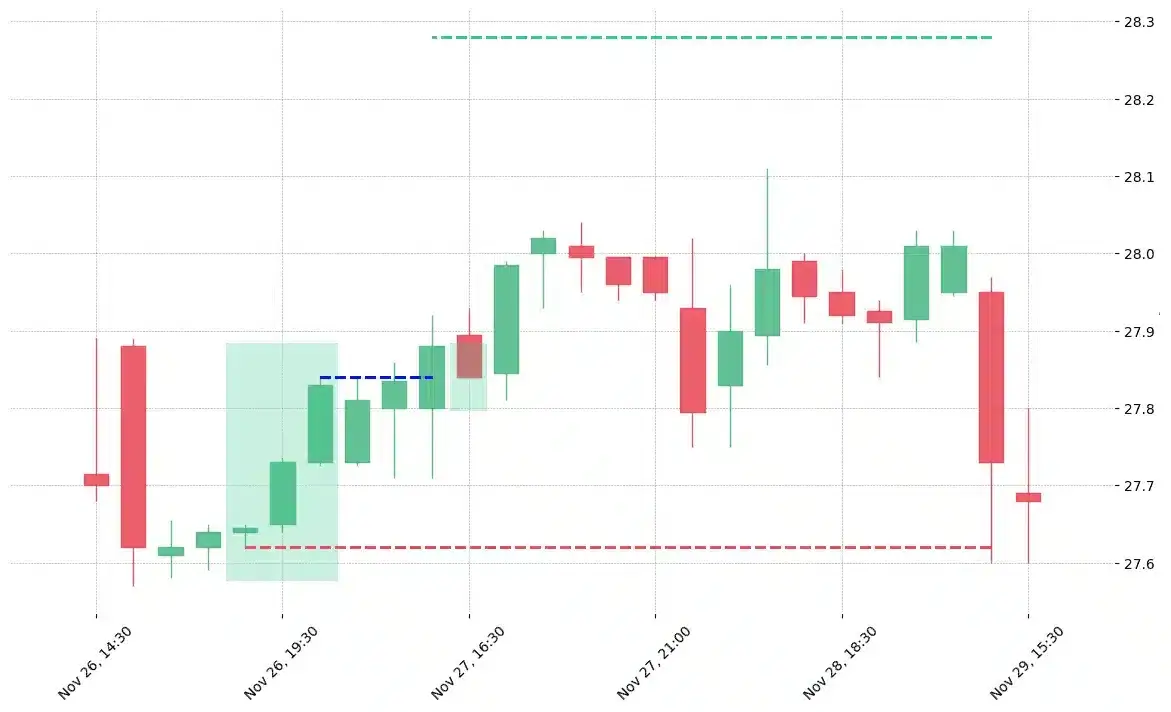
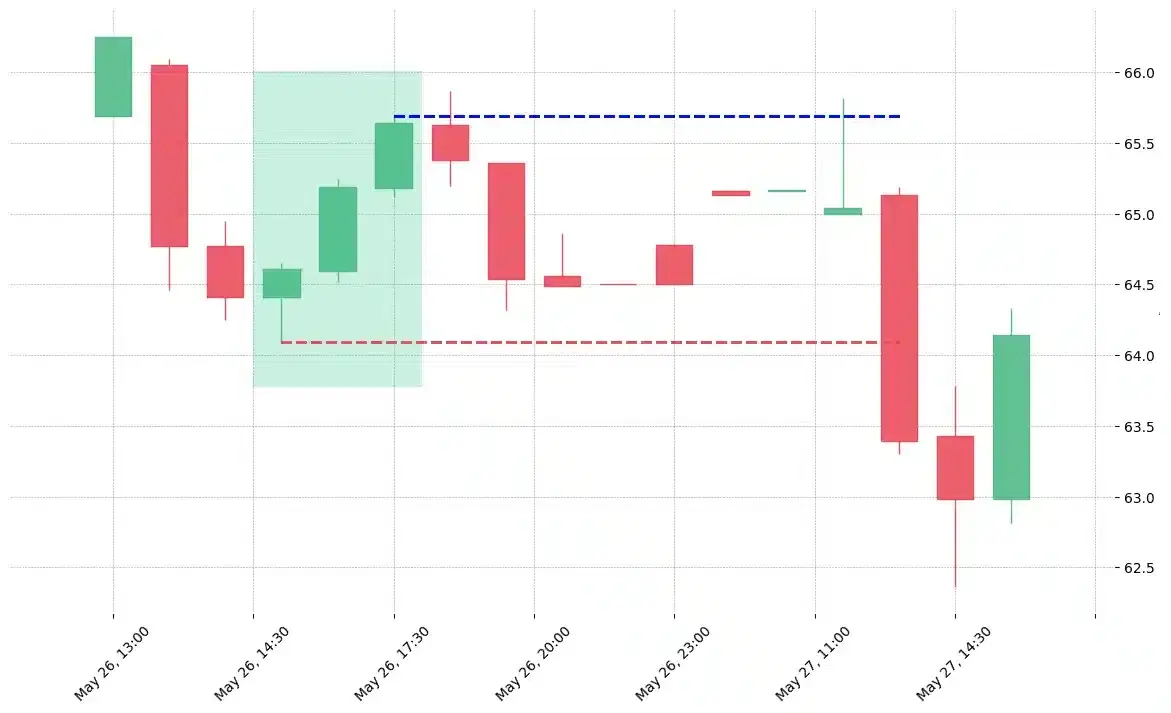
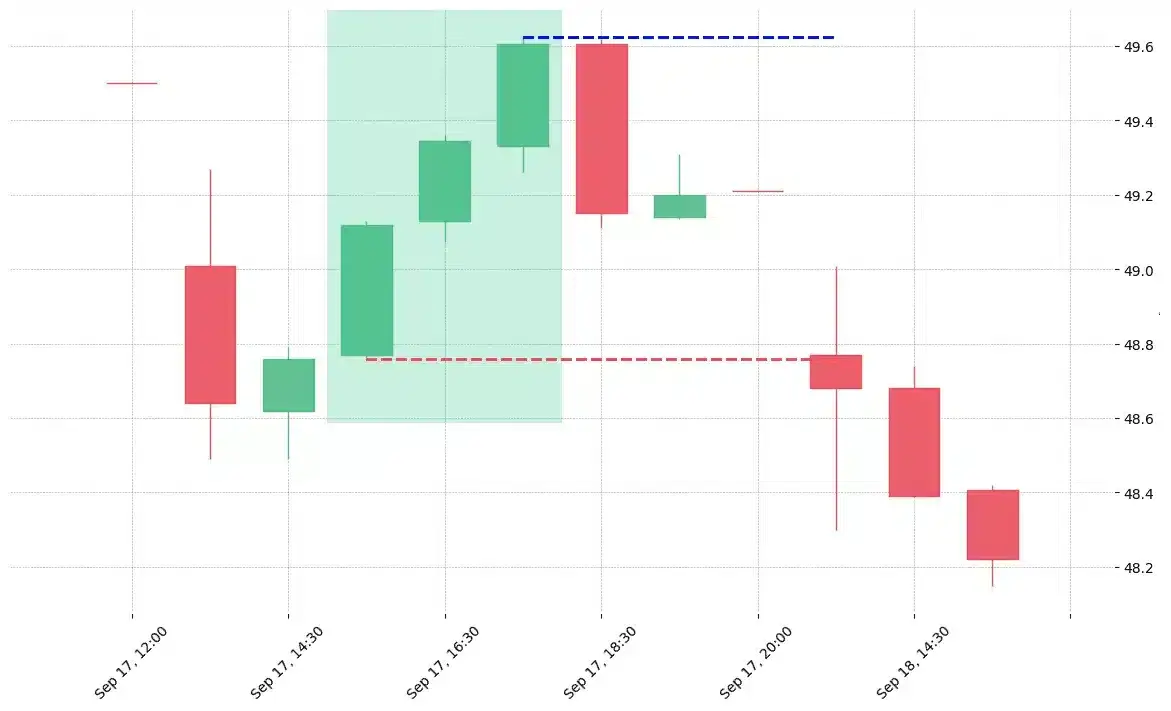
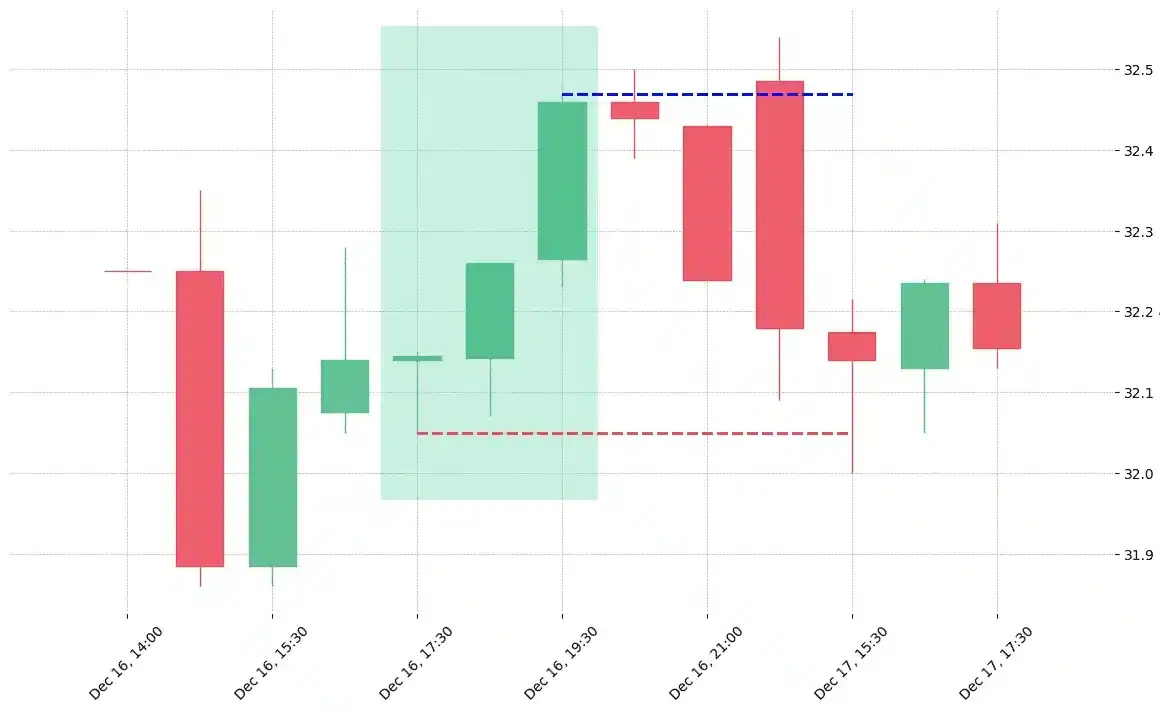
How does the Three White Soldiers pattern look in real life?
Looking to learn more about this pattern?
You should take a look at Joe Marwood's online course. In his course, he backtested the 26 main candlestick patterns before to summarize which one is THE best pattern. I really liked his course and you shouldn't miss it!
Click here to signup to his "Candlestick Analysis For Professional Traders" course now!


 We loved Marwood Research’s course “Candlestick Analysis For Professional Traders“. Do you want to follow a great video course and deep dive into 26 candlestick patterns (and compare their success rates)? Then make sure to check this course!