
 Good Trading requires the Best Charting Tool!
Trading with technical analysis demands traders to depend mostly on a mixture of technical indicators and trade based on the signals from this approach. Apart from using technical indicators, traders also utilize chart patterns to base their trading decisions, whether to sell or buy. In this article, we’ll deep dive into the Three Drives harmonic pattern.
Harmonic trading is an advanced area. Even though it is more difficult than regular technical elements, can show great trading opportunities. Harmonic trading uses structural analysis, Fibonacci ratios, and symmetry. It allows them to describe patterns in the market which tend to yield significant outcomes.
Although chart patterns are more qualitative than other indicators, they can provide great insights into the psychology of the market at any given period, making them necessary tools for traders.
The 3-drive chart pattern is a reversal pattern that is made up of two corrections and three legs, called drives. Traders often refer to it as an ancestor of the Elliott wave pattern, which makes use of a complex series of drives or waves to predict long-term price actions.
- The Three Drives pattern is a harmonic reversal pattern.
- It follows specific fibonacci levels (which you can read more below)
What is the Three Drives pattern?
The three drives pattern is self-sufficient, having different entry and exit points. It is a reversal pattern that is made up of three swings of the same length in the same direction. They correspond to particular Fibonacci ratios to identify potential reversal zones. The pattern can be both bearish and bullish and once discovered, it can be a precursor to strong market turns.
The three drives pattern is a reversal pattern that is made up of various higher highs or lower lows. They complete at a 127 or 161.8 percent Fibonacci extension. It can indicate that the market is exhausted in its recent move and a reversal will probably occur on the price chart. The bullish version of the pattern can help to determine possible buy opportunities and the bearish version can help to determine possible opportunities to sell.
The three drives pattern was first stated by Robert Prechter. It is not often used in trading because it is difficult to discover and less common than other forms of harmonic patterns. It is made up of symmetrical price movements with similar Fibonacci projections in a 5-wave structure.
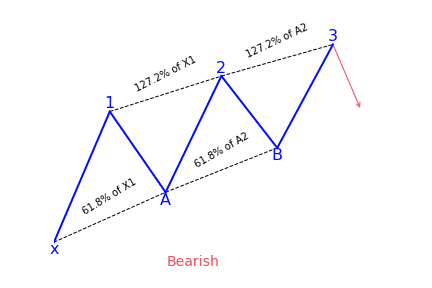
Bearish Three Drives pattern
This pattern begins with the first drive which is a bullish move. Then a lower retracement to give the A point, which should complete into the 6.18 to 78.6 percent retracement of the first drive. From here another move higher will draw, providing the second leg which completes into the 1.27 percent extension of the first drive.
From here, a second retracement lower which should complete into 61.8 to 78.6 percent retracement of the second drive will appear, to give the B point. Lastly, we want to see one final push higher, giving us our third wave, which should complete into the 1.27 percent extension of the second drive, providing the third drive and the level which traders can look to sell.
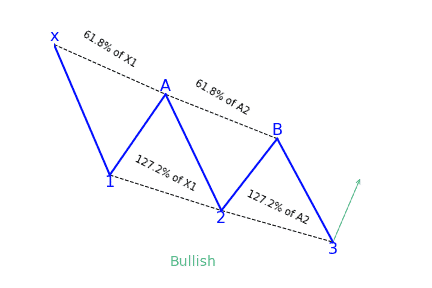
Bullish Three Drives pattern
The pattern begins with a bearish swing to give traders their first drive. Traders can then notice a retracement higher into the 61.8 percent level of the first drive to give traders the A point. From here, the price turns lower again to give the second drive which should complete into the 1.27 percent extension of the first drive.
From here, the price correct higher once more. It goes back up into the 61.8 percent retracement of the second drive to give us our B point. Then there will be one final push lower with price trading down to the 1.27 percent extension of the second drive to give a third drive that completes the pattern and offers a buying zone.
How to identify the Three Drives pattern?
The three drives harmonic pattern is identified by various three higher highs or lower lows. They gather in a reversal of the existing trend. Every move lower or higher is quantified by using the Fibonacci extension and retracement levels of 61.8 and 127.2 percent.
The below rules can help traders identify the pattern:
- Correction A has to be a 61.8 percent retracement of drive 1.
- Correction B has to be a 61.8 percent retracement of drive 2.
- Drive 2 has to be a 1.272 extension of correction A.
- Drive 3 has to be a 1.272 extension of correction B.
In some instances, the definition of the 3-drive pattern may be expanded to include various Fibonacci retracement or extension levels, like a 161.8 percent extension rather than a 127.2 percent extension. The pattern also works without Fibonacci levels, but it may be less accurate.
Traders also need to look at the volume behind every drive higher or lower. If the volume during drives is higher than during corrections, traders can have more confidence in an eventual trend change and capitulation after the last drive. Psychologically, the three drives pattern indicates three last attempts at driving the price lower or higher before capitulation happens and the trend reverses.
What does the Three Drives harmonic pattern tell traders?
The pattern is defined by three unique, consecutive and symmetrical drives to a top or bottom. Symmetry in both time and price is vital. It is critical to not force the pattern on the chart. If you don’t notice it, it is best not to trade it.
A reversal will probably happen when the third drive completes. Conservative traders observe for more confirmation that price is reversing. Traders can set their targets at their discretion, but normally goes beyond the last retracement.
If the pattern doesn’t show up, this could point to a strong continuation in the previously dominant movement. The three drives pattern can either be bearish or bullish.
How to trade when you see the pattern?
The 3-drives pattern frames the trade
To trade the 3-drive pattern effectively, traders look to taking a position in the market on the third drive. This provides the most accurate price levels of where to enter the trade. It also gives the best potential to have a profitable trade.
The third drive mostly advances to a Fibonacci extension of 127.2 percent of the drive C. Some traders prefer to place their take-profit levels to the 161.8 percent of drive C. This is mainly a matter of personal preference and traders can set the levels to their choice as long as it provides a good risk to reward ratios set up.
Traders can apply the pattern in various ways, such as:
- To position a pending sell or buy order at the last 127.2 percent level, while keeping the stop-loss a few pips below or above the current swing low or high.
- Wait for the market to show a rejection of the price close to the third drive. This involves observing the candlestick patterns that show price rejection such as pin bars or dojis. These rejection bars can be differentiated based on the lower wicks or long upper. After the rejection bars form, traders can then put their entry and stop-loss points at the high and the low of the bars.
- Lastly, traders can also wait for the price to break through the 127.2 percent level. They can put a pending order when the price falls lower than this high or low. Applying the previously formed swing point low or high, the stops are then based accordingly.
It announces a potentiel reversal
The three drive chart pattern is a reversal pattern that comes out of the current trend. Therefore, it makes it possible for traders to profit from the trend change. The pattern can also indicate traders who are positioned in the trend to exist once the pattern comes up.
To effectively trade the three drives harmonic pattern, use the Fibonacci retracement and extensions to qualify the pattern. But this pattern does not occur very often, so traders need to only keep an eye out for it rather than put their entire trading on just the three drives pattern. With time, traders can form their trading processes to view the reversal of the price following the three drives pattern.
Additional resources about the three drives pattern
Before you keep reading this extensive article, you should check this two courses I shortlisted for you on Udemy:
- Forex Harmonic Pattern Trading – With Multiple Chart Examples: it’ll teach you step-by-step how to identify most harmonic pattern applied to forex markets.
- Harmonic Trading: The Art Of Trading With Low Risk: it’ll guide you to your first harmonic trades, what are potential reversal zones and it’ll give you practical applications so you can truly understand how to use it and manage your risk.
If you prefer to skip the learning part and are just looking for a harmonic patterns scanner, you might want to check this harmonic patterns screener here. You’ll get a 7-days free trial (+ 50% off your 1st month subscription if you decide to continue).
Looking for a way to automatically find harmonic patterns in your favorite markets?
You definitely need a screener for that! Check out this harmonic patterns scanner here!
If you come from us (simply click the link below), you’ll get a 7-days free trial and 50% off your first month’s subscription fee. Don’t think more, go test it out for free now!
Click here to signup and claim your 7-days free trial to the best harmonic pattern scanner.


 We loved Marwood Research’s course “Candlestick Analysis For Professional Traders“. Do you want to follow a great video course and deep dive into 26 candlestick patterns (and compare their success rates)? Then make sure to check this course!