
 Good Trading requires the Best Charting Tool!
All patterns have a unique tale to tell about market forces that lead to its formation. And traders might benefit by trying to identify what drove the market to where it is now. Knowing exactly why a market carried out a particular move is almost impossible. Having that said, we can get to some probable conclusions. Let’s focus on the Belt Hold candlestick pattern here.
Belt holds are an important area of chart patterns because they show areas where market sentiment may be changing. As the name suggests, the belt hold acts as a support to hold up the market when it wants to fall.
- A belt hold is a single bar Japanese candlestick pattern that suggests a possible reversal of the prevailing trend.
- It can be bullish or bearish depending on its formation.
- It opens at or near its high and closes at or near its low, leaving very little upper or lower shadows.
Statistics to prove if the Belt Hold pattern really works
Are the odds of the Belt Hold pattern in your favor?
How does the Belt Hold behave with a 2:1 target R/R ratio?
From our research the Belt Hold pattern confirms 72.6% of the time on average overall all the 4120 markets we analysed. Historically, this patterns confirmed within 2.9 candles or got invalidated within 7.1 candles. If confirmed, it reached the 2:1 R/R target 34.6% of the time and it retested it's entry price level 97.6% of the time.
Not accounting for fees, it has an expected outcome of 0.037 $/$.
It means for every $100 you risk on a trade with the Belt Hold pattern you make $3.7 on average.
Want to account for your trading fees? Have the detailled stats for your favorite markets / timeframes? Or get the stats for another R/R than 2:1?
🚀 Join us now and get fine-tuned stats you care about!
How to handle risk with the Belt Hold pattern?
We analysed 4120 markets for the last 59 years and we found 1 312 426 occurrences of the Belt Hold pattern.
On average markets printed 1 Belt Hold pattern every 12 candles.
For 2:1 R/R trades, the longest winning streak observed was 57 and the longest losing streak was 600. A trading strategy relying solely on this pattern is not advised. Anyway, make sure to use proper risk management.
Keep in mind all these informations are for educational purposes only and are NOT financial advice.
If you want to learn more and deep dive into candlestick patterns performance statistics, I strongly recommend you follow the best available course about it. Joe Marwood (who's a famous trader with more than 45 000 Twitter followers) created an online course called "Candlestick Analysis For Professional Traders" in his Marwood Research University. There he will take you through the extensive backtesting of the 26 main candlestick patterns. He then summarizes which one is THE best pattern. Do you know which one it is?
Remember, don't trade if you don't know your stats. Click here to signup to the course now!
What is the Belt Hold pattern?
Some context
This candlestick pattern (or yorikiri in Japanese) is seen as a small trend reversal pattern that can show a bearish or bullish trend reversal, depending on how the pattern is and the direction of the trend in which it shows up.
The pattern is a single candlestick pattern that is almost the same as a Marubozu candlestick in that it has a big real body with small or no shadows, showing the strength of bearish or bullish activity. The single bar that appears in an uptrend is a potential top reversal pattern and the pattern is a bearish belt hold pattern.
The bearish belt hold is made up of one dark candle that opens at or near its high, and closes at or near the low, leaving very little lower or upper shadows. On the other hand, a bullish belt hold pattern shows up in downtrend and is a potential bottom reversal pattern. It is made up of one rising candle that also opens at or near its high and closes at or near its low.
Characteristics
The height of these bars show a potential change in sentiment, therefore, the pattern becomes more important depending on the size of the candles.
Both the bearish and bullish belt hold patterns are more reliable when they come up close to the extreme of the market as shown by trend lines, support and resistance, moving averages and pivot points. They are also more vital when they form part of other patterns, such as the engulfing pattern or the dark cloud cover pattern.
The belt hold is a distinct candlestick pattern that offers one of the most explicit signals of the direction of the current market. However, simply knowing how to detect this pattern is not sufficient. You’ll also need to learn specific ways to effectively trade it.
Two types of Belt Hold
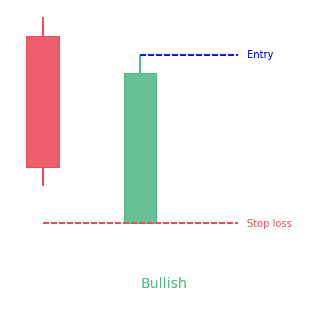
Bullish Belt Hold
A bullish belt hold shows up in downtrends. The pattern can be recognized by one long, full-bodied candlestick that is bullish and opens at a new recent low. The bullish belt hold candle is expected to have a flat or nearly flat bottom. The top has a small shadow, relative to the length of the body.
The long bullish body indicates that the price got to a low in the recent downtrend but has changed direction after the open, with little downwards retracement. The formation of a bullish belt hold changes the odds towards a short term reversal in sentiment from bearish to bullish.
Have it in mind that the bottom of the belt hold is a support line that often coincides with an already established support line at the same price. The support lines are important for stop-loss placement.
Traders will often look for an opening gap in a bullish belt hold on the daily chart, meaning that the market gapped lower at the day’s open but put on a strong rally to get back on top and close the day at a higher price. In constant markets such as spot forex, this condition doesn’t always apply.
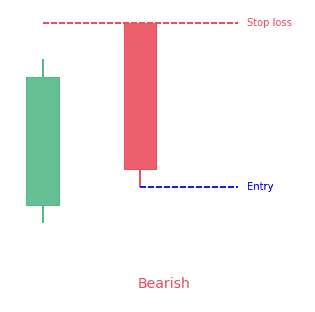
Bearish Belt Hold
The bearish belt hold is the complete opposite and it comes up in uptrends. To detect it, look for a long full-bodied, bearish candlestick that stands out at the top of an uptrend because it will get to a new recent high and it should be noticeably longer than the other candles.
Although the bearish belt hold often signals a reversal in investor sentiment from bullish to bearish, it is not considered very dependable because it occurs frequently and is often incorrect in predicting future share prices. As with any other charting methods, more than two days of trading should be considered when predicting trends.
How to identify the Belt Hold pattern?
Traders indeed define the belt hold differently based on their understanding. But there are two categories for this pattern – essential and optional. The essential covers the basic idea of the belt hold pattern. They should be present for all instances of the belt hold candlestick pattern.
The optional relates to enhancing the pattern. These supplements are important, but they are secondary compared to the more significant price context.
Identifying a bullish Belt Hold
Essential conditions
- The candlestick does not trade lower than its opening price
- The bar must be bullish
- The previous bar must be bearish
Optional conditions
- The candle has to close within the body of the previous candlestick
- The candlestick should close near the high
- The candlestick has to open lower than the low of the previous candlestick
Identifying a bearish Belt Hold
Essential conditions
- The candlestick doesn’t trade higher than its opening price
- The candlestick has to be bearish
- The previous candle has to be bullish
Optional conditions
- The belt hold bar must close within the body of the initial candlestick
- The candlestick has to close near the low
- The candlestick must open greater than the high of the previous candlestick
What does the Belt Hold pattern tell traders?
When a bullish belt hold candlestick shows up, it indicates that buyers have had control of the share price for the whole trading session as the share price never got lower than its opening share price.
Since the trading session open, the share price has only gone higher and that is the reason why a bullish belt hold has no lower shadow. The buyers have been in control of the whole trading session.
The bearish belt hold indicates a short-term switch from bullish to bearish sentiment. The top of the bearish belt hold becomes a resistance line. More weight is given to the belt hold resistance line if it lines up with one that is already established.
How to trade when you see the Belt Hold pattern?
The good thing about the belt hold candlestick pattern is that the rules are simple to apply and implement, but you have to be careful to not lose your self-control, but that is always the case when day trading.
Entry point
After you’ve spotted the belt hold candlestick, open a position in the direction of the candle and go long right after the candle closes.
Stop-loss
Just as it is with any other trade, always protect your belt hold trades with a stop-loss. The stop-loss should be positioned directly under the low of the entry candle. But since the marubozu candle shows up during higher volatility, the price action will often get to the stop if placed correctly on the other side of the candle.
It is therefore recommended that you place your stop-loss at one candle away from the marabozu. If you are purchasing a stock on the belt low signal, for instance, place your stop-loss beneath the low of the candle that comes after the closing marubozu candle. On the other hand, if you’re selling on a belt hold signal, your stop-loss order should be above the candle that precedes the marubozu.
Take profit targets
When you use a belt hold line trade, ensure to set a preliminary target. The first option is to end your position when the stock runs at least twice or three times the size of the marubozu pattern.
The other profit taking method is to make use of the price action rules to know when to leave your trades, this if course will demand more skills and most importantly discipline.
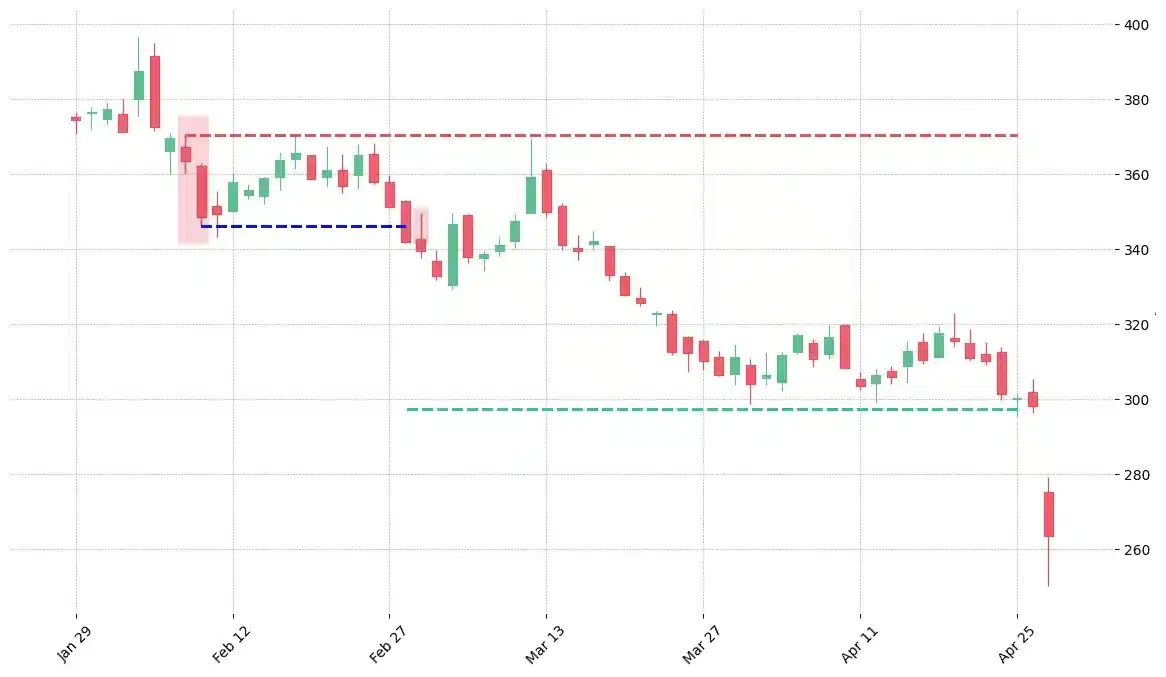
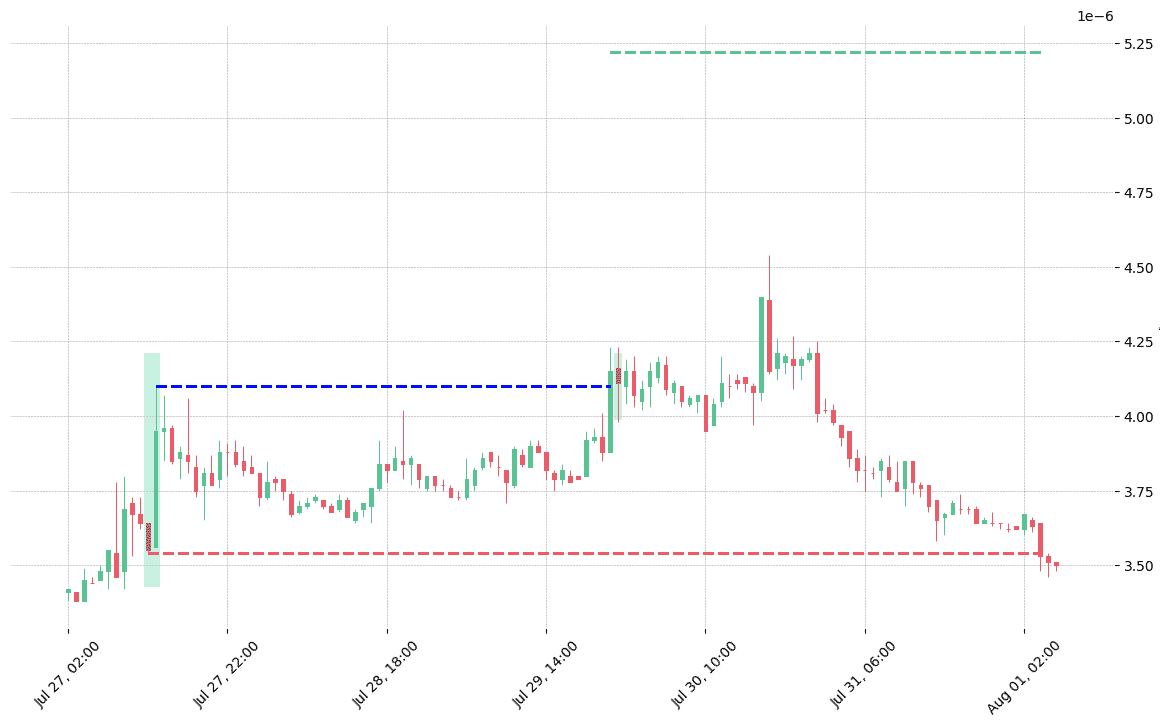
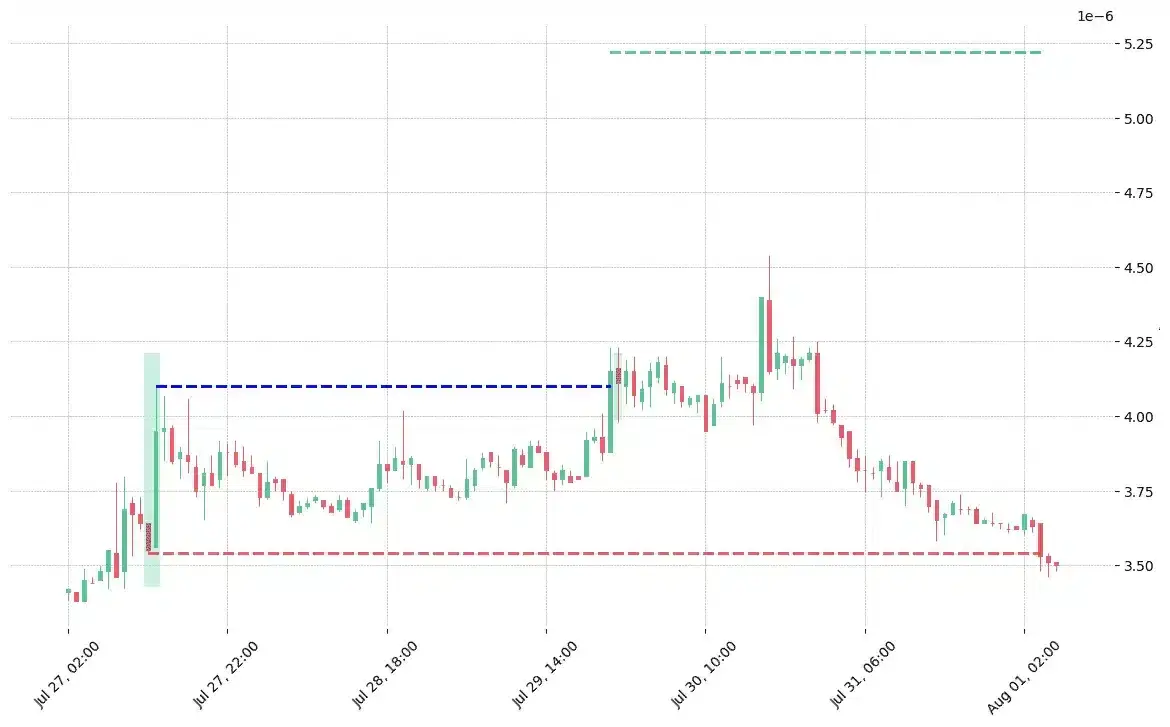
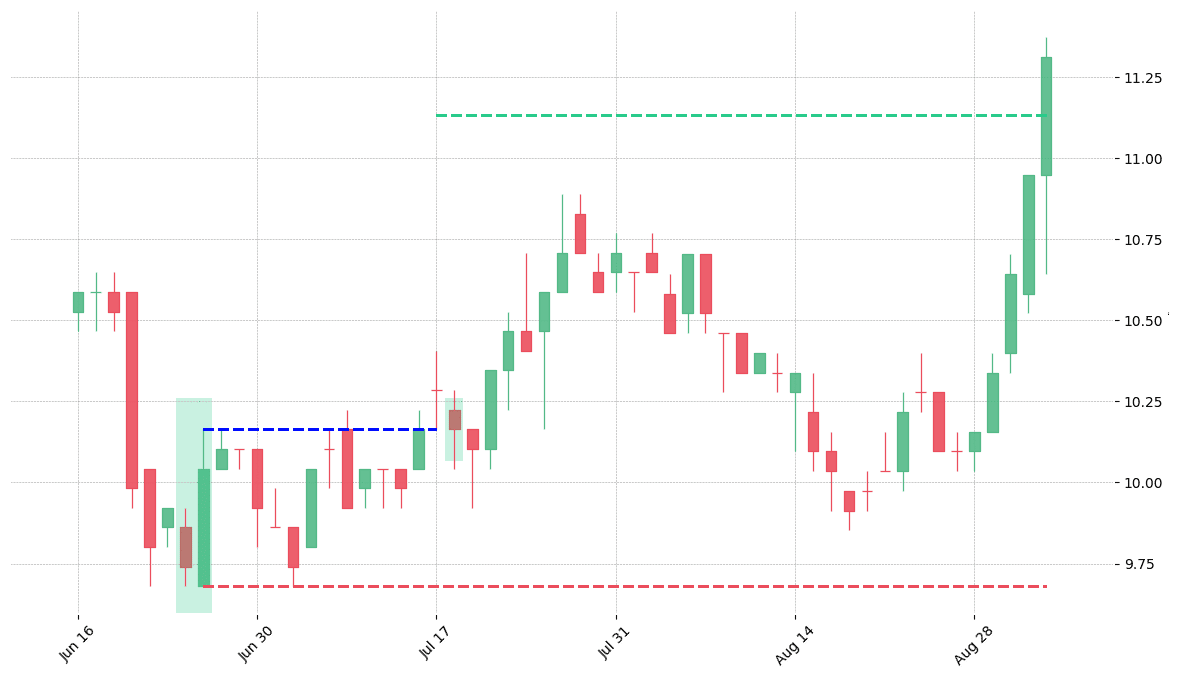
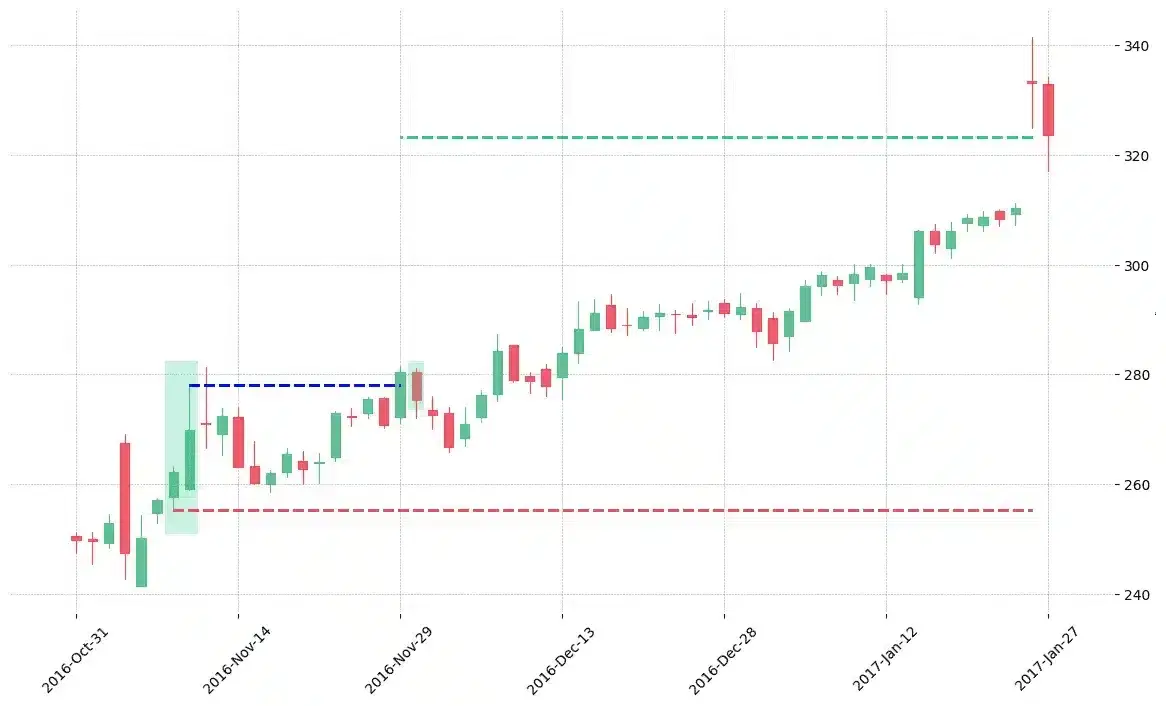
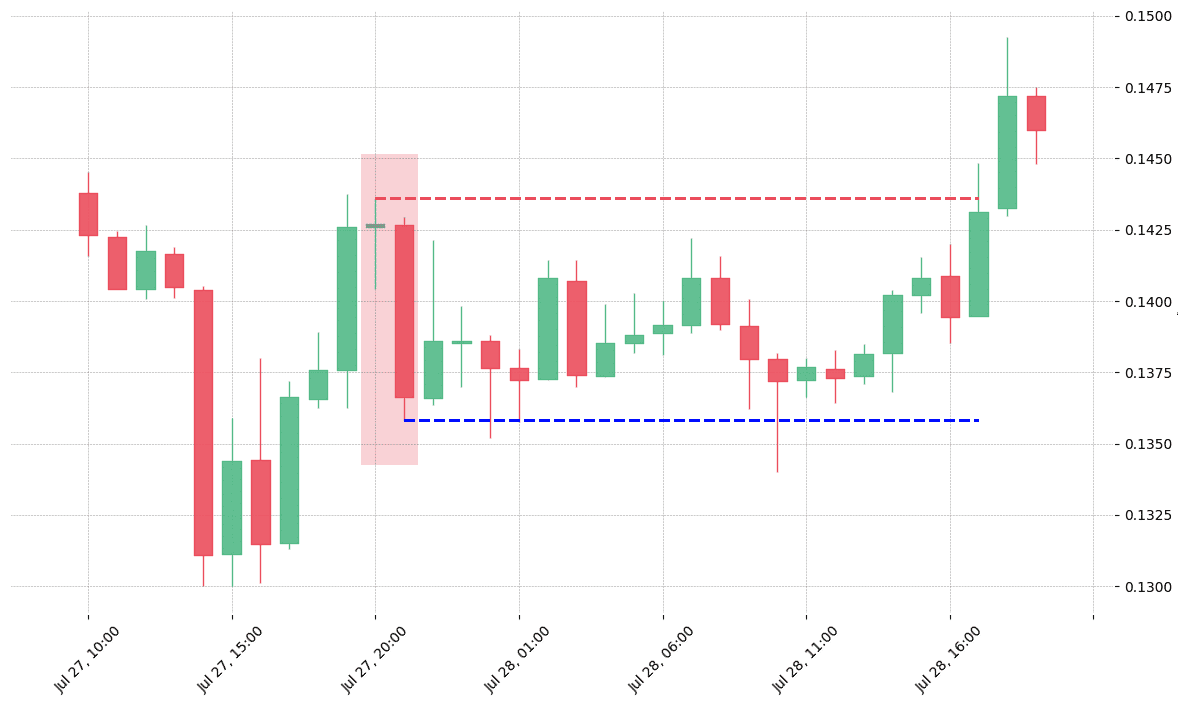
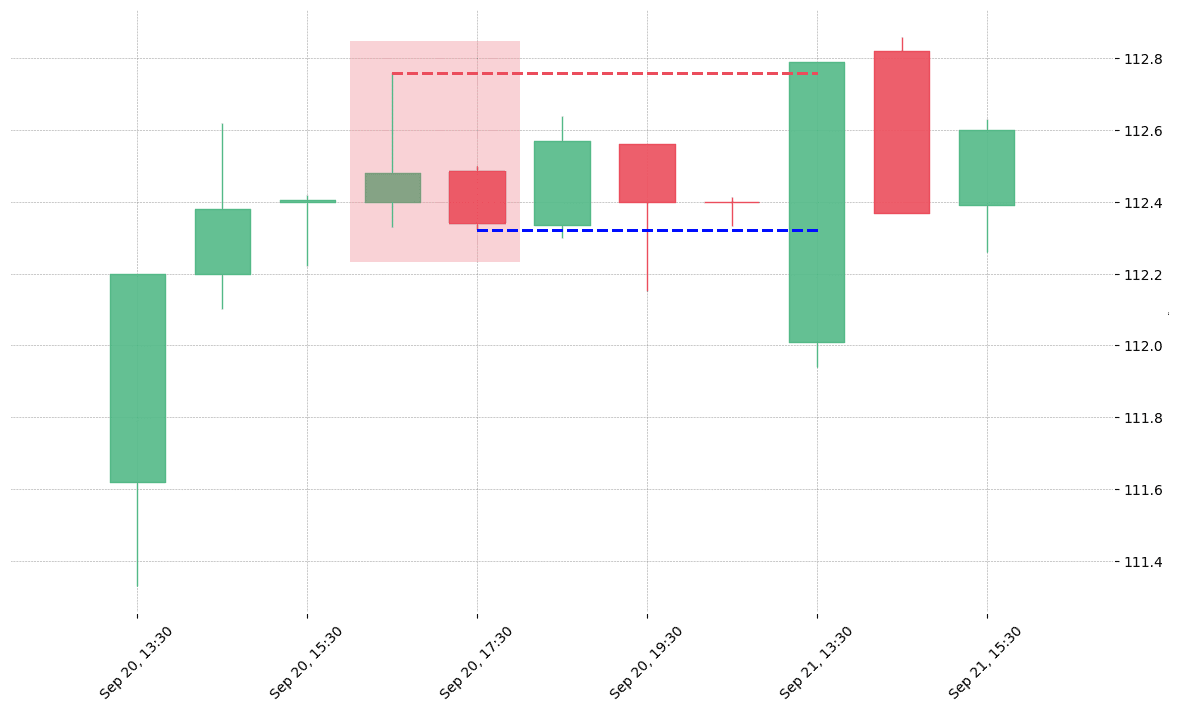
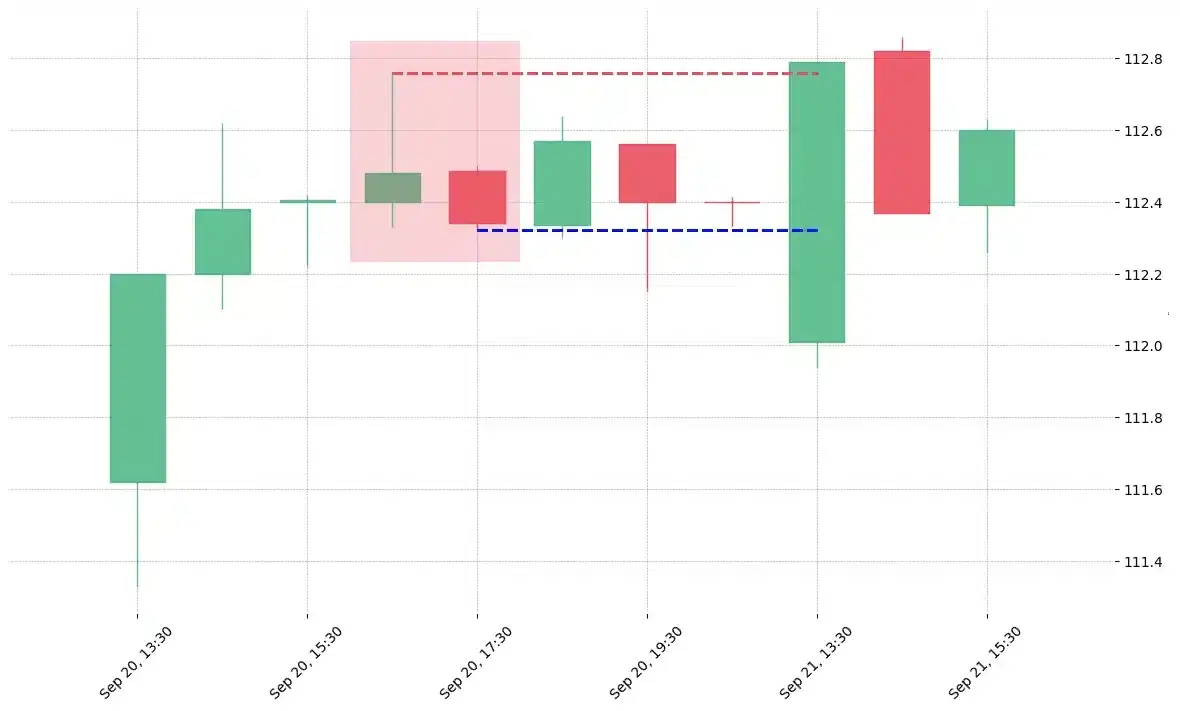
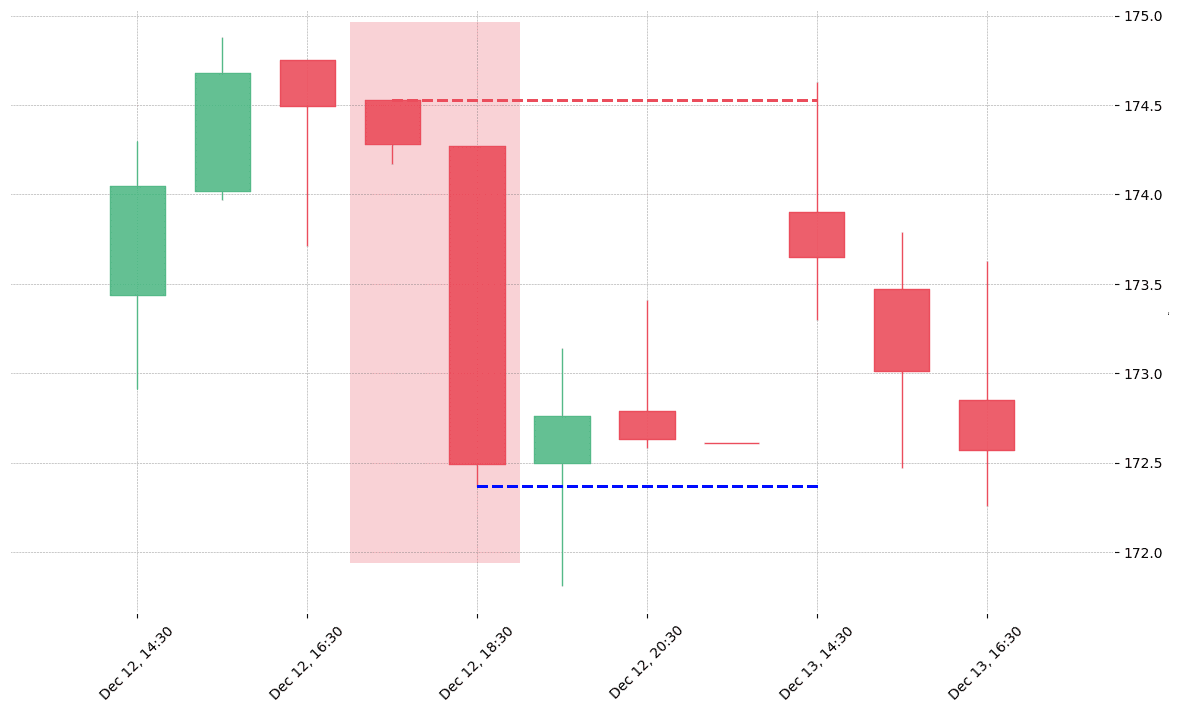
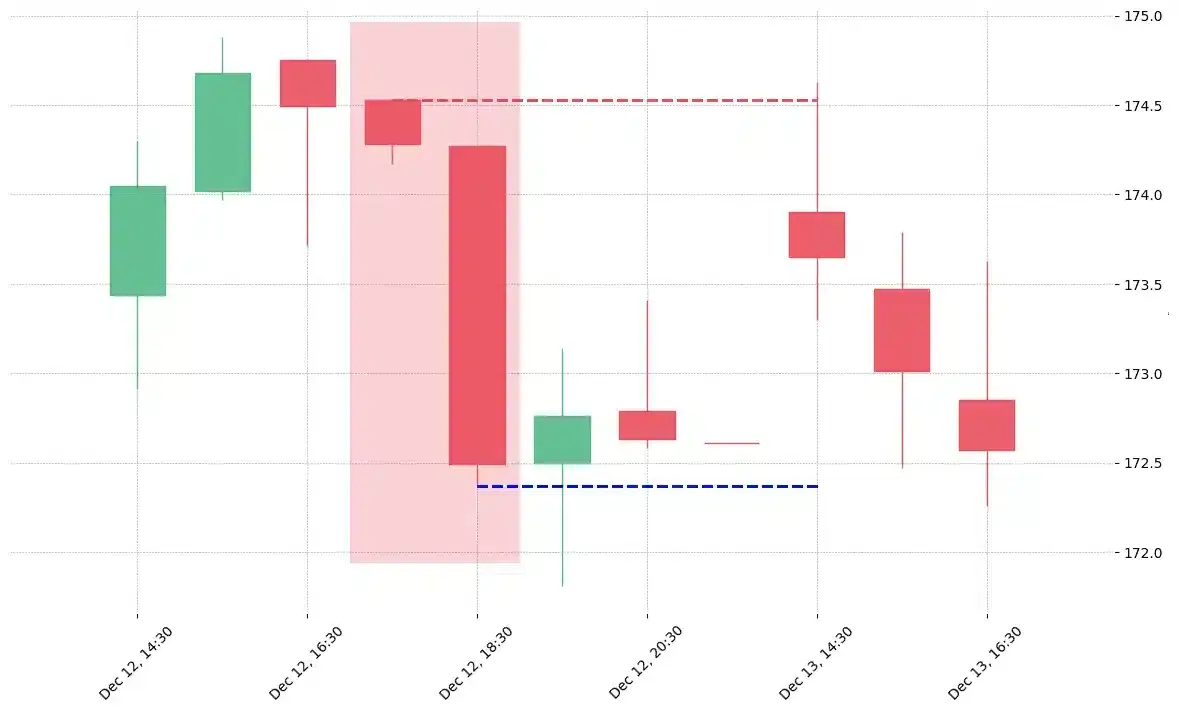
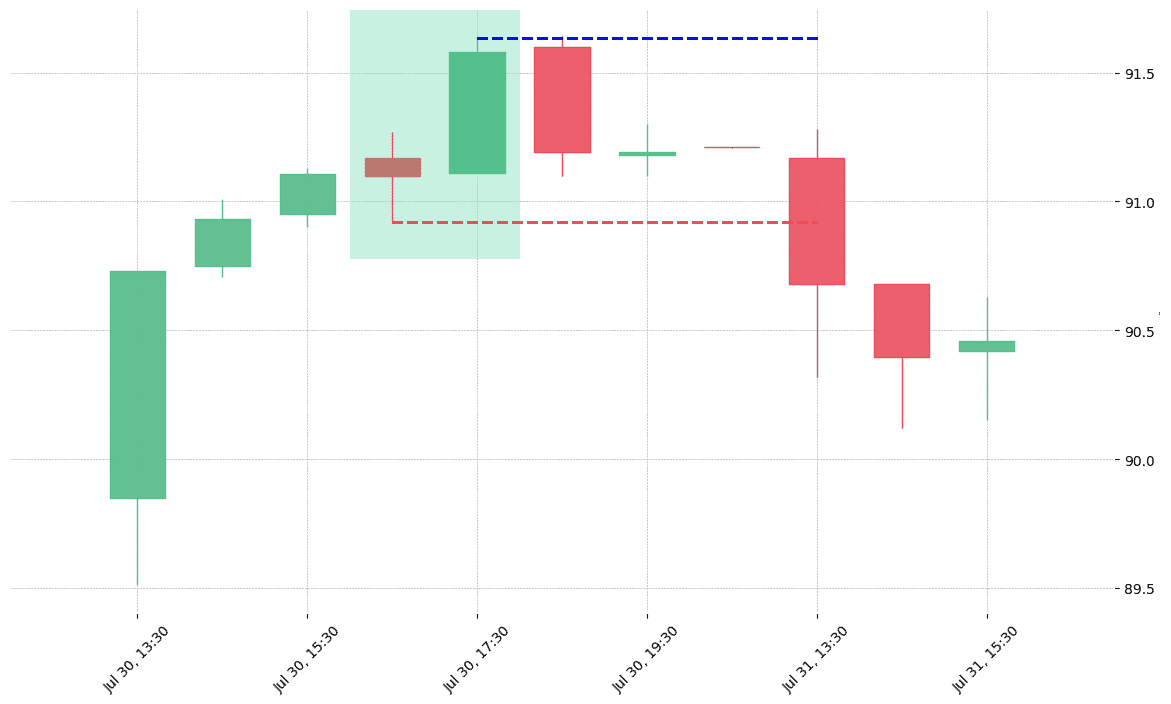
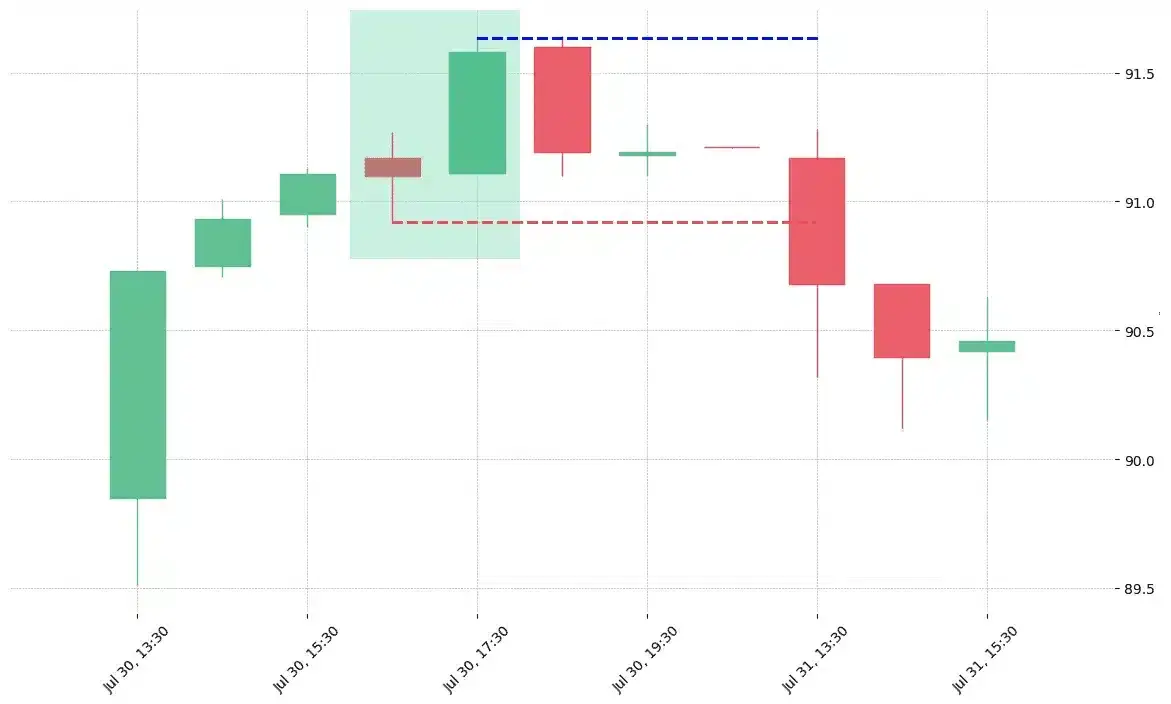
How does the Belt Hold pattern look in real life?


Looking to learn more about this pattern?
You should take a look at Joe Marwood's online course. In his course, he backtested the 26 main candlestick patterns before to summarize which one is THE best pattern. I really liked his course and you shouldn't miss it!
Click here to signup to his "Candlestick Analysis For Professional Traders" course now!


 We loved Marwood Research’s course “Candlestick Analysis For Professional Traders“. Do you want to follow a great video course and deep dive into 26 candlestick patterns (and compare their success rates)? Then make sure to check this course!