Homing Pigeon Candlestick Pattern Definition

Candlestick patterns

Homing Pigeon Candlestick Pattern

The Homing Pigeon candlestick pattern is a two-line candlestick pattern. Traditionally, traders consider it a bullish reversal candlestick pattern. However, testing has proved that it may also act as a bearish continuation pattern. This new development proves it to be near random because you won’t be confident about the prediction of breakout direction. However, its overall performance is considered very reliable. 

The Homing Pigeon candlestick pattern generally forms in a downtrend and predicts a reversal. Like the other candlestick patterns, subsequent patterns confirm it. Its first and second lines are both black candles. The first candle engulfs the second candle. The first line can be any black candle such as Black Candle, Long Black Candle, etc. but it must be a long line. The second candle can also be any black candle just like the first line but it can be both, a short line or a long line

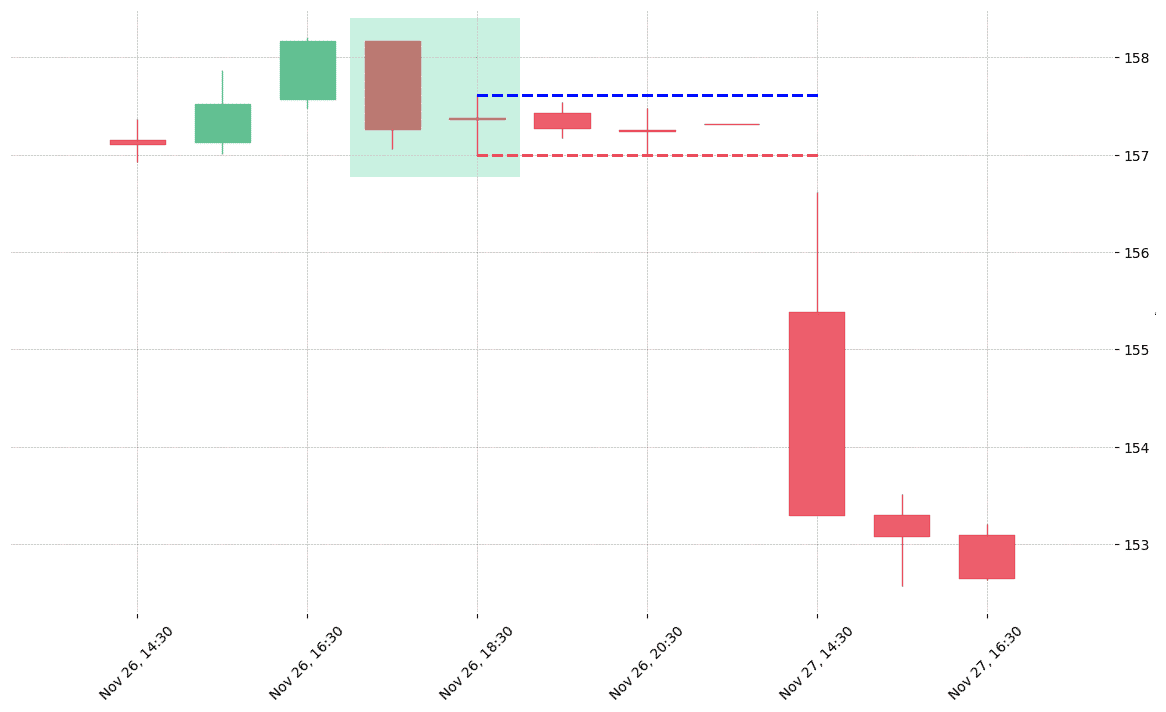
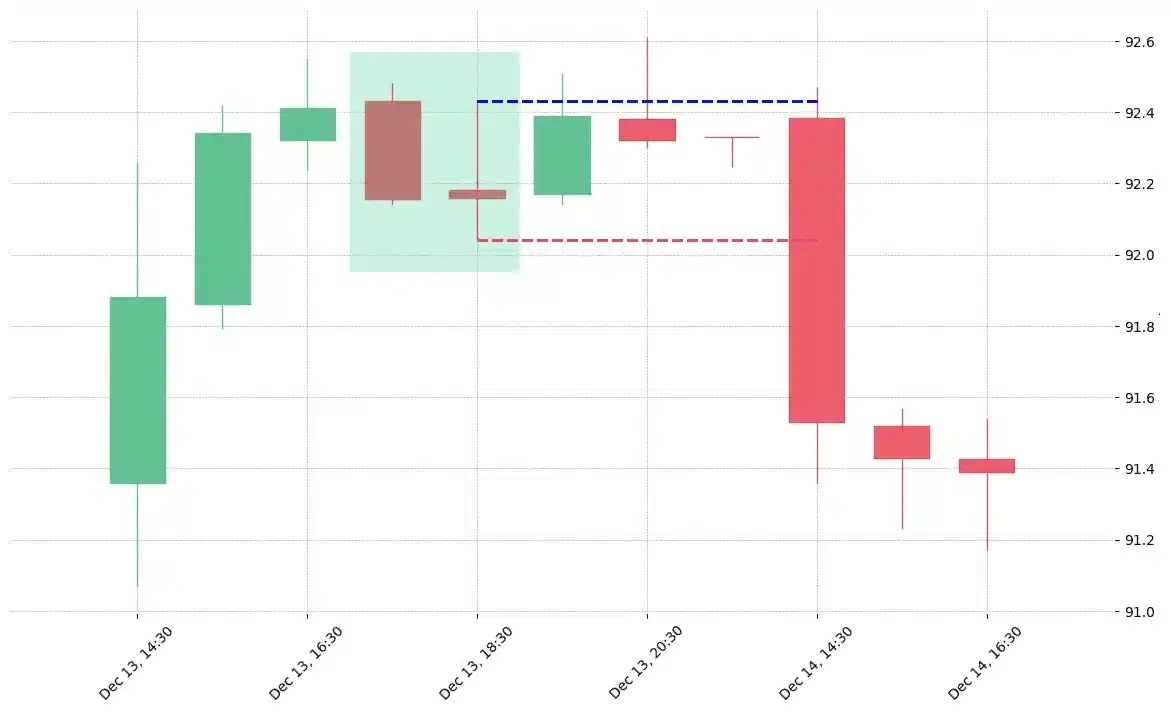
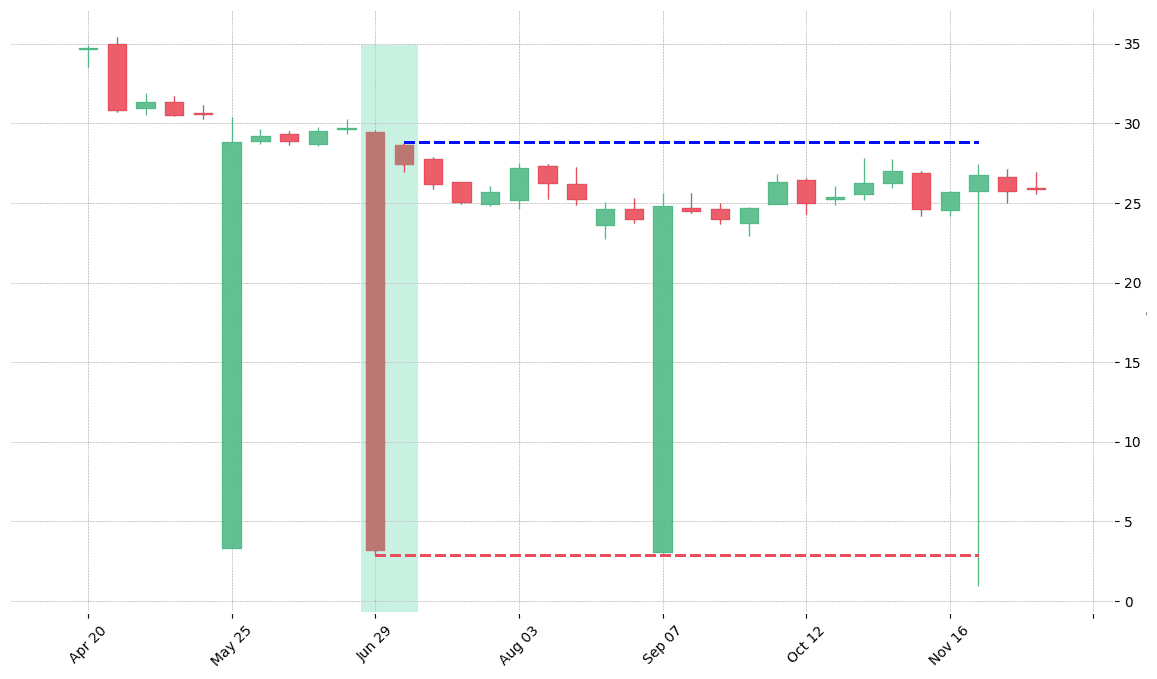
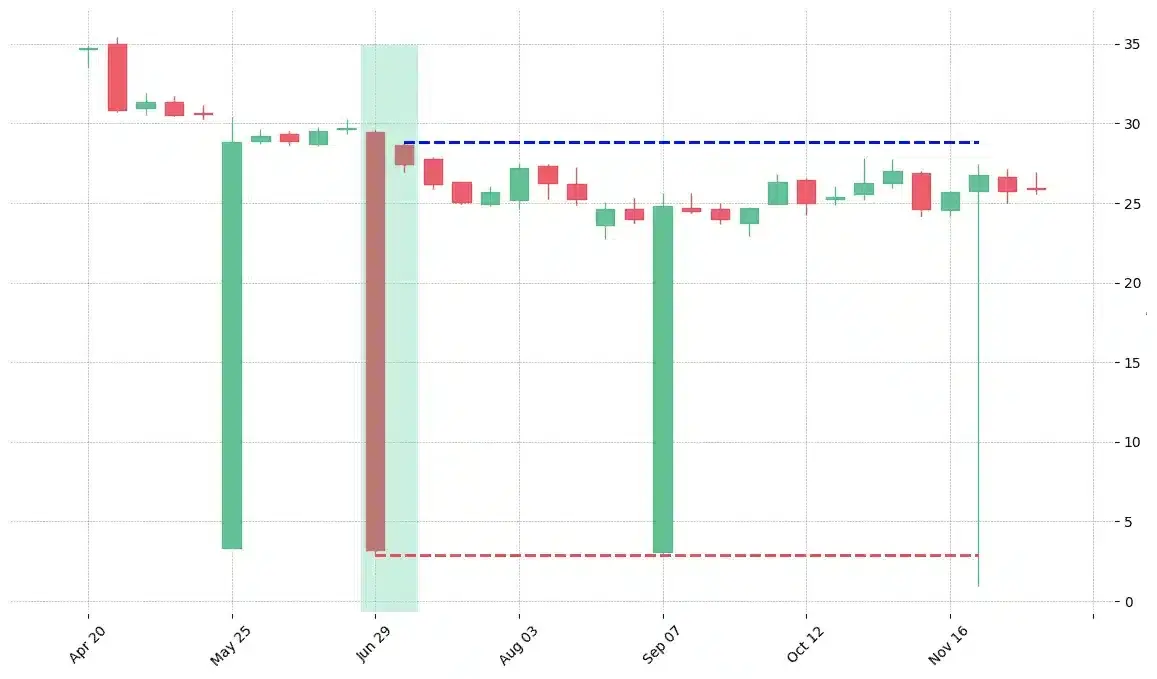
  • The Homing Pigeon is a bullish 2-bar reversal candlestick pattern.
  • It is composed by 2 red candles, a big one and a smaller one, contained within the first one.

Statistics to prove if the Homing Pigeon pattern really works

Are the odds of the Homing Pigeon pattern in your favor?


How does the Homing Pigeon behave with a 2:1 target R/R ratio?

Success rate

From our research the Homing Pigeon pattern confirms 44.5% of the time on average overall all the 4120 markets we analysed. Historically, this patterns confirmed within 2.9 candles or got invalidated within 2.6 candles. If confirmed, it reached the 2:1 R/R target 44.8% of the time and it retested it's entry price level 89.5% of the time.
Not accounting for fees, it has an expected outcome of 0.344 $/$. It means for every $100 you risk on a trade with the Homing Pigeon pattern you make $34.4 on average.
Want to account for your trading fees? Have the detailled stats for your favorite markets / timeframes? Or get the stats for another R/R than 2:1?
🚀 Join us now and get fine-tuned stats you care about!

How to handle risk with the Homing Pigeon pattern?


We analysed 4120 markets for the last 59 years and we found 38 912 occurrences of the Homing Pigeon pattern.
On average markets printed 1 Homing Pigeon pattern every 401 candles.

For 2:1 R/R trades, the longest winning streak observed was 10 and the longest losing streak was 15. A trading strategy relying solely on this pattern is not advised. Anyway, make sure to use proper risk management.

Stack the odds in my favor NOW!

Keep in mind all these informations are for educational purposes only and are NOT financial advice.

If you want to learn more and deep dive into candlestick patterns performance statistics, I strongly recommend you follow the best available course about it. Joe Marwood (who's a famous trader with more than 45 000 Twitter followers) created an online course called "Candlestick Analysis For Professional Traders" in his Marwood Research University. There he will take you through the extensive backtesting of the 26 main candlestick patterns. He then summarizes which one is THE best pattern. Do you know which one it is?
Remember, don't trade if you don't know your stats. Click here to signup to the course now!

How a Homing Pigeon candlestick pattern is formed?

During a downtrend, a black candle is formed on the first day. The second candle is a short black candle showing a narrow trading range. It is also engulfed in the first line that shows that it is included in the first day’s trading range. This weakens the power of the downtrend. It predicts the arrival of buyers on the market which may result in a reversal of the trend. 

How to identify the pattern?

As we have already discussed that a Homing Pigeon candlestick pattern consists of two candle lines. It appears usually in the downtrend. Therefore, you should look for a two-line candlestick pattern in a downtrend. It should be a long black body on the first day followed by a second black body that is contained in the first body. 

What does a Homing Pigeon candlestick pattern tell traders? 

There are many bearish traders and investors on the market who strongly believe that it will continue to fall. When the first candle of the Homing Pigeon candlestick pattern is formed, the same scenario develops. The formation of a long bearish candle confirms the possibility of an upcoming bearish trend. After some quieter buying period, some buying pressure begins to establish itself. Traders assume the reversal of the trend in the market. This assumption causes a gap between the two candlesticks. However, the buying pressure still fails to move the market up, hence making the second candle bearish. 

How to trade the pattern?

In a Homing Pigeon candlestick pattern, a trader should enter a long position. Placing the stop loss below the low of the pattern is a wise move. They can also place the stop loss below the low of the second line as well. 

During a downtrend, traders should wait for enough for the prices to decrease after the formation of the Homing Pigeon pattern. Now, they should enter a short position, and placing the stop loss above will be a wise decision. 

However, it must be remembered that the Homing Pigeon pattern does not give a price target. It is possible that a new trend may start after the patter or price may not move at all. Therefore, traders should base price target on a well-defined risk-reward, a well-measured move, or according to a trading strategy and risk management.

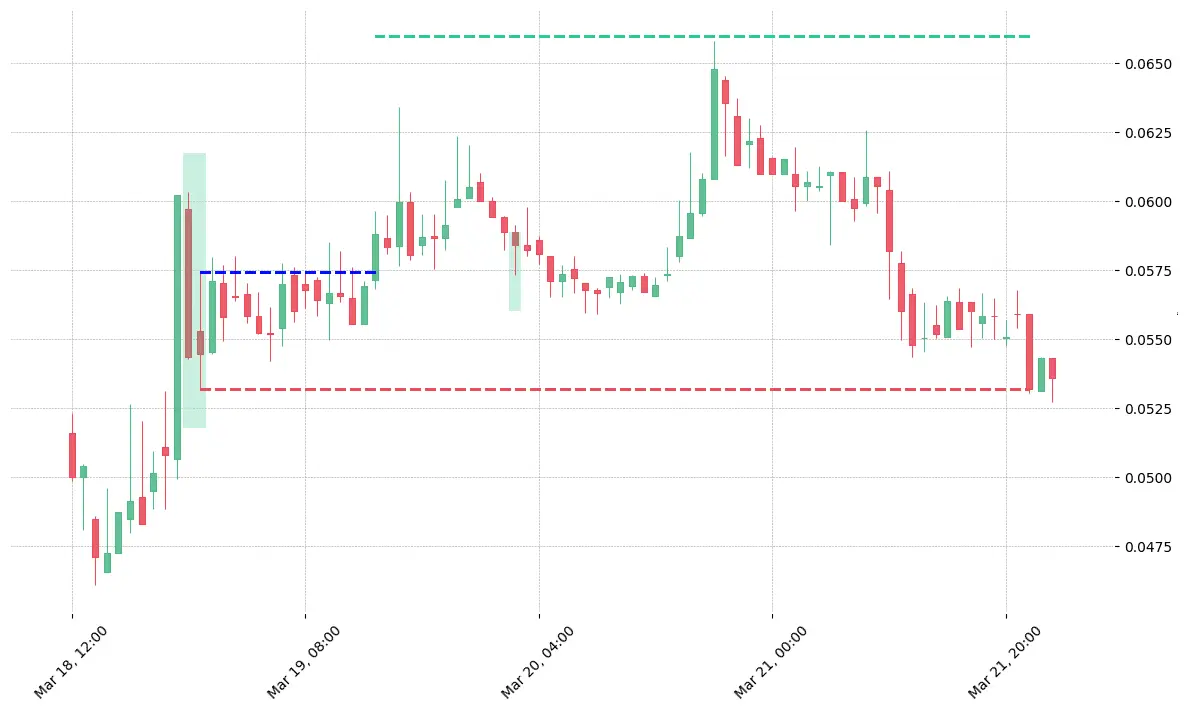
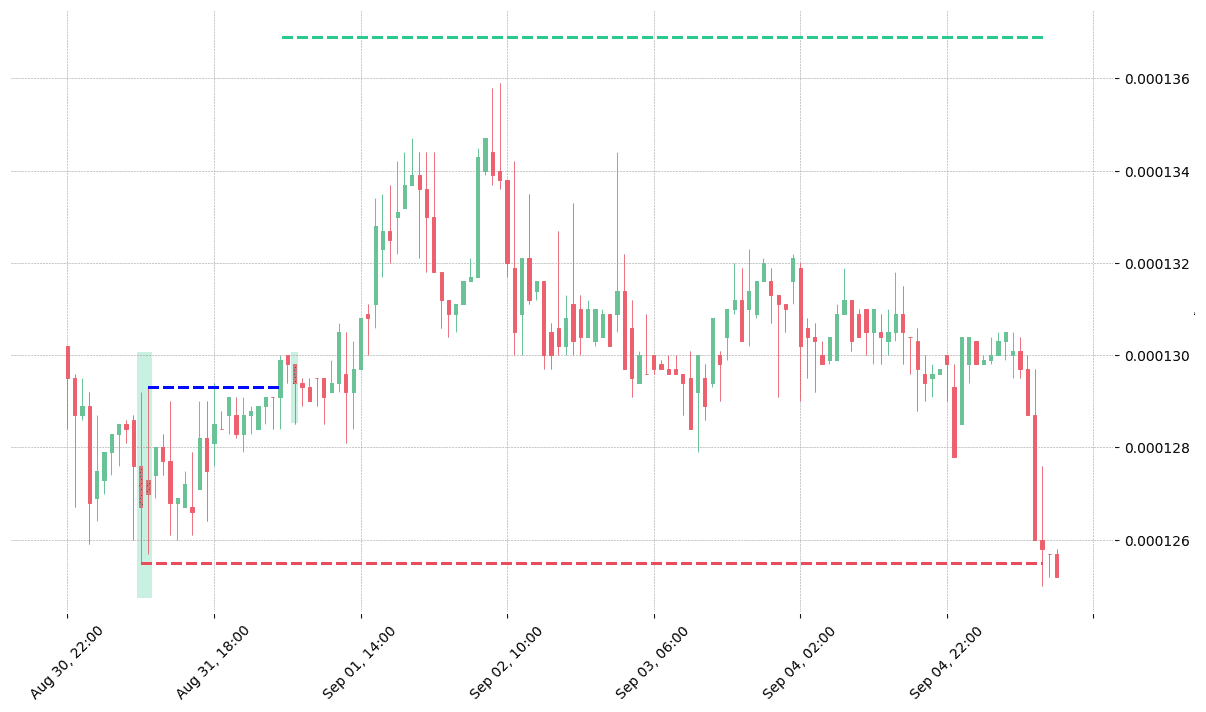
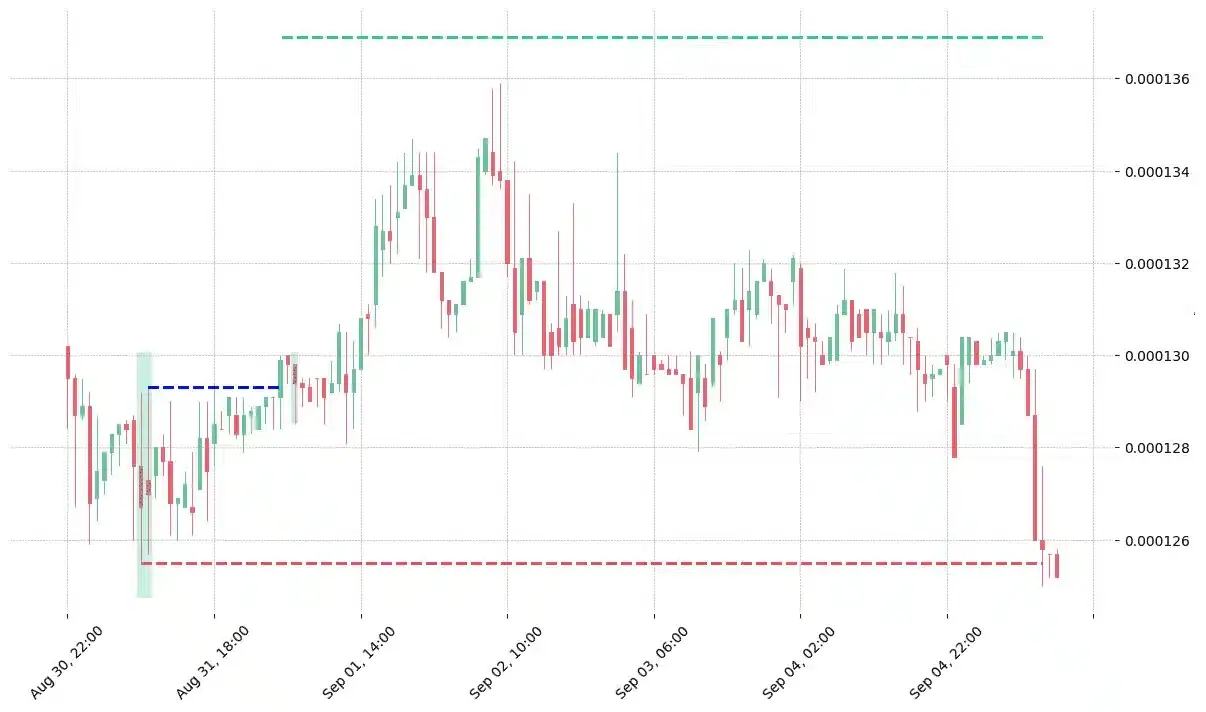
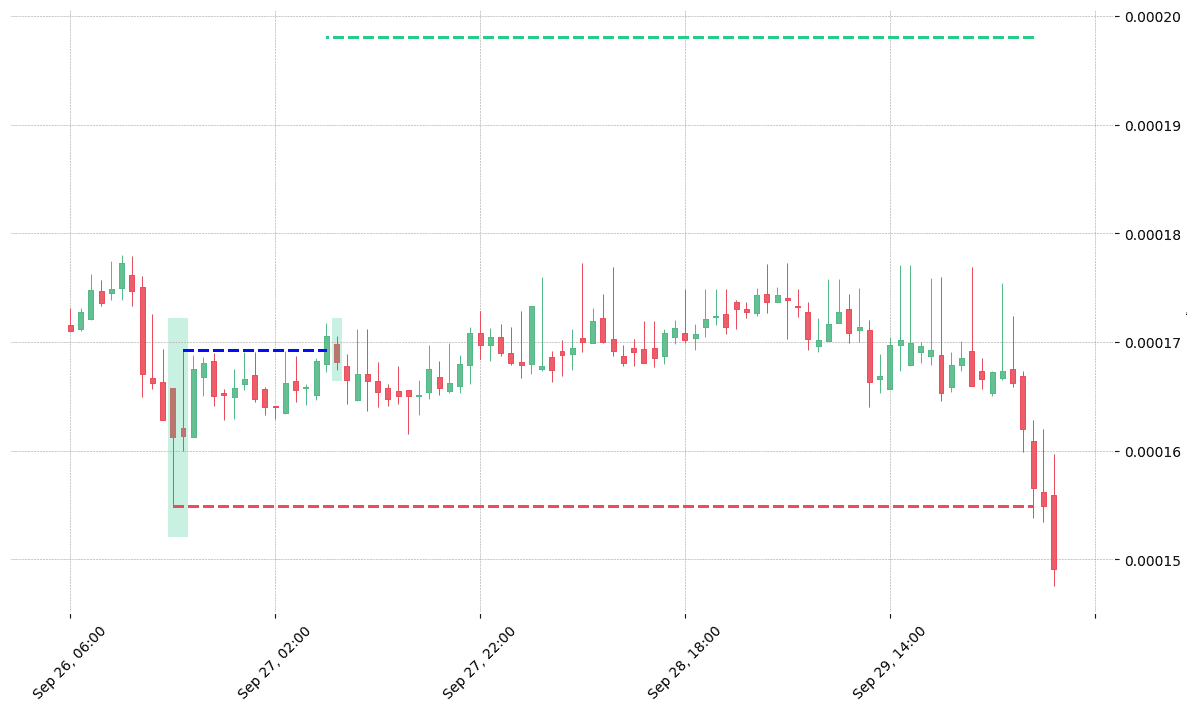
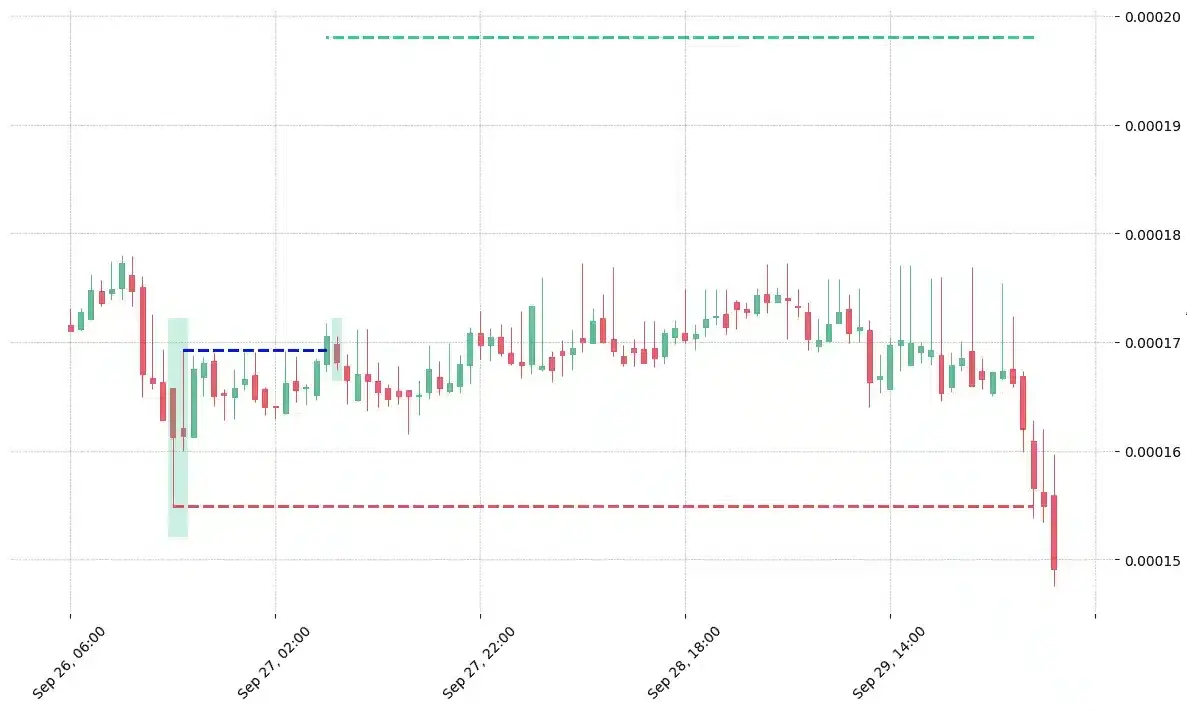
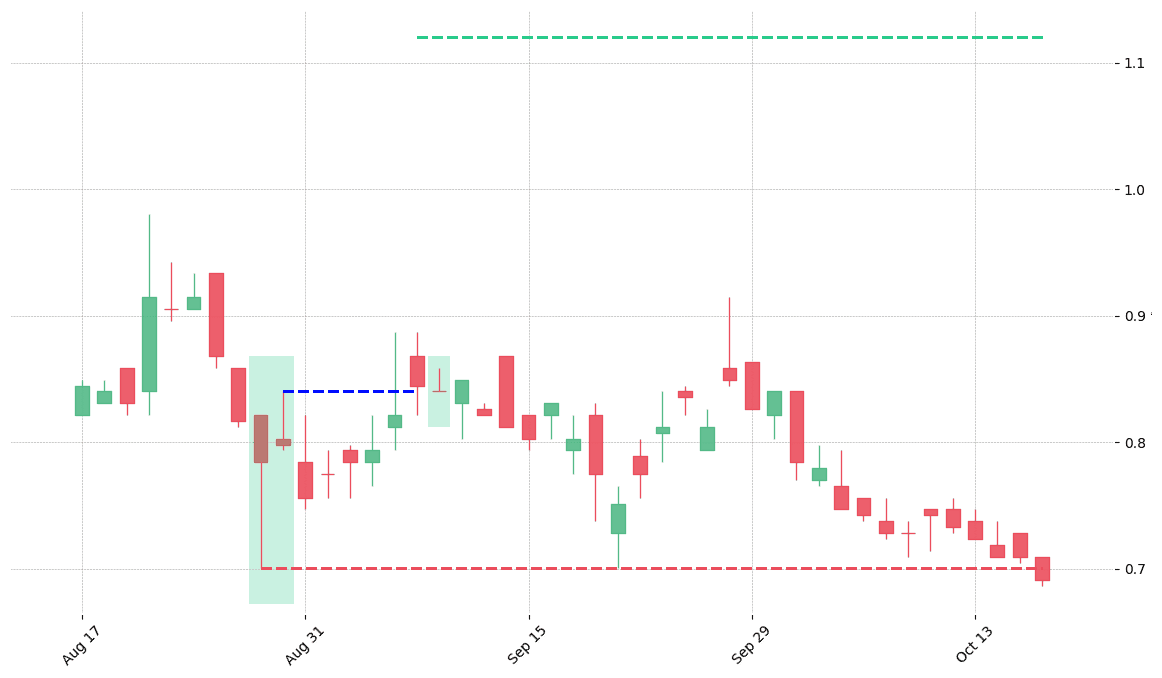
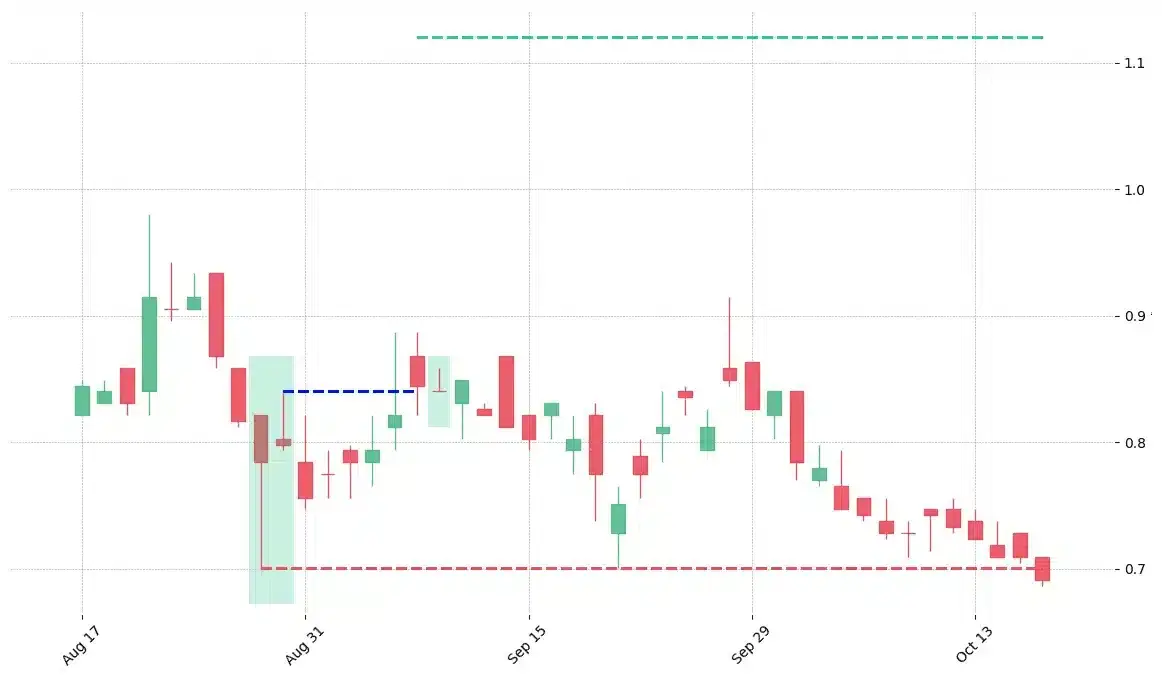
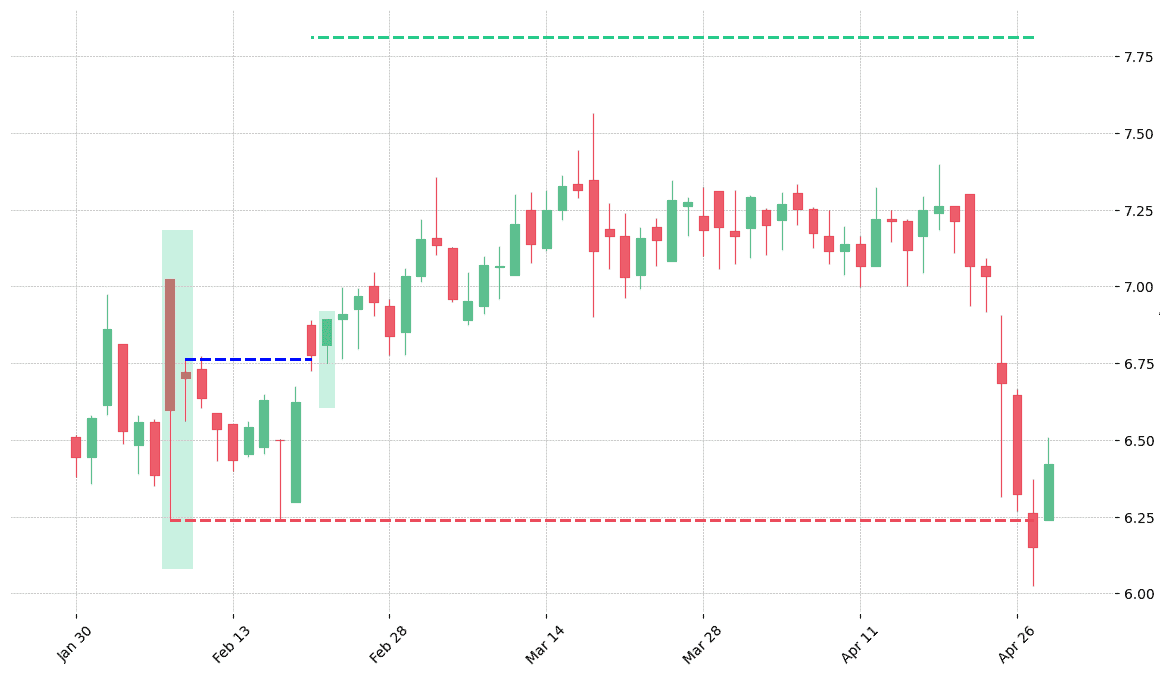
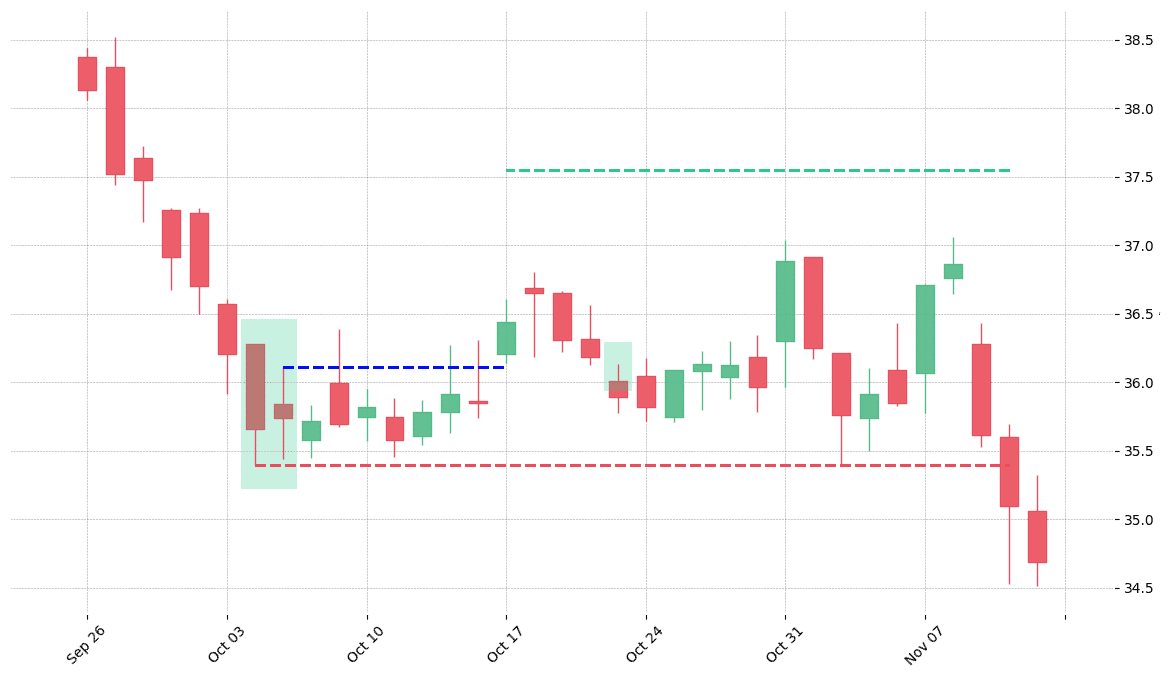
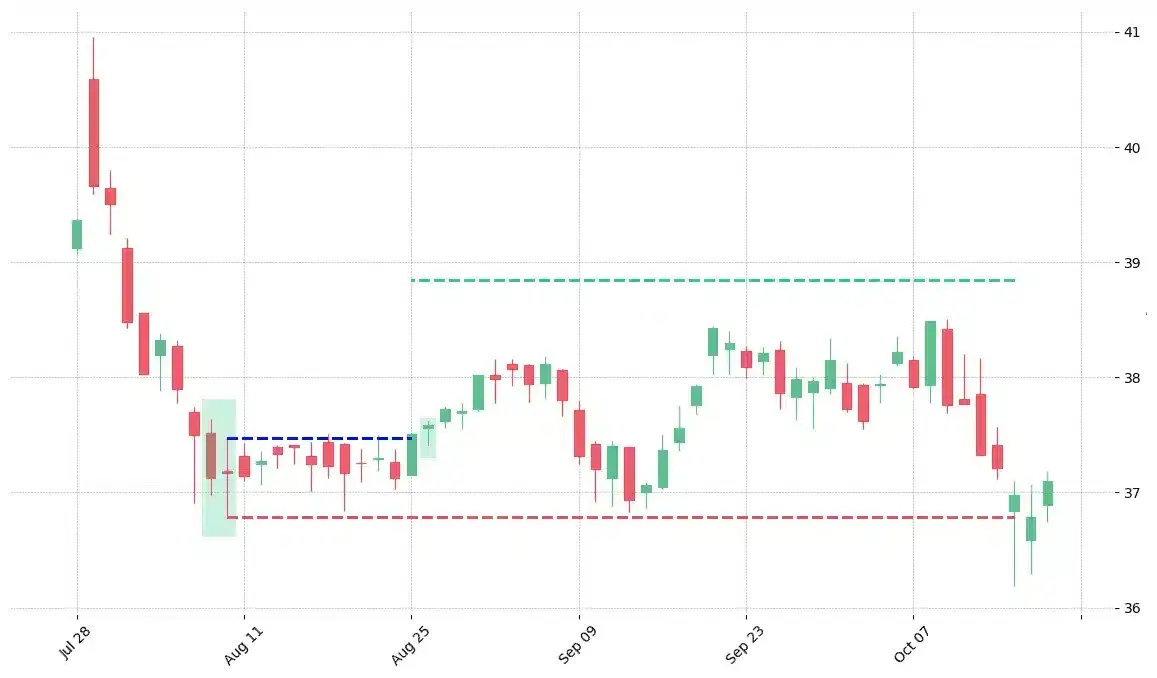
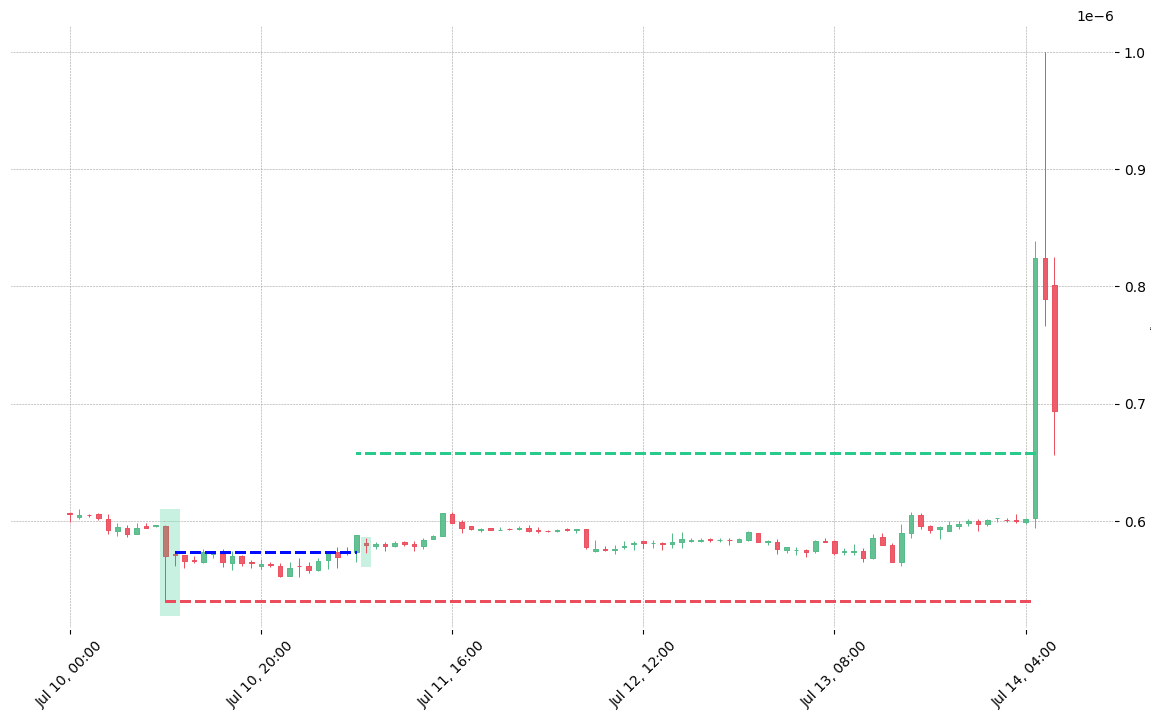
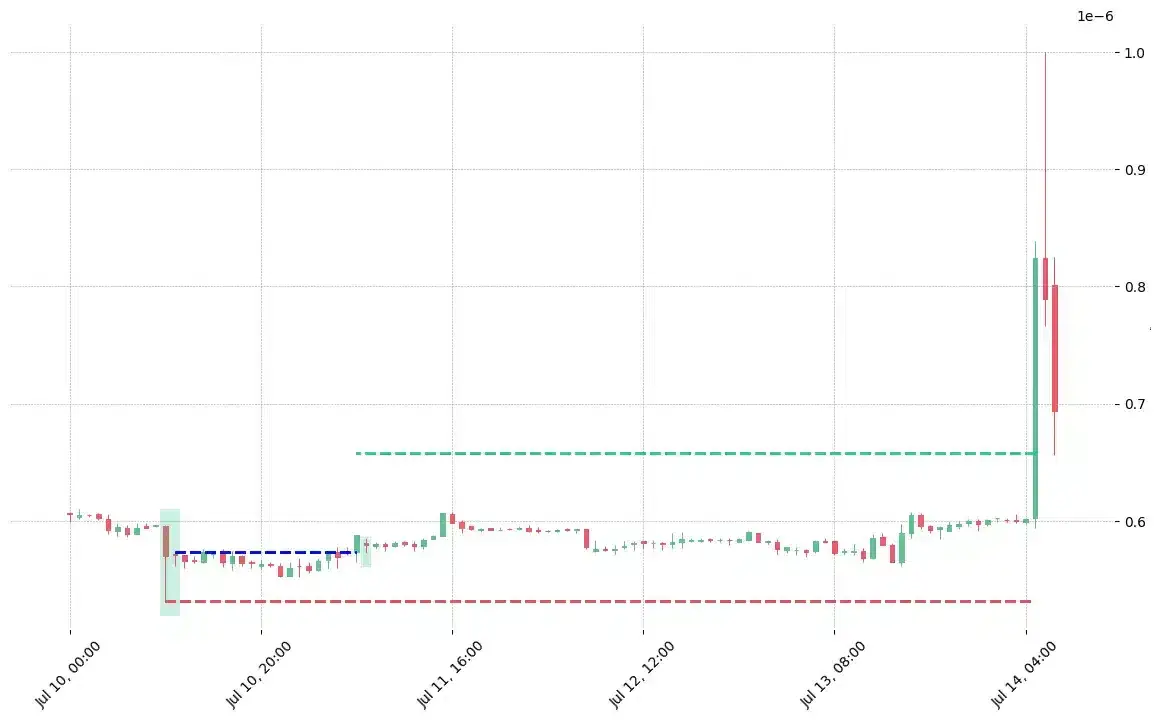
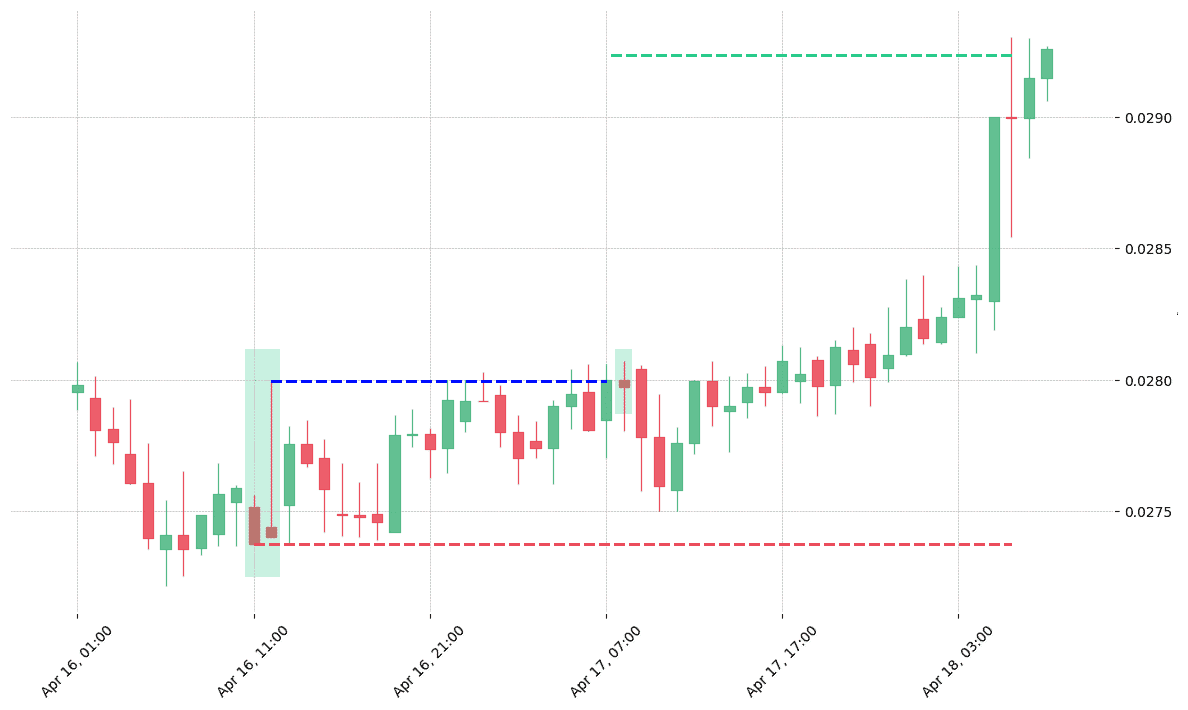
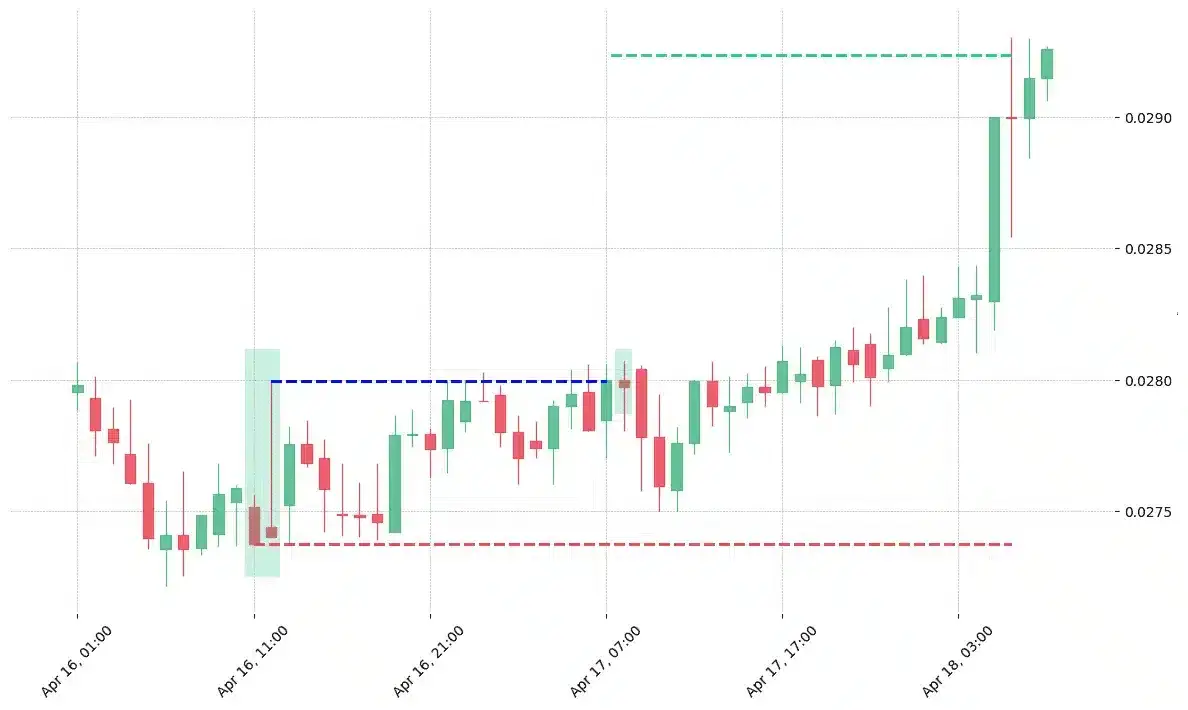
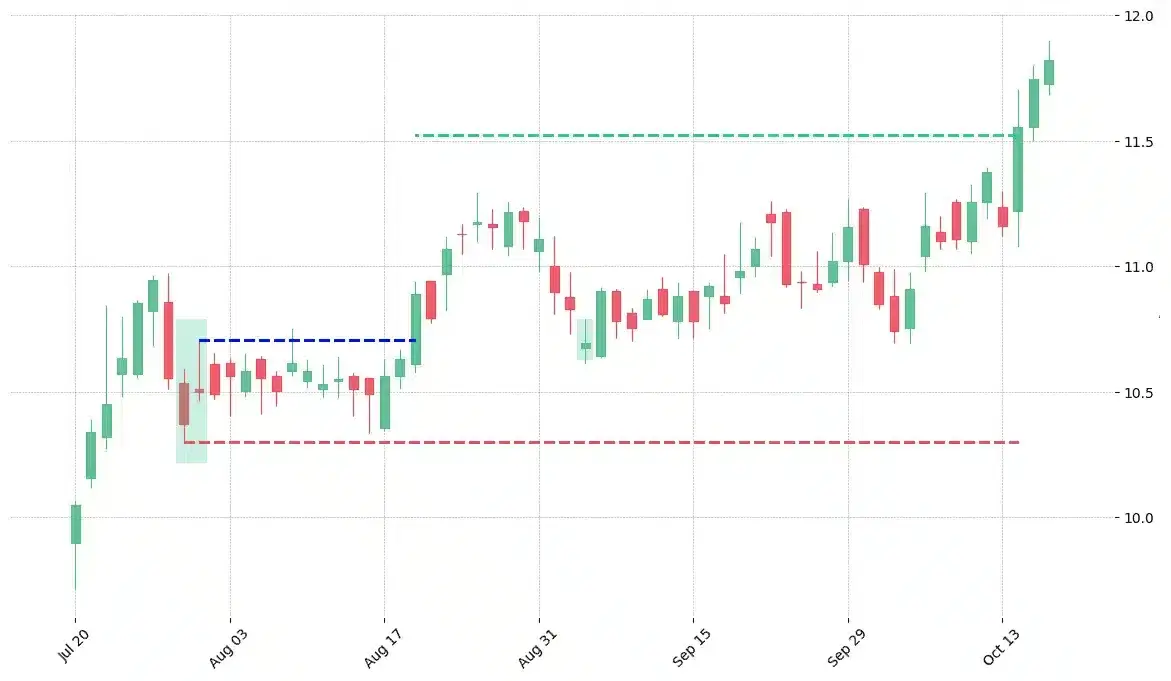
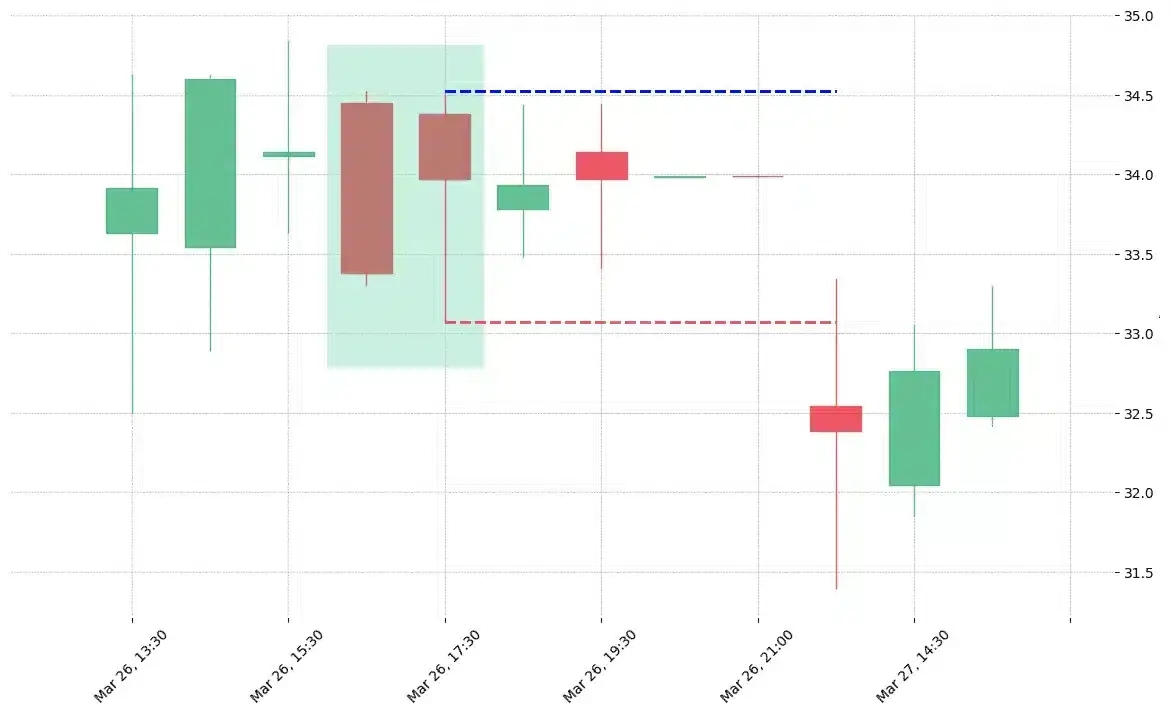
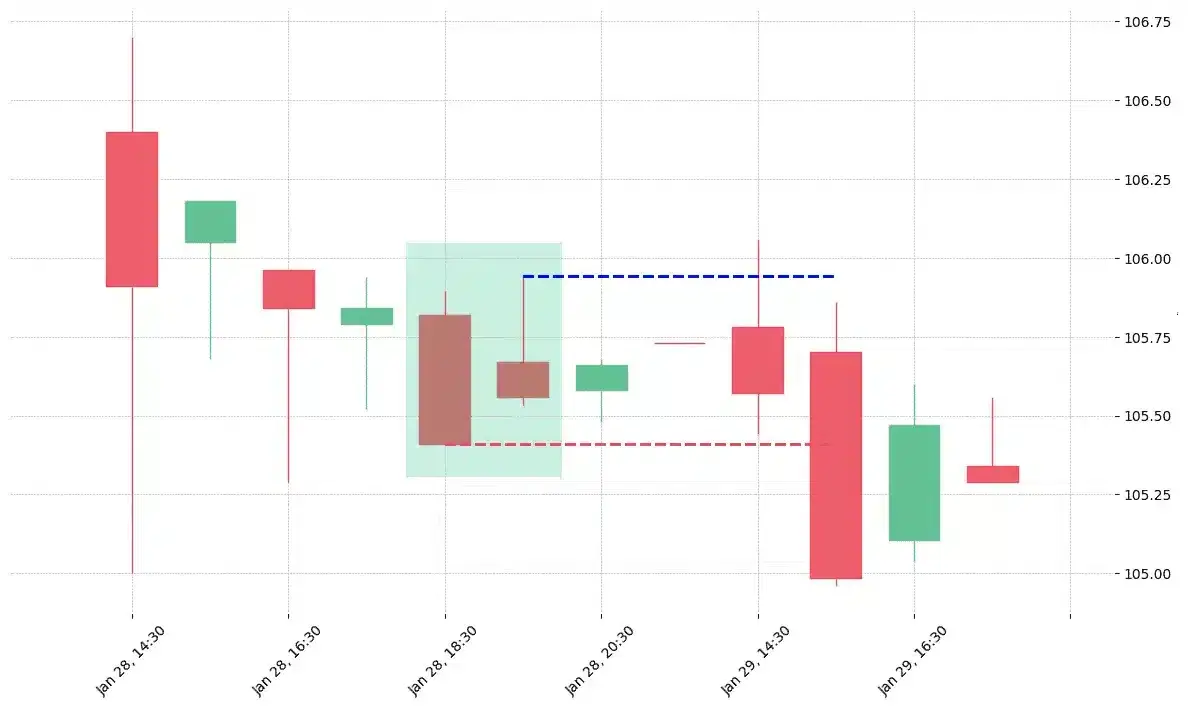
How does the Homing Pigeon pattern look in real life?

The cryptocurrency pair BCPT/BNB printed a bullish Homing Pigeon on 2018-03-18 22:00:00. It confirmed on 2018-03-19 14:00:00 (meaning price closed above entry level). It retested the trade entry level on 2018-03-20 02:00:00. Then it failed to reach the 2:1 R/R target and got stopped on 2018-03-21 22:00:00.
The cryptocurrency pair VIA/BTC printed a bullish Homing Pigeon on 2018-08-31 08:00:00. It confirmed on 2018-09-01 03:00:00 (meaning price closed above entry level). It retested the trade entry level on 2018-09-01 05:00:00. Then it failed to reach the 2:1 R/R target and got stopped on 2018-09-05 11:00:00.
The cryptocurrency pair WIN/USDC printed a bullish Homing Pigeon on 2019-09-26 16:00:00. It confirmed on 2019-09-27 07:00:00 (meaning price closed above entry level). It retested the trade entry level on 2019-09-27 08:00:00. Then it failed to reach the 2:1 R/R target and got stopped on 2019-09-30 04:00:00.
The stock ATVI printed a bullish Homing Pigeon on 1998-08-27. It confirmed on 1998-09-08 (meaning price closed above entry level). It retested the trade entry level on 1998-09-09. Then it failed to reach the 2:1 R/R target and got stopped on 1998-10-16.
The stock CNC printed a bullish Homing Pigeon on 2006-02-07. It confirmed on 2006-02-21 (meaning price closed above entry level). It retested the trade entry level on 2006-02-22. Then it failed to reach the 2:1 R/R target and got stopped on 2006-04-27.
The stock PEG printed a bullish Homing Pigeon on 2016-10-04. It confirmed on 2016-10-17 (meaning price closed above entry level). It retested the trade entry level on 2016-10-21. Then it failed to reach the 2:1 R/R target and got stopped on 2016-11-10.
The stock VZ printed a bullish Homing Pigeon on 2014-08-07. It confirmed on 2014-08-25 (meaning price closed above entry level). It retested the trade entry level on 2014-08-26. Then it failed to reach the 2:1 R/R target and got stopped on 2014-10-15.
The cryptocurrency pair GSC/BTC printed a bullish Homing Pigeon on 2020-07-10 10:00:00. It confirmed on 2020-07-11 06:00:00 (meaning price closed above entry level). It retested the trade entry level on 2020-07-11 07:00:00. Then it successfully reached the 2:1 R/R target.
The cryptocurrency pair ZEC/BTC printed a bullish Homing Pigeon on 2018-04-16 11:00:00. It confirmed on 2018-04-17 07:00:00 (meaning price closed above entry level). It retested the trade entry level on 2018-04-17 08:00:00. Then it successfully reached the 2:1 R/R target.
The stock PFE printed a bullish Homing Pigeon on 2009-07-29. It confirmed on 2009-08-19 (meaning price closed above entry level). It retested the trade entry level on 2009-09-03. Then it successfully reached the 2:1 R/R target.
The stock CMA printed a bullish Homing Pigeon on 2020-03-26 16:30:00. Unfortunately it invalidated on 2020-03-27 13:30:00 before the trade could trigger (it triggered the stop before entering).
The stock LIN printed a bullish Homing Pigeon on 2018-11-26 17:30:00. Unfortunately it invalidated on 2018-11-27 14:30:00 before the trade could trigger (it triggered the stop before entering).
The stock PNW printed a bullish Homing Pigeon on 2018-12-13 17:30:00. Unfortunately it invalidated on 2018-12-14 14:30:00 before the trade could trigger (it triggered the stop before entering).
The stock TPR printed a bullish Homing Pigeon on 2015-06-29. Unfortunately it invalidated on 2015-11-23 before the trade could trigger (it triggered the stop before entering).
The stock WST printed a bullish Homing Pigeon on 2019-01-28 18:30:00. Unfortunately it invalidated on 2019-01-29 15:30:00 before the trade could trigger (it triggered the stop before entering).

Looking to learn more about this pattern?
You should take a look at Joe Marwood's online course. In his course, he backtested the 26 main candlestick patterns before to summarize which one is THE best pattern. I really liked his course and you shouldn't miss it!
Click here to signup to his "Candlestick Analysis For Professional Traders" course now!

Russell Crane

Russell Crane

Russell is an Algorithmic & Technical Analyst Trader @ PatternsWizard.
His passion is to share his knowledge about TA, patterns & more. Why hope for your trading to work when you can precisely know the performance stat of every pattern?

Are Candlestick Patterns Reliable

candlesticksWe loved Marwood Research’s course “Candlestick Analysis For Professional Traders“. Do you want to follow a great video course and deep dive into 26 candlestick patterns (and compare their success rates)? Then make sure to check this course!

Want to know which markets just printed a Homing Pigeon pattern?

Market Timeframe Printed on

Get “Every Candlestick Patterns Statistics”, The Last Trading Book You’ll Ever Need! 📖

PatternsWizard book - Every Candlestick Patterns Statistics

"Every Candlestick Patterns Statistics", the last trading book you'll ever need!

Pre-register now and receive the candlestick patterns statistics ultimate ebook for free before anyone else!

"All you need is one pattern to make a living."
- Linda Raschke

Awesome move! We are giving the last touch to the "Every Candlestick Patterns Statistics" book. We are very excited to send it to you right when it's ready. In the meantime, we'd like to gift you our trading roadmap and its best 55 resources. You'll shortly receive an email with the link. Don't miss it ;) Stay tuned 📈