
 Good Trading requires the Best Charting Tool!
- The 5-0 pattern is a reversal harmonic pattern.
- It follows specific fibonacci ratios (which you can read more below)
Interested in learning more about harmonics pattern in general and you prefer videos to text?
You’ll love this two courses I shortlisted for you on Udemy:
- Forex Harmonic Pattern Trading – With Multiple Chart Examples: it’ll teach you step-by-step how to identify most harmonic pattern applied to forex markets.
- Harmonic Trading: The Art Of Trading With Low Risk: it’ll guide you to your first harmonic trades, what are potential reversal zones and it’ll give you practical applications so you can truly understand how to use it.
If you prefer to skip the learning part and are just looking for a harmonic patterns scanner, you might want to check this harmonic patterns screener here. You’ll get a 7-days free trial (+ 50% off your 1st month subscription if you decide to continue).
Or you can just continue reading and learn more with our article below about XABCD patterns.
What is the 5-0 harmonic pattern?
Just as it is with the shark pattern, the 5-0 harmonic pattern is a relatively new pattern. Carney discovered it and wrote about this pattern in the second book in his harmonic series, ‘Harmonic Trading: Volume Two’.
The 5-0 pattern is easily one of the wonkiest looking patterns. Depending on the amount of knowledge you have about harmonic patterns, the 5-0 will look different, and this is mainly because the 5-0 pattern begins a 0. If you are familiar with seeing XABCD, then 0XABCD will undoubtedly look different.
The patterns are relatively new but are getting more popular lately. It stands out from the other harmonic patterns because it is meant to begin a new trend rather than discover retracement. There are two types of this pattern, bullish and bearish.
The convergence zones discovered with the help of the shark pattern makes it possible for us to accurately detect the rebound but doesn’t necessarily lead to the restoration of the previous trend. On the other hand, regular rollbacks aim to determine the ability of the forces dominant on the market in the previous period (bears or bulls) to get the initiative back to their disposal. If they are not sufficient, the last reversal of the previous trend occurs, but already within another pattern – 5-0 harmonic pattern.
How to identify the 5-0 pattern?
The 5-0 pattern begins with either an uptrend or a downtrend which gets exhausted and draws zigzag like corrective movements. The qualities of the 5-0 pattern to look at include:
- AB movement has to be 1.13 to 1.618 retracement of XA.
- BC movement has to be 1.618 to 2.24 retracement of an AB.
- CD movement ought to be 0.5 retracements of BC
- C should be between 0.886 and 1.13 of 0X movement
If the conditions are satisfied, some traders trade the last leg of CD. They entering at C with a stop below 2.24 of AB retracement and aiming at 50 percent correction of BC movement.
The 5-0 harmonic pattern is traded when the price is getting to point D. The stop-loss is positioned a few ticks below/above the farthest possible D level. Unlike a lot of the other patterns, 5-0 doesn’t have specific targets because it usually begins a new trend. Here the pattern fib ratios don’t matter much. Entries might be done with a limit order or on price reversals away from point D. All entries have to be confirmed for risk/reward ratio. Entries having less risk/reward have to be taken cautiously or discarded altogether.
A reliable indicator should automatically scan for, recognize, display, and alert emerging 5-0 and other harmonic chart patterns. It indicates the name of the pattern, when it happened, and the stop price. The pattern scanner goes through various charts in the same period and assists traders to find trading opportunities as soon as they come up.
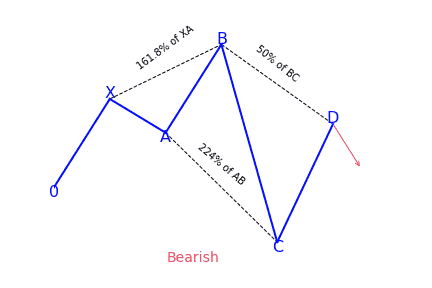
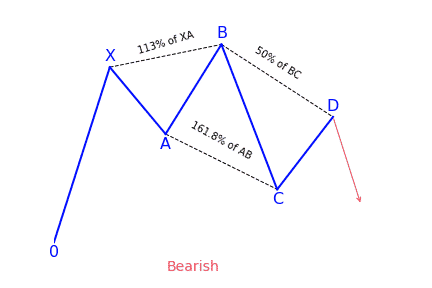
Bearish 5-0 pattern
To correctly identify the bearish 5-0 pattern, first, find the shark pattern, wait for the implementation of its targets at 88.6 or 113 percent, and the following rollback in the direction of 50 percent of the BC wave. The length of this wave in both graphic configurations is 161.8 to 224 percent of AB. If after the convergence zones of the shark pattern is reached, a correction in the direction of 23.6 percent, 38.2 percent, or 50 percent has followed, we can talk about the transformation of the real pattern into 5-0.
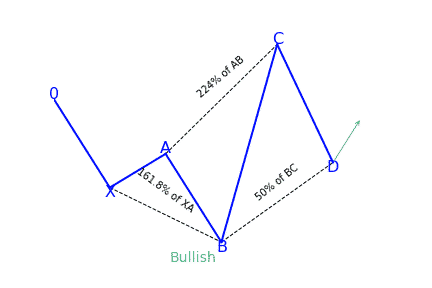
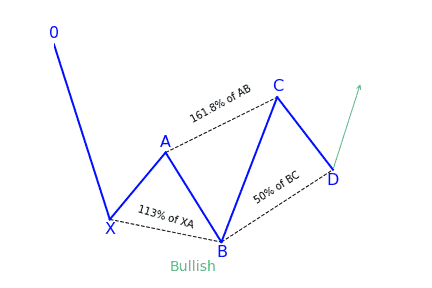
Bullish 5-0 pattern
After the target at 113 percent of the shark harmonic pattern was achieved, it was followed by a rollback in the direction of 38.2 percent of the CD wave. The trader has to search for this place for confirmation signals to create a long position. It can be both indicators, prompts from price action, or other items and techniques used for technical analysis.
What does the 5-0 pattern tell traders?
The 5-0 harmonic chart pattern suggests a long entry upon completion of the pattern or confirmation of the D point of the pattern. The pattern is a unique 5-point reversal structure that typically shows the first pullback of an important trend reversal. It is a relatively new pattern that has 4 legs and particular Fibonacci measurements of each point within the structure, creating room for better flexible interpretation. The Potential Reversal Zone (PRZ) is described differently from other harmonic chart patterns.
Conservative traders look for more confirmation before getting into a trade. Targets for this pattern can be placed at the discretion of the trader as the reversal point could be the beginning of a new trend. Common stop-loss levels are found behind a structure level beyond the D point or the next vital level for the Fibonacci sequence.
How to trade when you see the 5-0 pattern?
One of the best processes of interpreting this pattern is to look at it from a tired and frustrated trader’s point of view. Taking the bullish 5-0 pattern as an example, then we can see why. The AB leg ends with B below X, making a lower low. We then get a longer move in time where the BC leg is the most prolonged move with C ending over A.
The movement from B to C may look like a bear flag or bearish pennant. C to D indicates intense shorting pressure and a belief among bears that new lows are on the way. Rather, we get to D – the 50 percent retracement of BC. Rather than new lower lows, we get a confirmation swing forming a higher low. That move will most probably create a brand new trend reversal or significant corrective move.
The elements of trading the pattern
- The pattern starts (with 0) at the beginning of a long price move
- After 0 has formed, an impulse reversal at X, A, and B should have a 113 to 161.8 percent extension
- The projection off of AB has a 161.8 percent extension requirement to C. C can extend beyond the 161.8 percent extension but not beyond 224 percent.
- D is the 50 percent retracement of BC and is same as AB
- The reciprocal AB=CD is needed
Drawing the pattern properly
To perfectly draw or locate a 5-0 harmonic chart pattern on the price chart, first of all, we need to locate the X and A points of the pattern. The X point is seen at the bottom of a strong bearish trend. The A point is found at the top of a bullish trend. The next thing traders need to do is to draw a Fibonacci retracement tool from X to A to determine the B point of the chart pattern. The B point should be within the 113 percent to 161.8 percent Fibonacci retracement of XA.
In the last step, we will get the entry point, D point, of the 5-0 harmonic chart pattern. To get the D point of the pattern, draw a Fibonacci retracement tool from B to C. The D point has to be at the 50 percent Fibonacci retracement of BC.
Traders can be sure when the D point of the pattern is confirmed. Also, the stop-loss for the order should be set at the lower support level. As a result, the profit target for the order should be placed within the 50 to 88.6 percent Fibonacci retracement of CD.
The C axis can also be traded, if it is the D point of a bearish harmonic chart pattern. The B point can be traded if the entries are confirmed by the other tools for technical analysis.
Looking for a scanner to automatically pick your harmonic patterns?
Looking for a way to automatically find harmonic patterns in your favorite markets?
You definitely need a screener for that! Check out this harmonic patterns scanner here!
If you come from us (simply click the link below), you’ll get a 7-days free trial and 50% off your first month’s subscription fee. Don’t think more, go test it out for free now!
Click here to signup and claim your 7-days free trial to the best harmonic pattern scanner.


 We loved Marwood Research’s course “Candlestick Analysis For Professional Traders“. Do you want to follow a great video course and deep dive into 26 candlestick patterns (and compare their success rates)? Then make sure to check this course!