
 Good Trading requires the Best Charting Tool!
To interpret candlestick patterns, you need to look for particular formations. These candlestick formations assist traders know how the price is likely to behave next. In this article, we will go in-depth into the Three Inside Up / Down candlestick pattern.
Some candlestick patterns are reversal patterns, which indicate the end of the current trend and the beginning of a new trend in the opposite direction. Other candlestick patterns are continuation patterns that indicate a pause and then the continuation of the current trend.
A three inside up pattern is made up of four candlesticks that appear close to support levels. The first candlestick is bearish, the second is a spinning top or doji that forms a bullish harami, and the other two candlesticks form higher highs and the forth candle forms a bullish reversal pattern.
These patterns consist of three candlesticks and it is bullish reversal. It also contains another bullish reversal pattern known as the bullish harami, which is a two candlestick pattern.
Stock charts are comprised of candlestick patterns. These candlesticks tell a story whether on their own or when grouped together. Basically, the market is a practice in buying and selling emotion. Traders may make or lose money based of emotion. Fear and greed move markets.
- The Three Inside Up candlestick pattern is a 3-bar bullish reversal pattern.
- It is made of a large red candle, a smaller up candle contained within the first one, and then another green (up) candle closing above the previous one.
- The Three Inside Down candlestick pattern is the upside down pattern. It’s a bearish reversal pattern.
- It is made of a large green candle, a smaller down candle contained within the first one, and last a red candle closing below the previous one.
Statistics to prove if the Three Inside Up & Down patterns really work
Are the odds of the Three Inside Up and Three Inside Down pattern in your favor?
How does the Three Inside Up and Three Inside Down behave with a 2:1 target R/R ratio?
From our research the Three Inside Up and Three Inside Down pattern confirms 72.8% of the time on average overall all the 4120 markets we analysed. Historically, this patterns confirmed within 3.3 candles or got invalidated within 8.1 candles. If confirmed, it reached the 2:1 R/R target 35.4% of the time and it retested it's entry price level 98.1% of the time.
Not accounting for fees, it has an expected outcome of 0.062 $/$.
It means for every $100 you risk on a trade with the Three Inside Up and Three Inside Down pattern you make $6.2 on average.
Want to account for your trading fees? Have the detailled stats for your favorite markets / timeframes? Or get the stats for another R/R than 2:1?
🚀 Join us now and get fine-tuned stats you care about!
How to handle risk with the Three Inside Up and Three Inside Down pattern?
We analysed 4120 markets for the last 59 years and we found 68 085 occurrences of the Three Inside Up and Three Inside Down pattern.
On average markets printed 1 Three Inside Up and Three Inside Down pattern every 229 candles.
For 2:1 R/R trades, the longest winning streak observed was 9 and the longest losing streak was 25. A trading strategy relying solely on this pattern is not advised. Anyway, make sure to use proper risk management.
Keep in mind all these informations are for educational purposes only and are NOT financial advice.
If you want to learn more and deep dive into candlestick patterns performance statistics, I strongly recommend you follow the best available course about it. Joe Marwood (who's a famous trader with more than 45 000 Twitter followers) created an online course called "Candlestick Analysis For Professional Traders" in his Marwood Research University. There he will take you through the extensive backtesting of the 26 main candlestick patterns. He then summarizes which one is THE best pattern. Do you know which one it is?
Remember, don't trade if you don't know your stats. Click here to signup to the course now!
What is the Three Inside Up/Down Pattern?
Three inside up and three inside down are three-candle reversal patterns that form on candlestick charts. The pattern needs three candles to form in a particular sequence, indicating that the current trend has lost momentum and a move in the other direction might be starting.
Three Inside Up pattern
The three inside up candlestick pattern is similar to the morning star triple candlestick pattern – it shows a potential trend reversal found at the end of a downtrend. Traders may believe the pattern more than a bullish harami because a confirmation candle may be present. It is easier to trust because of the assurance it gives. The characteristics of the pattern are:
- The first candle is long and bearish, showing that the market is still in a downtrend.
- The second candle is bullish and is ideally close at the halfway mark of the first candle.
- The third candle is also bullish and closes above the open of the first candlestick, mostly above the high of the second candle.
Three Inside Down pattern
The three inside down candlestick pattern is the opposite of the three inside up pattern and shows a trend reversal located at the end of an uptrend.
- The first candle is long and bullish, showing that the market is still in an uptrend.
- The second candle is bearish and ideally closes at the halfway mark of the first candle.
- The third candle is also bearish and closes above the open of the first candle, mostly below the low of the second candle.
How to identify the Three Inside Up & Down pattern?
- First, a downtrend should be happening.
- Second, a tall black (or red) candle has to appear, continuing the downward movement.
- Third, a small white (or green) candle has to form on the following day, and its body has to be contained within the body of the previous day. Either the tops or the bottoms of the bodies may be the same price.
- Fourth and finally, another white (or green) candle must appear, closing above the close of the prior day.
As mentioned above, this is a confirmed bullish harami pattern. The first two candles make up the harami, and the third confirms the bullish reversal. Traders are more likely to trust the reversal because of that last candle, which offers assurance.
If you see a grouping of candles that seem to be the opposite of this one (a big white candle, a small black candle found within it, and a black candle that closes below the close of the prior day), you may have located a three inside up/down candlestick pattern.
Finally, observe how similar this pattern is to the morning star. The major difference is that in the three inside up, the second candle has to be contained within the body of the first candle. Also, in the morning star, the final candle has to close at least halfway up the candle of the first day.
What does the Three Inside Up/Down pattern tell traders?
A reversal candlestick pattern signal is stronger if it occurs after a steep trend because the markets can hardly sustain a quick price movement; a correction can usually be expected.
If the second candle does not get to the halfway point of the first candlestick, but the third still closes beyond the open or the low of the first candle, it may be seen as a valid three inside down pattern.
Formation of this candlestick pattern speaks about the market sentiments that the bulls are trying to take over the bears. The third day formation of a bullish candle, forming a new high, offers more confirmation of bulls rally is going to continue.
How to trade when you see the Three Inside Up/Down pattern?
This pattern is an interesting signal to have in your trading tool belt
Even though a lot of new traders would try and apply the three inside up to their market as soon as they have learned about it, this isn’t a good idea! Of all candlestick patterns out there none is worth trading in its raw form. You need to include filters that get rid of some of the false trades, and make the pattern worthwhile. You also have to ensure that you trade a market and timeframe where the pattern works well. It is recommended that you make use of back testing to know where the pattern works.
The pattern doesn’t necessarily have to be traded. It can just be used as an alert that the short-term price direction may be changing.
For traders that do wish to trade it, a long position can be entered close to the end of the day on the third candle, or on the following open for a bullish three inside up. A stop-loss can be set below the low of the third, second, or first candle. This depends on how much risk the trader is willing to take.
For a bearish three inside down, a trader could enter a short position close to the end of the day on the third candle or at the open the next day. A stop-loss can be placed above the high of the third, second, or first candle.
The patterns do not have profit targets; therefore, it is best to use another method for deciding when to take profits, if they develop. This could include using a trailing stop-loss, leaving at a particular risk/reward ratio, or making use of technical indicators or other candlestick patterns to indicate an exit.
A quite common pattern
The pattern is generally common, and therefore not always dependable. It is also short-term, so, while it may occasionally lead to major trend changes, it may bring about only a small to medium-sized move in the new direction. Following the pattern, the price may not follow through in the direction expected at all, and may instead change course once again, in the direction of the original trend.
Trading in the same direction as the long-term trend could help improve the performance of the pattern. Therefore, during a general uptrend, consider looking for the three inside up during a pullback. This could indicate that the pullback is over and the uptrend is coming back.
During a downtrend, observe for the three inside down preceding a small move higher. This could indicate the end of the higher move and the resumption of the downtrend.
Idea of a trading process
- Watch for first bearish candlestick to form
- Next, watch for second smaller spinning top or doji candlestick to form
- Then, watch for third and fourth candlesticks to form higher highs
- Take a long position once price breaks above the fourth candlestick
- Put a stop below the fourth candle
- Some traders usually take short positions once price breaks below fourth candle
- Then place stop above the fourth candle
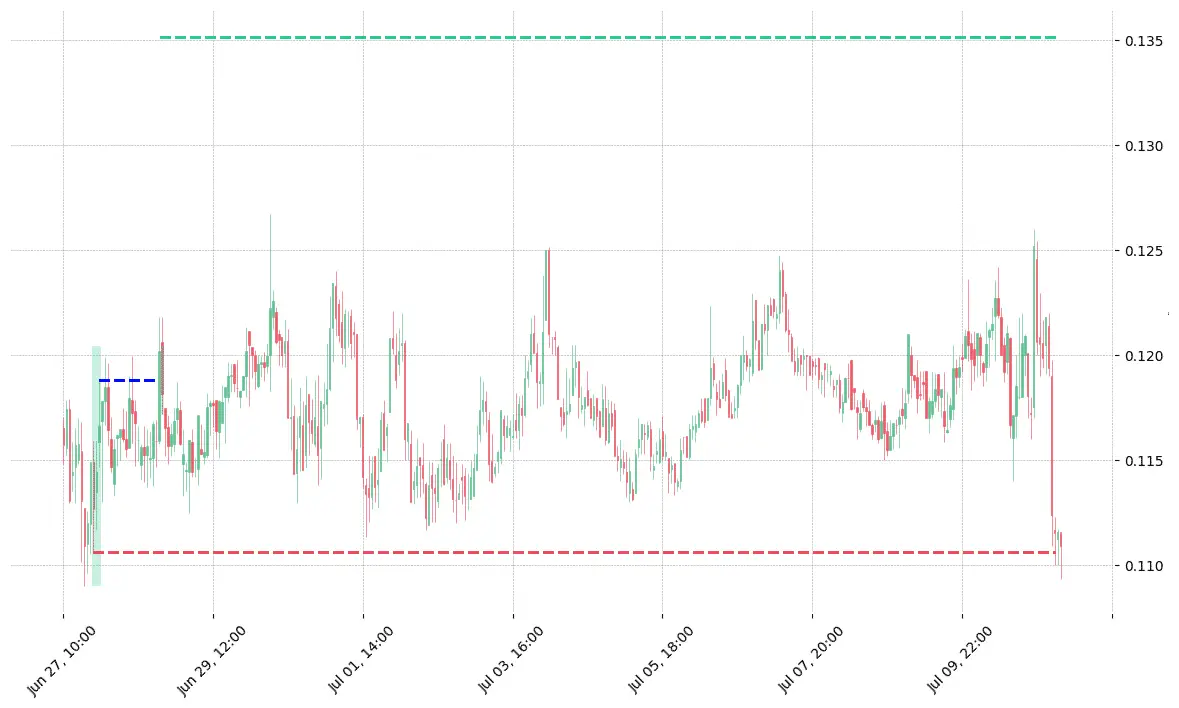
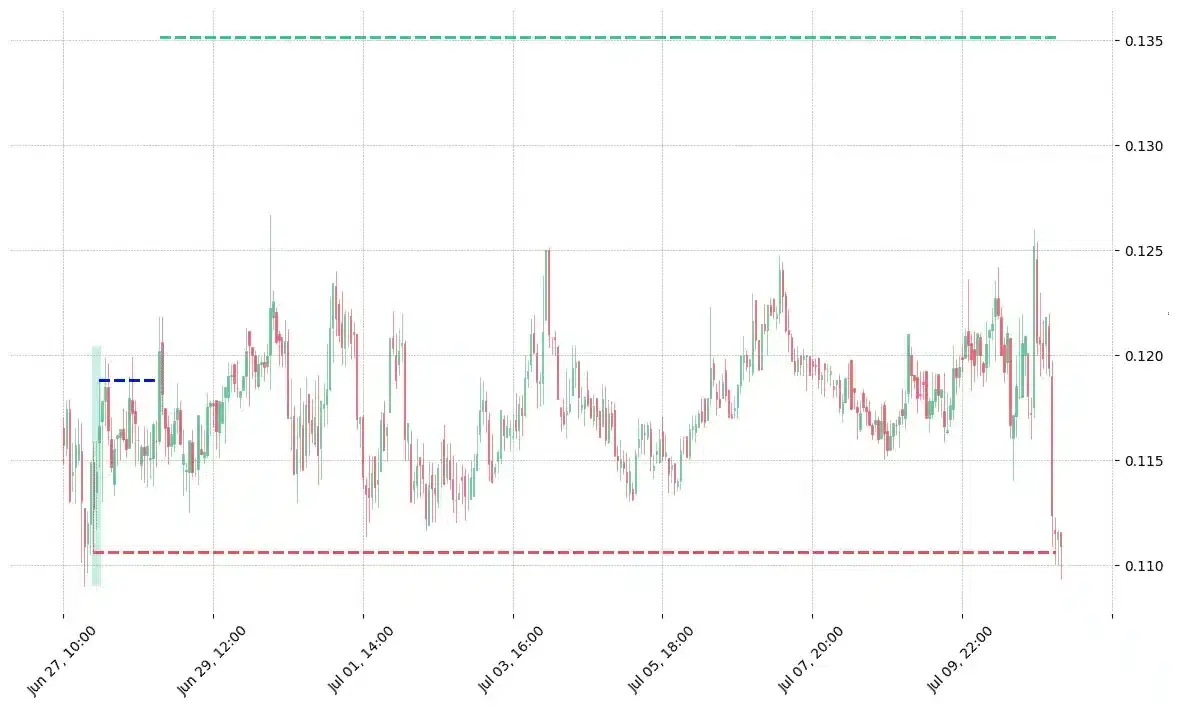
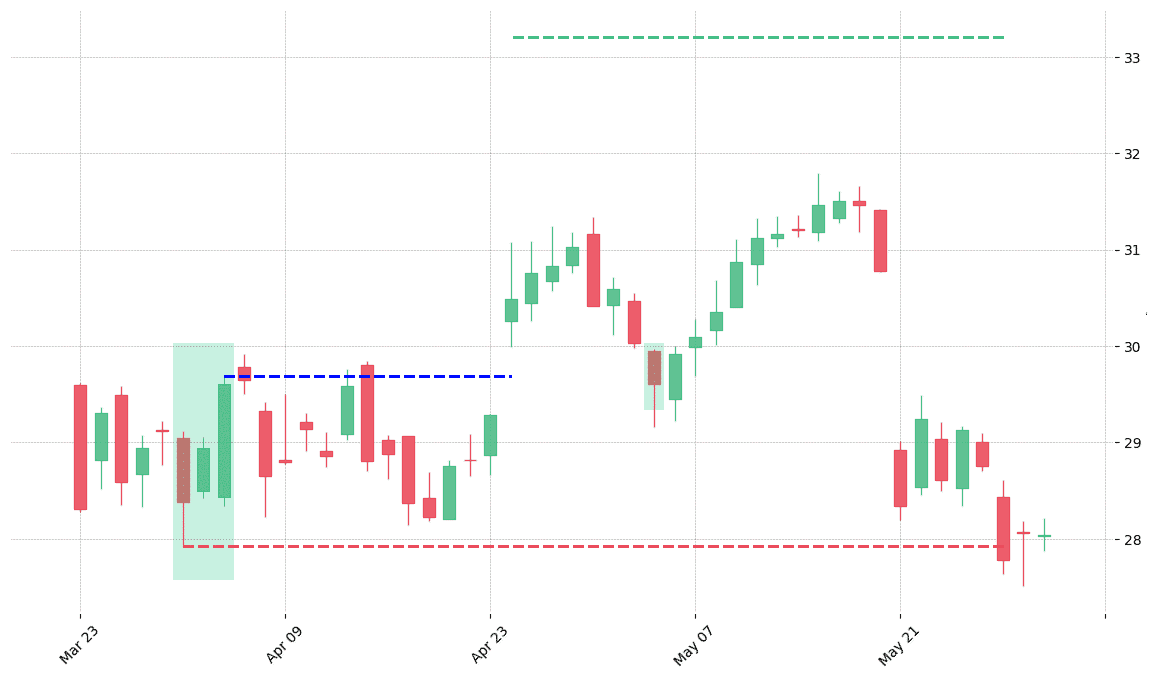
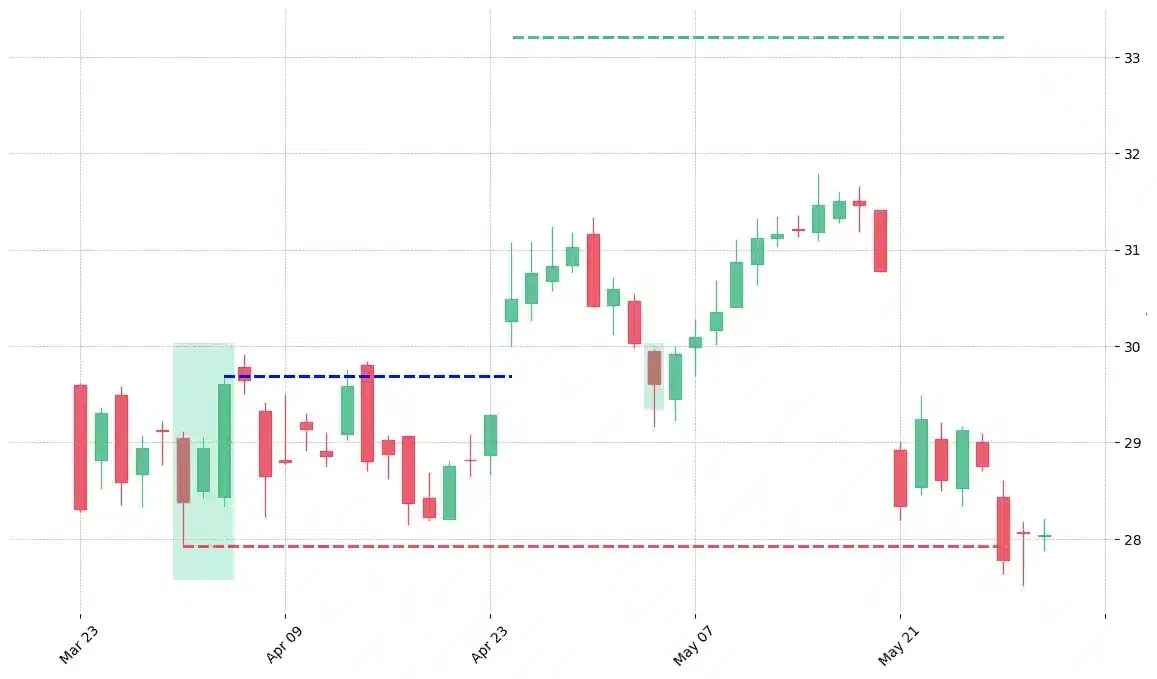
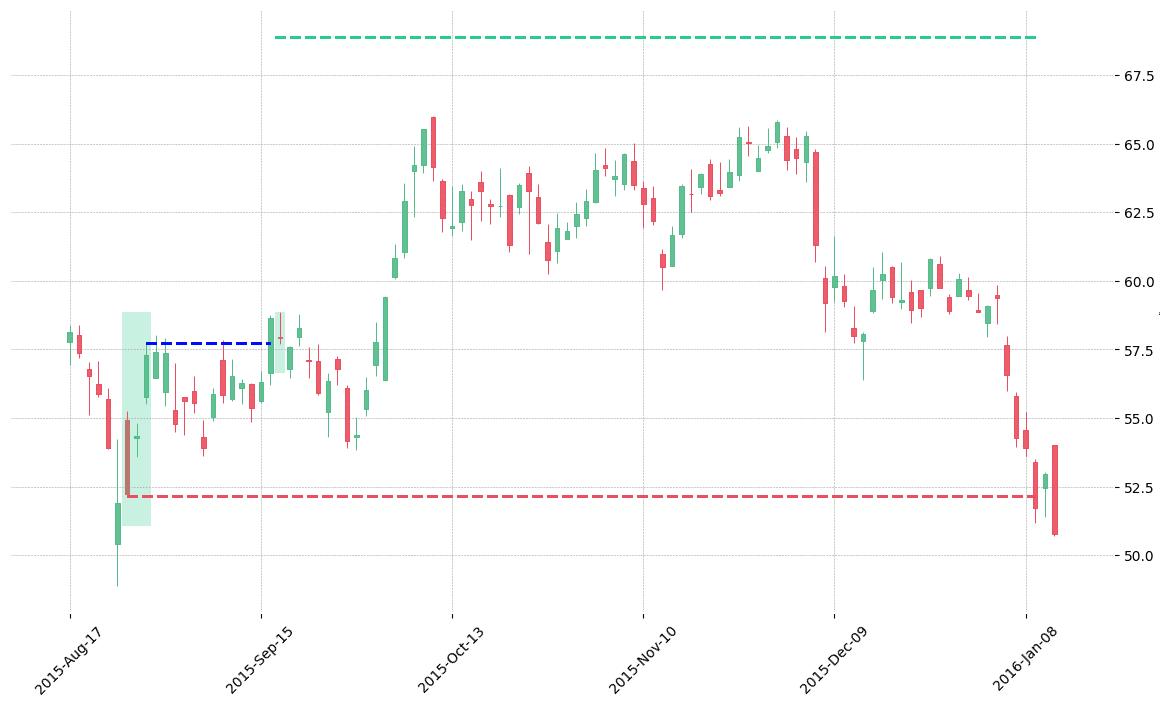
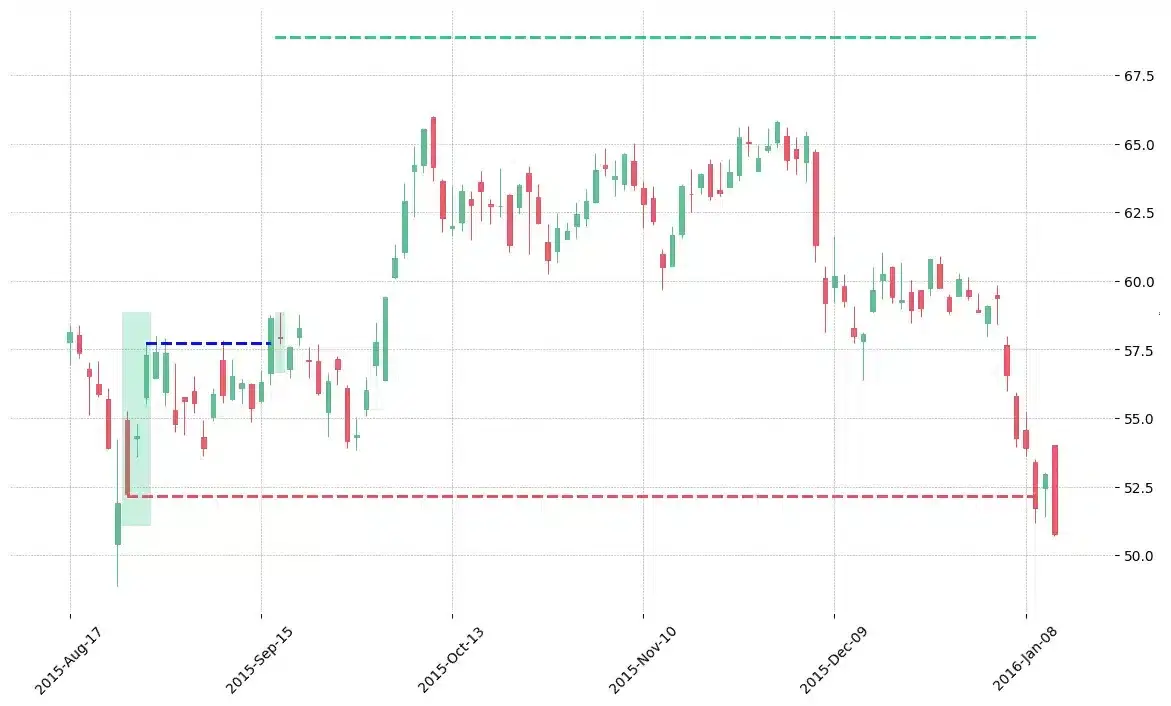
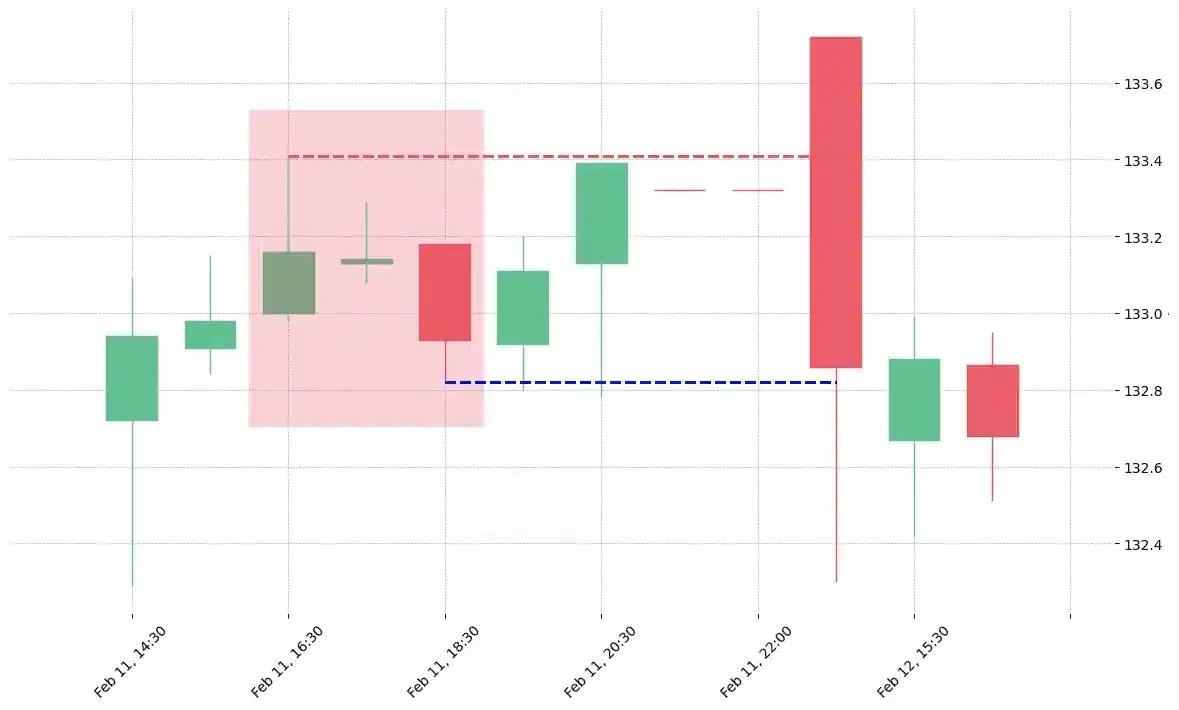
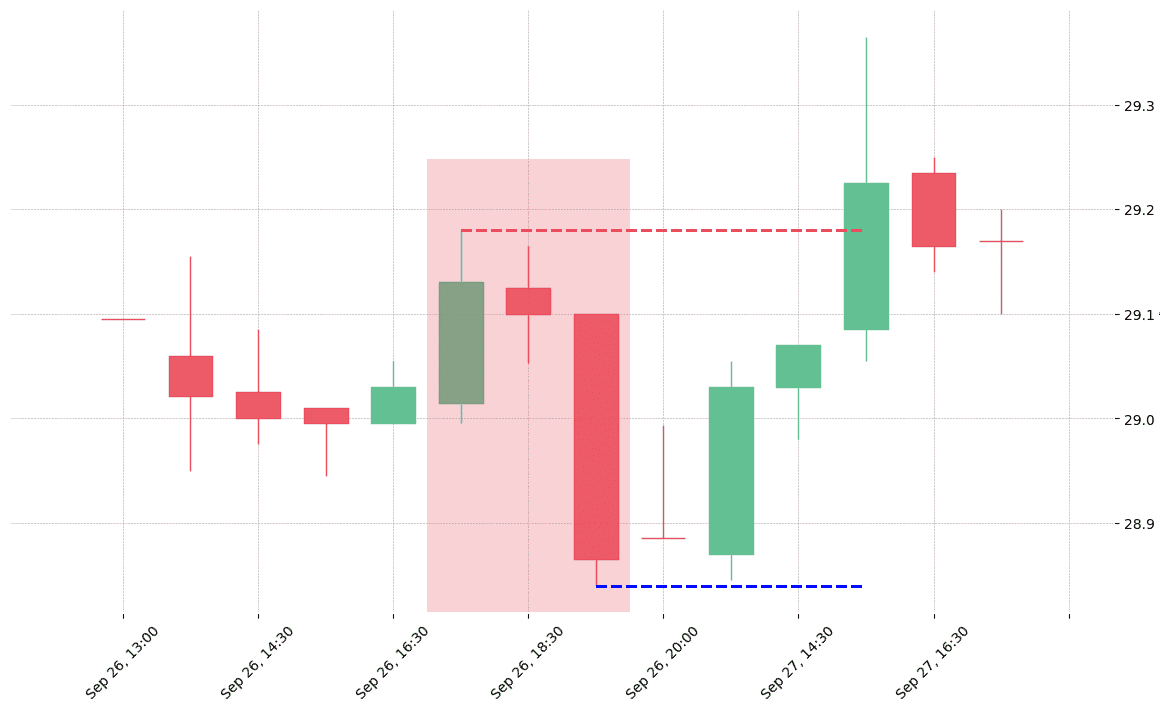
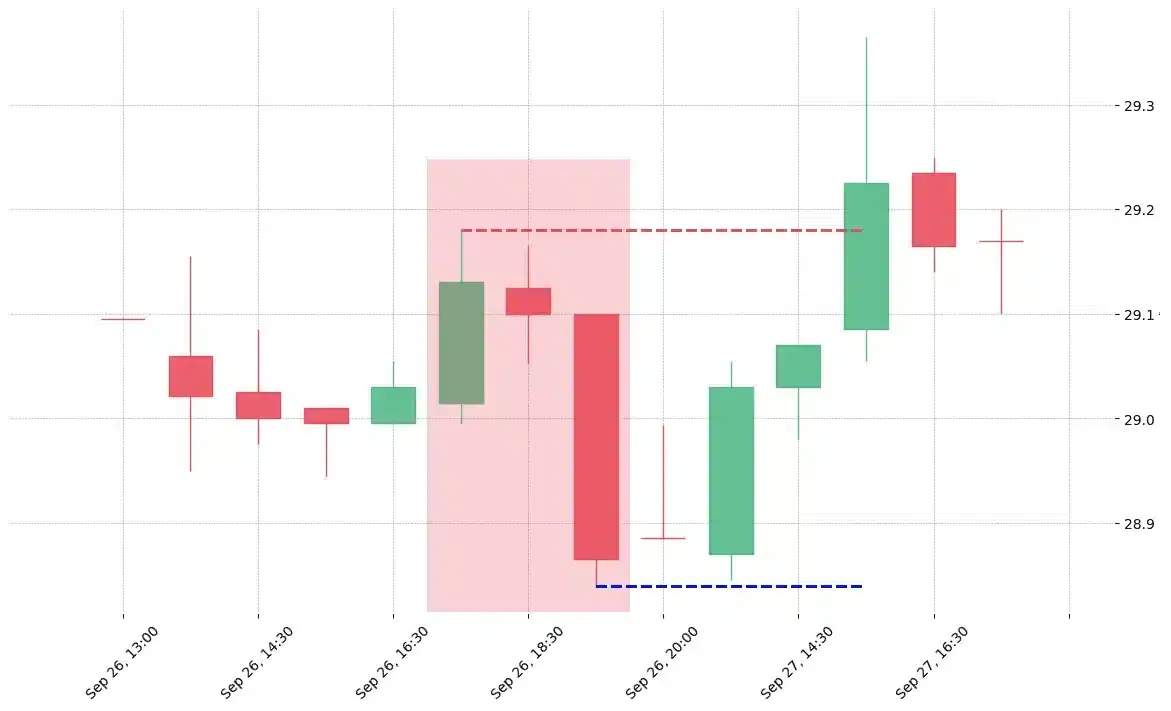
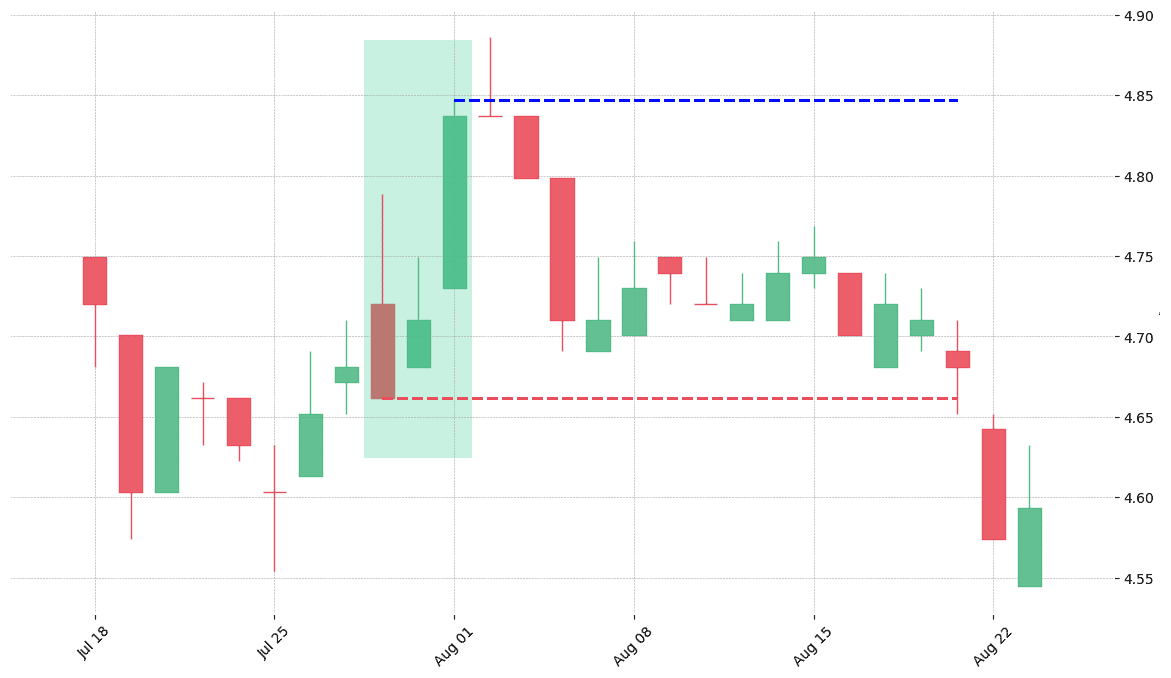
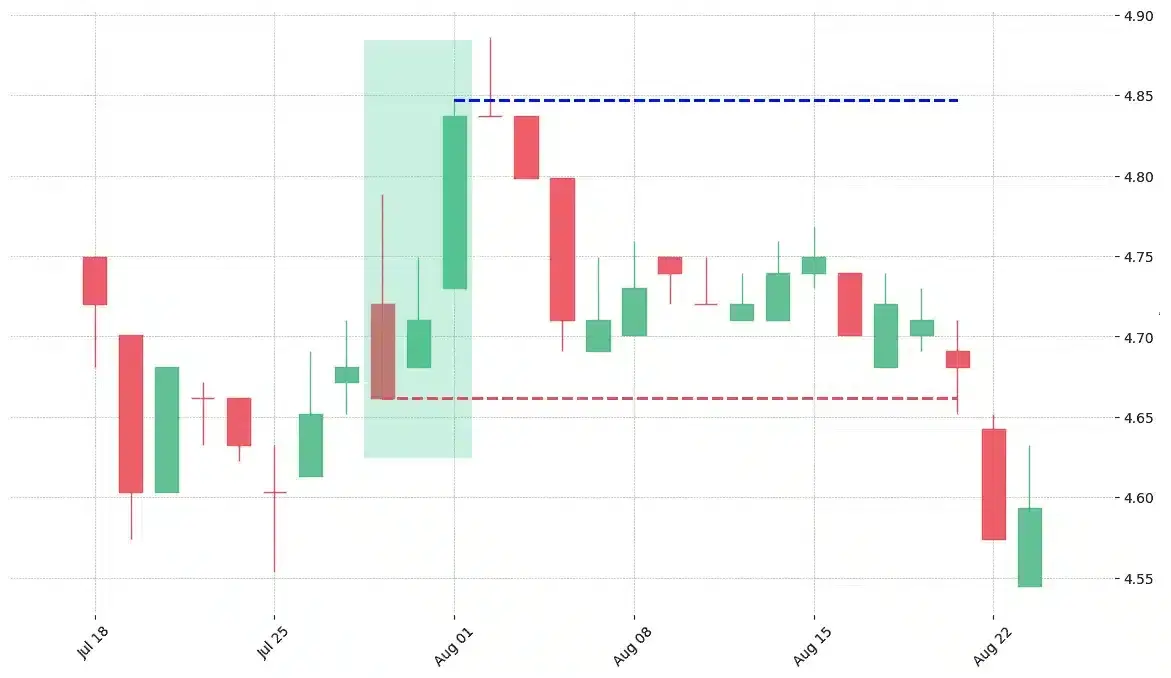
How does the Three Inside Up & Down pattern look in real life?

Looking to learn more about this pattern?
You should take a look at Joe Marwood's online course. In his course, he backtested the 26 main candlestick patterns before to summarize which one is THE best pattern. I really liked his course and you shouldn't miss it!
Click here to signup to his "Candlestick Analysis For Professional Traders" course now!


 We loved Marwood Research’s course “Candlestick Analysis For Professional Traders“. Do you want to follow a great video course and deep dive into 26 candlestick patterns (and compare their success rates)? Then make sure to check this course!