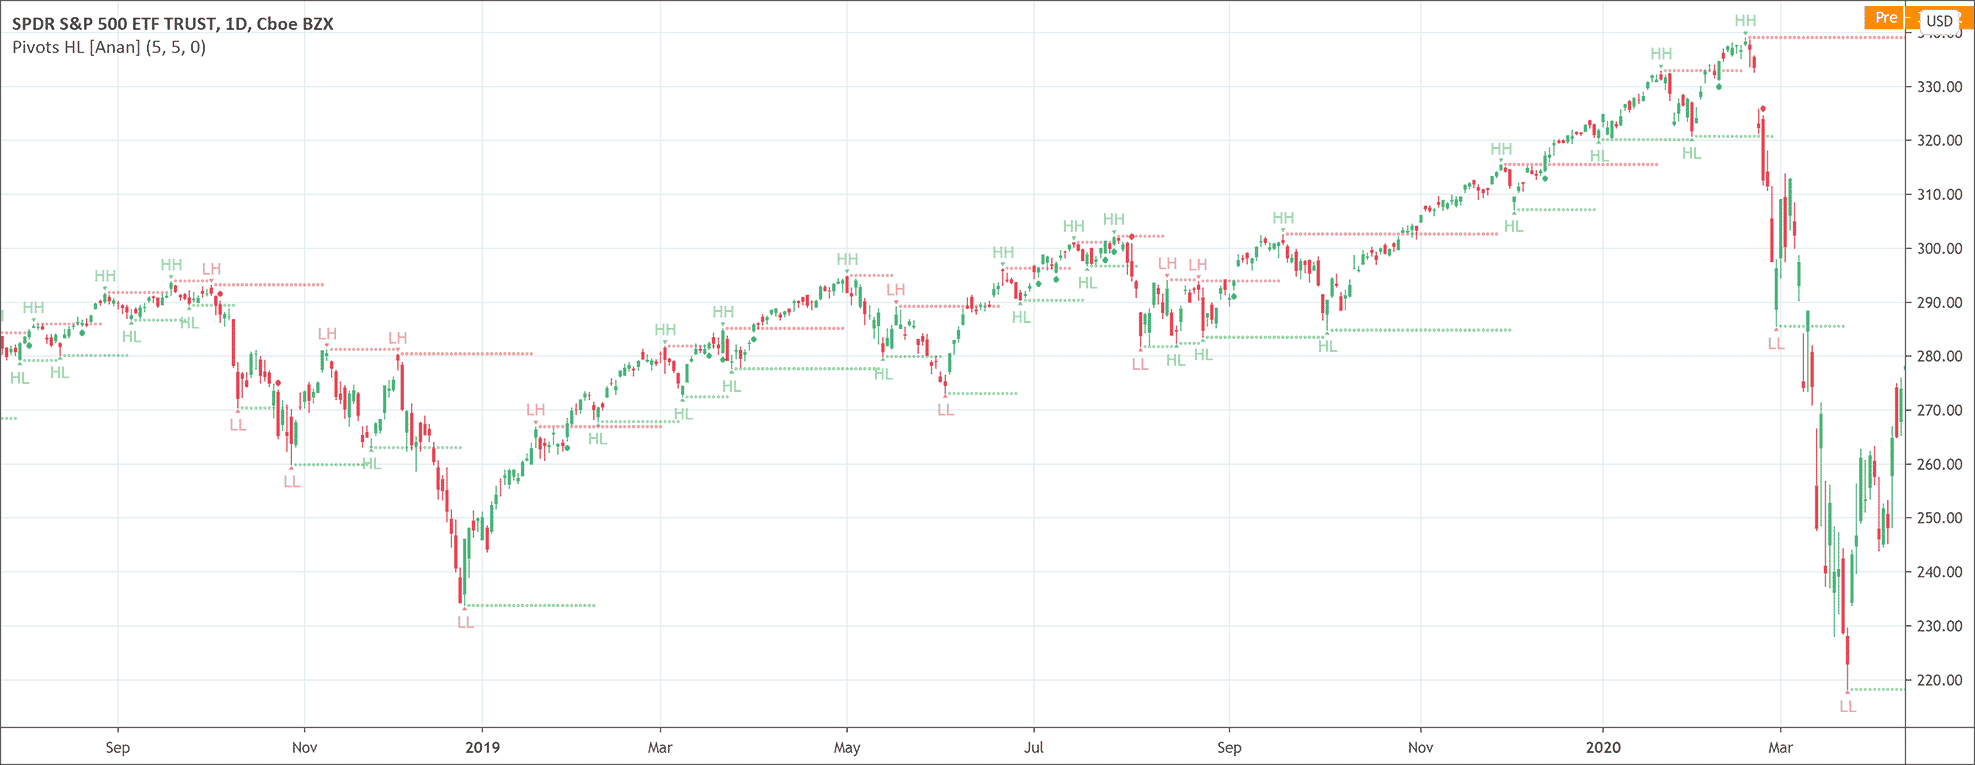
- The Pivot Point (High/Low) indicator is a technical analysis tool that helps to anticipate potential reversals of prices in the market.
- It charts on the market extreme points (highs and lows).
The Pivot Point (High/Low) indicator is a technical analysis tool that helps to anticipate potential reversals of prices in the market. It is also called the Bar Count Reversals. The Pivot Point (High/Low) indicator is a very useful indicator for traders because it tells traders about scenarios where they can gain a lot. For example, it helps traders to identify a pullback during an uptrend or identify when a trading range ends.
How does the Pivot Point (High/Low) indicator work?
The Pivot Point (High/Low) indicator or the Bar Count Reversals works on the basis of Pivot Point highs and Pivot Point lows. Pivot Point High calculations indicate the number of lower high bars on both sides of a Pivot Point High. On the other hand, the Pivot Point Low calculations indicate the number of higher lows on both sides of the Pivot Point Low.
That is a bit complicated but not after considering an example. Suppose a Pivot Point High needs to have 11 bars for being a valid Pivot Point High. Then, it must have 5 bars with lower highs on either side of it. Similarly, a Pivot Point Low needs to have 11 bars for being a valid Pivot Point Low. Then, it must have 5 bars with higher lows on either side of it.
The significance of the Pivot Point is the most important element of the Bar Count Reversals. Traders can assess the significance of the Pivot Point by looking at the trend. The Pivot Point is more significant when the trend before and after the Pivot Point is longer. These Pivot Points eventually help traders to determine where to draw the trend lines on a trading chart to visualize the price patterns.
High 1 and High 2 of the Pivot Point (High/Low) indicator
The High 1 will be the first bar having a high price above the high price of the previous bar. There must be a sideways or down move within a trading range or an uptrend for the High 1 to appear. The High 1 temporarily halts the downtrend or sideways trend. This continues to happen until the next time a bar appears with a high price above the high price of the preceding bar. This second bar will be the High 2.
Low 1 and Low 2 of the Pivot Point (High/Low) indicator
The Low 1 will be the first bar having a low price below the low price of the previous bar. There must be a sideways or up move within a trading range or a downtrend for the Low 1 to appear. The Low 1 temporarily halts the uptrend or sideways trend. This continues to happen until the next time a bar appears with a low price above the low price of the preceding bar. This second bar will be the low 2.
How to trade with the indicator?
Traders should buy a higher low during an uptrend or buy a higher low in a downtrend (which is a risky move against the trend). Conversely, they should sell a lower high during a downtrend or sell a lower high in an uptrend (which is again a risky move against the trend).

 Good Trading requires the Best Charting Tool!

 We loved Marwood Research’s course “Candlestick Analysis For Professional Traders“. Do you want to follow a great video course and deep dive into 26 candlestick patterns (and compare their success rates)? Then make sure to check this course!