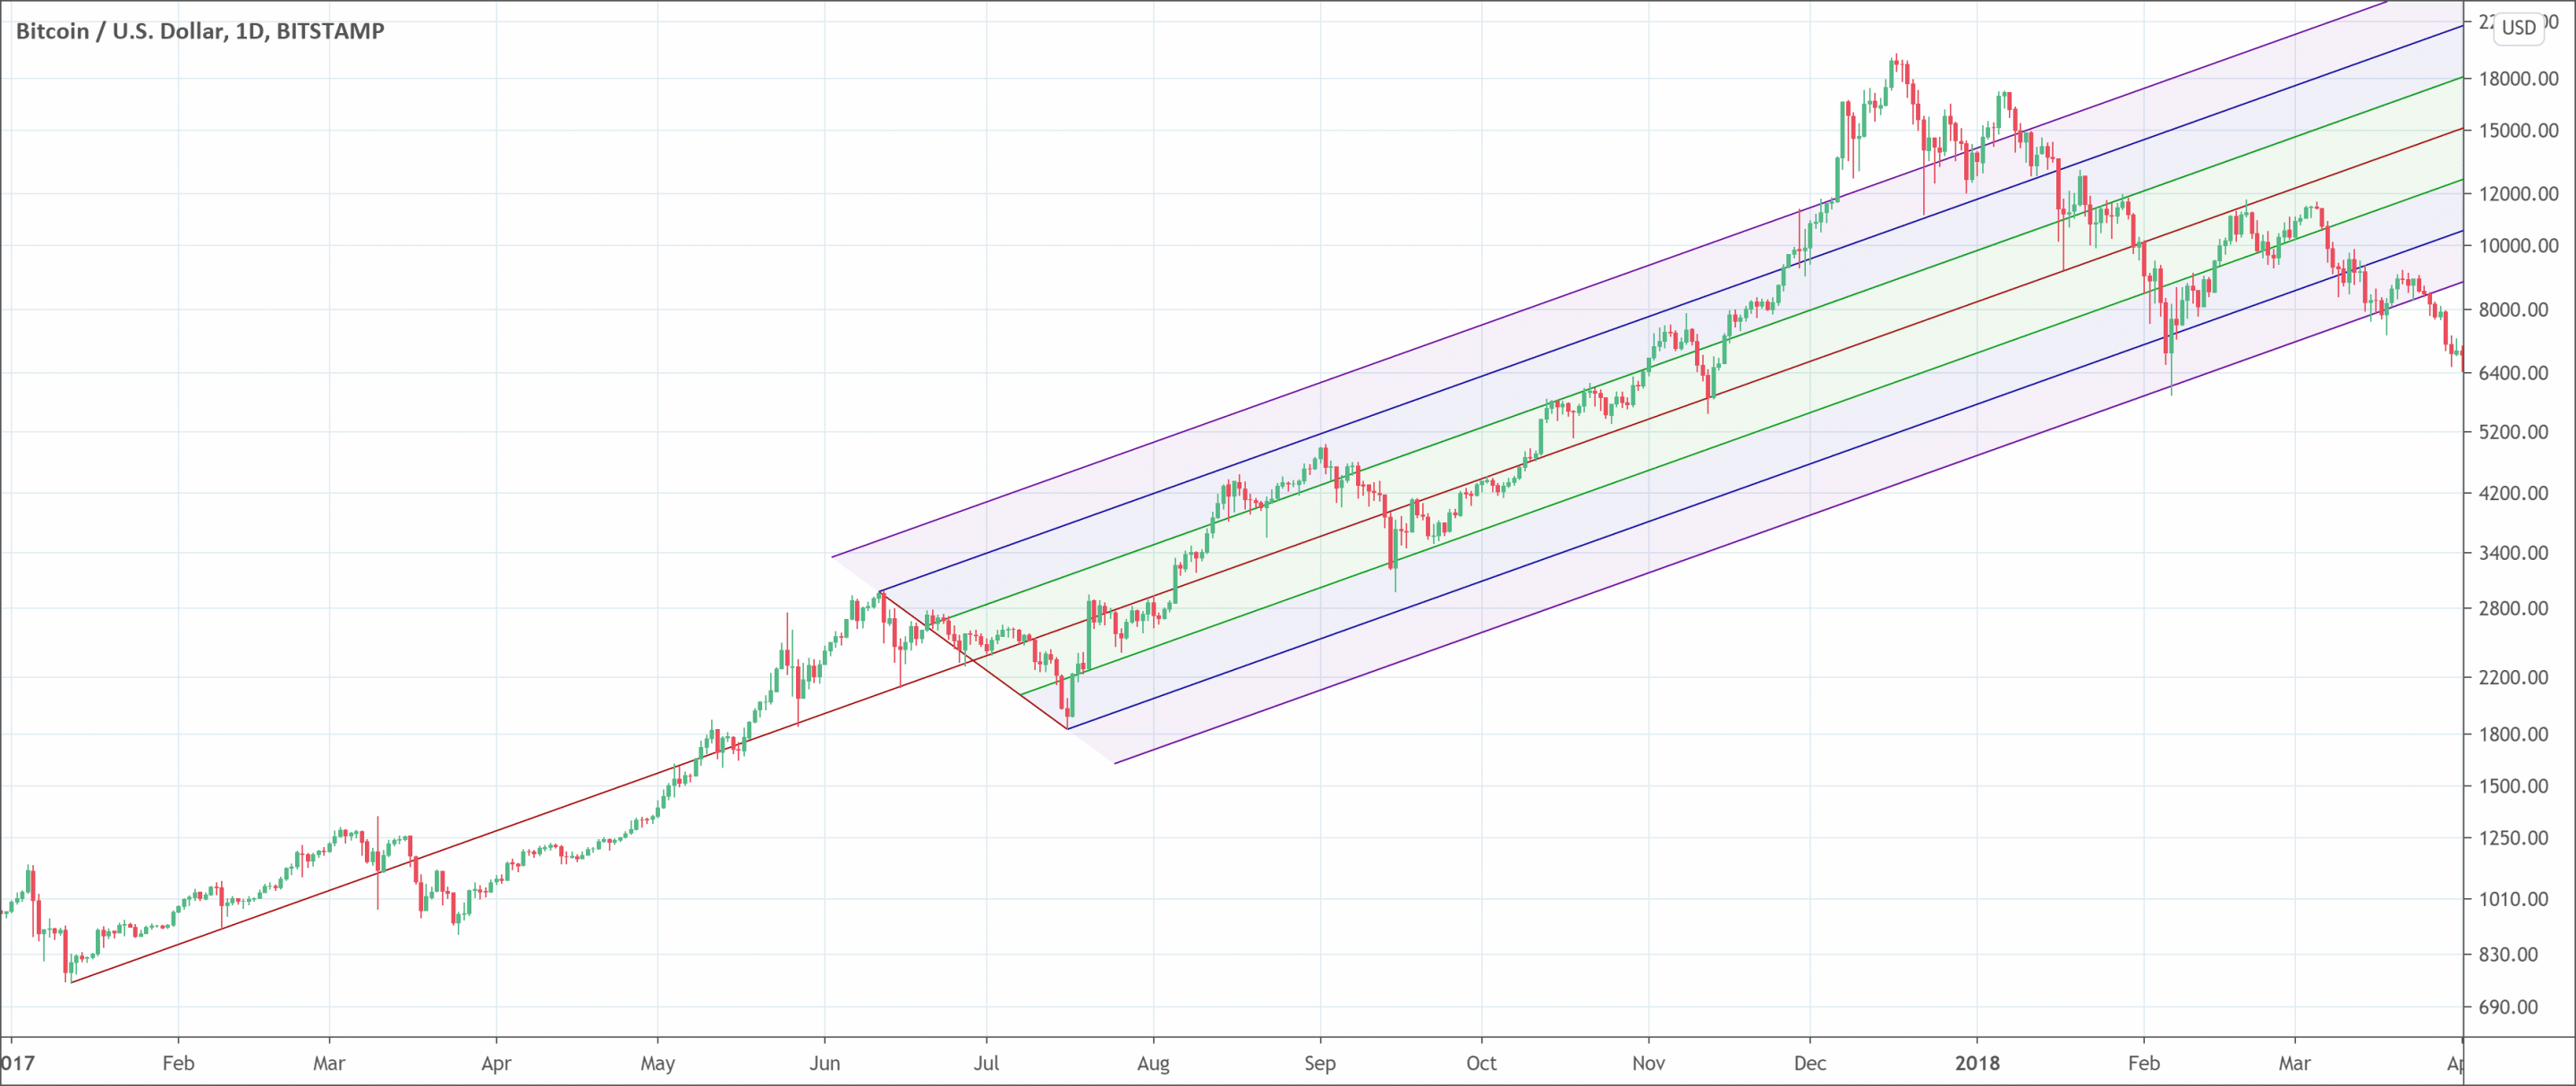
- Andrew’s pitchfork uses three points to create a channel.
- Pitchfork lines act a resistance and support for the price.
- Pitchfork’s drawing is subject to personnal taste and can be controversial among traders
Andrew’s Pitchfork, also known as the International Line Study, is a technical analysis technique that uses three trend lines to display areas of support and resistance. Three consecutive major highs or lows create the three parallel trend lines and each point is also an important pivot point. The first two points show the trendline while the last two points plot the channel. After the establishment of a connection between the last two points, the channel completes. After the addition of the median line, the plot of the Andrew’s Pitchfork resembles a fork, hence, it has the name “Pitchfork”.
Alan H. Andrew invented the Pitchfork strategy. Andrew was a master trader and his Pitchfork strategy is a master trading strategy as well. Andrew’s Pitchfork has become very popular among traders to obtain profitable swing opportunities in the trading market. Apart from identifying areas of support and resistance, Pitchfork helps to identify and measure the periods affecting the activity points. Traders have got what they desired the most in the form of the Pitchfork indicator because of which they can easily seek and monitor trends.
How to pick the three points of Andrew’s Pitchfork?
The identification of the three points is the first step to use Andrew’s Pitchfork, therefore, it is crucial to grasp the idea. Traders may follow the following steps to pick all the three points of the Pitchfork.
- Identify a high or low point previously appeared on the trading chart. This point will provide the basis to draw the first point or pivot labeled as point A.
- Identify both, a peak and a trough to the right of the first pivot after establishing the point A. It is important to note that it will be a correction in the opposite direction of the previous higher or lower movement. This correction provides the basis for point B and point C.
Once these three points have been mentioned, traders can easily place the Andrew’s Pitchfork application. Pivot point A gives rise to the handle of the formation and that handle serves as the median line. The two other points B and C serve as the support and resistance levels of the trend.
Main rules of the Andrew’s Pitchfork
The working of the Andrew’s Pitchfork depends on certain rules. The following are the main rules of the Andrew’s Pitchfork.
- The upper channel line may provide a resistance level during an uptrend.
- The lower line may provide a support level during a downtrend.
- The handle of the Pitchfork tells about the strength of the trend. When the price goes above the median line, it suggests a strong uptrend. When the price tends to be below the median line, it suggests a strong downtrend.
How to trade with the Pitchfork?
Traders may either trade within the channel or they may also isolate breakouts to the upside or downside of the channel. Traders may follow the following trading strategies to make profitable use of them Pitchfork.
- Entering a long position is a prudent strategy once the price touches the bottom trendline of the Andrew’s Pitchfork indicator.
- Entering a short position is advisable once the price reaches the upper trendline.
- Trading breakouts and breakdowns are also a profitable strategy when traders use Andrew’s Pitchfork for trading. Traders should look for trading breakouts above the upper trendline and breakdowns below the lower trendline.

 Good Trading requires the Best Charting Tool!

 We loved Marwood Research’s course “Candlestick Analysis For Professional Traders“. Do you want to follow a great video course and deep dive into 26 candlestick patterns (and compare their success rates)? Then make sure to check this course!