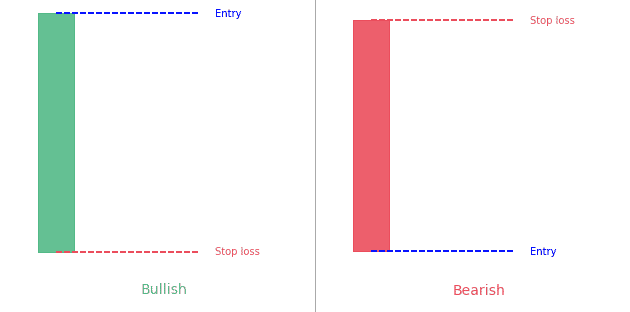
Key takeaways A marubozu candle only has a body. It doesn't have wick or tail.Bullish marubozu is a long green body candleBearish marubozu is a long red body candle Statistics to prove if the Marubozu pattern really works What is...
Technical analysis is a systematic way of analyzing and studying financial markets to make informed trading decisions. Technical analysis has been in practice for centuries, however, it has become extremely popular in the 21st century. Nowadays, data science and tools have become more advanced. Today, it is the age of the internet and more people have access to data and advanced tools to make informed trading decisions.
Technical analysis includes researching stock price charts and various indicators derived from (basic) prices in order to predict the development of the market.
Technical analysis or TA is the study of the past movements of financial markets and securities including price and volume. It works on the simple principle that history repeats itself. That means the financial markets have a tendency to move in repeated and consistent patterns. So, through study and analysis of the past price and volume movements, those patterns are identified and their future movements are predicted. This information is extremely useful that enables investors to make informed decisions.
Technical analysis is one of the two major analytical techniques to analyze financial markets. The second one is fundamental analysis. Fundamental analysis focuses on figuring out the true value of stocks. On the other hand, technical analysis focuses on identifying patterns on a chart to predict future price movements.
This graphic extrapolation method is applicable to all types of markets: indices, stocks, interest rates, commodities…, so it is not limited to the stock market (stock market); once the supply and demand meeting determines the price, the same tools and methods are possible to apply to any type of underlying asset.
The main tool of the technical analyst is graphics, which can visualize and analyze the underlying assets.
The biggest helping tool in technical analysis charts. Technical analysts are so much engrossed in charts that they are branded as chartists. They rely on charts because charts are the easiest and most convenient source to visualize past price and volume data. Technical analysts analyze charts to find patterns and trends that eventually help them in spotting some profitable trading opportunities.
The best way to chart your technical analysis is using the TradingView solution. It lets you chart all the patterns and indicators you’d like on every chart type. You can try it now for free!
The technical analysis presents a totally different picture of a company and demands a focus on price data and movements. You need to observe market trends and patterns to predict the market’s future movements. You may use the following technical indicators to conduct technical analysis.
There are two main types of technical analysis.
The accepted purpose and reason for existence of technical analysis is to predict trends and signs of trend reversal. This is a question of determining market conditions (significant numbers and/or signals given by mathematical tools) that statistically produce the same results.
Technical analysis does not pretend to be an accurate science. It is closer to human science, because its research object is directly focused on the understanding of market psychology.
There are the following three basic principles of technical analysis.
Technical analysis was first used by the Japanese around the 17th century for the rice market. They introduced a specific way to draw the price: the Japanese candlesticks. It helped them aggregate the price for a given period.
Technical analysis focuses on the following basic factors.
Technical charting theories build on a few main assumptions. It partly explains why it is also a very controversial topic.
Technical analysis works on the same basis across all the tradable instruments. It works with the purpose of forecasting future price movements including stocks, futures, bonds, and forex instruments. There are various patterns and signals that help analysts during technical analysis. Moreover, analysts have also developed various trading systems that help in forecasting and trading on price movements. Technical analysis works on the basis of such tools and trading systems. Trendlines, channels, moving averages, and momentum indicators are among the most widely used indicators and charting patterns.
Identification of the signals for price trends in a market is the basic and very important component of any trading strategy. Technical analysis is the best option in this regard. It helps traders to find the best entry or exit points. However, it is also very important to note that market behavior is not 100% accurately predictable. Although technical analysis gives us an insight into the likely price movement of a stock or security, it doesn’t promise success. Moreover, technical analysis alone doesn’t guarantee success. Always remember that successful trading also relies on proper risk management, discipline, and your ability to keep your emotions under control.
You’ll find below all the articles for each single technical analysis patterns, indicators and concepts. We sincerely hope it’ll help you succeed!

Key takeaways A marubozu candle only has a body. It doesn't have wick or tail.Bullish marubozu is a long green body candleBearish marubozu is a long red body candle Statistics to prove if the Marubozu pattern really works What is...
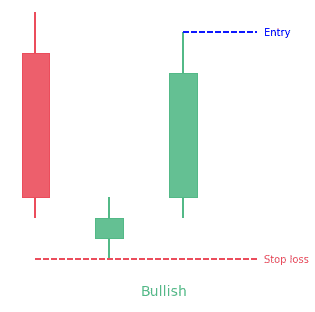
Key takeaways A morning star pattern is a bullish 3-bar reversal candlestick patternIt starts with a tall red candle, then a small candle and finishes with a tall green candleThe middle candle reports indecision in the marketThe opposite pattern is the evening star...
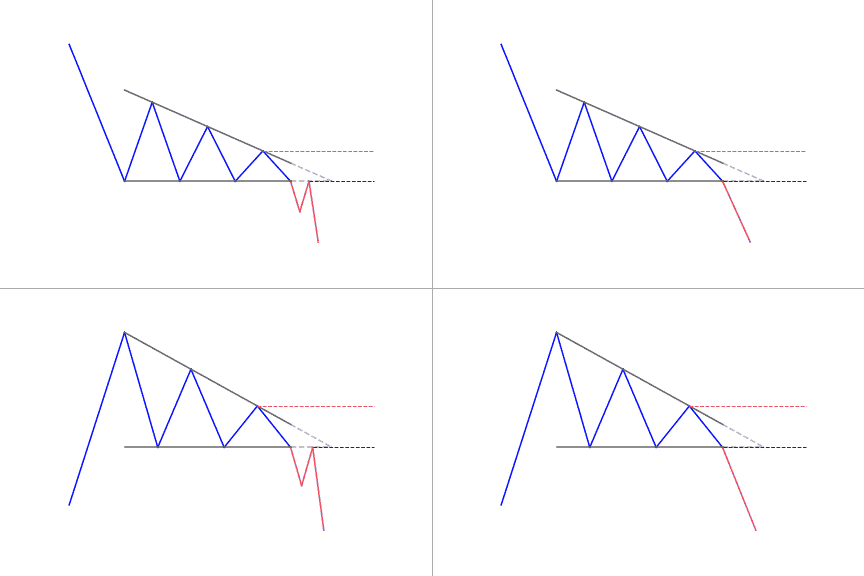
A descending triangle forms with an horizontal resistance and a descending trendline from the swing highsTraders can use the descending triangle pattern as a signal to enter a short position at breakdownThe opposite technical pattern is the ascending triangle What is...
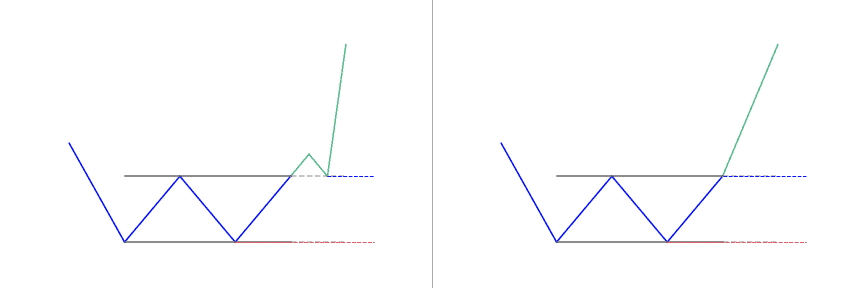
The double bottom looks like the letter "W"Price touches twice a support levelThe double bottom pattern follows a downtrendIt signals the reversal and the beginning of a potential uptrend What is a Double Bottom classical pattern? A double bottom pattern is a classic...
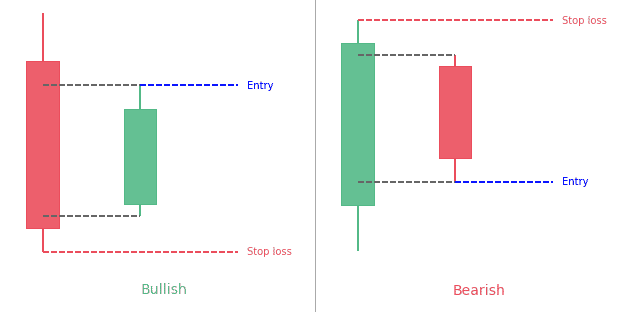
The Harami pattern is a 2-bar reversal candlestick patternThe 2nd bar is contained within the 1st one Statistics to prove if the Harami pattern really works What is the Harami candlestick pattern? Even though the word Harami appears...
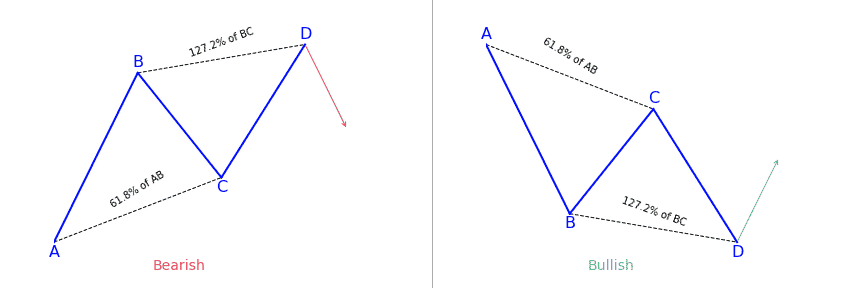
The AB=CD harmonic is reversal patternDepending on the context, it can be bullish or bearishIt should follow specific fibonnaci ratios : BC is the 61.8 percent Fibonacci retracement of ABCD is the 127.2 percent Fibonacci extension of BC Interested in learning more...
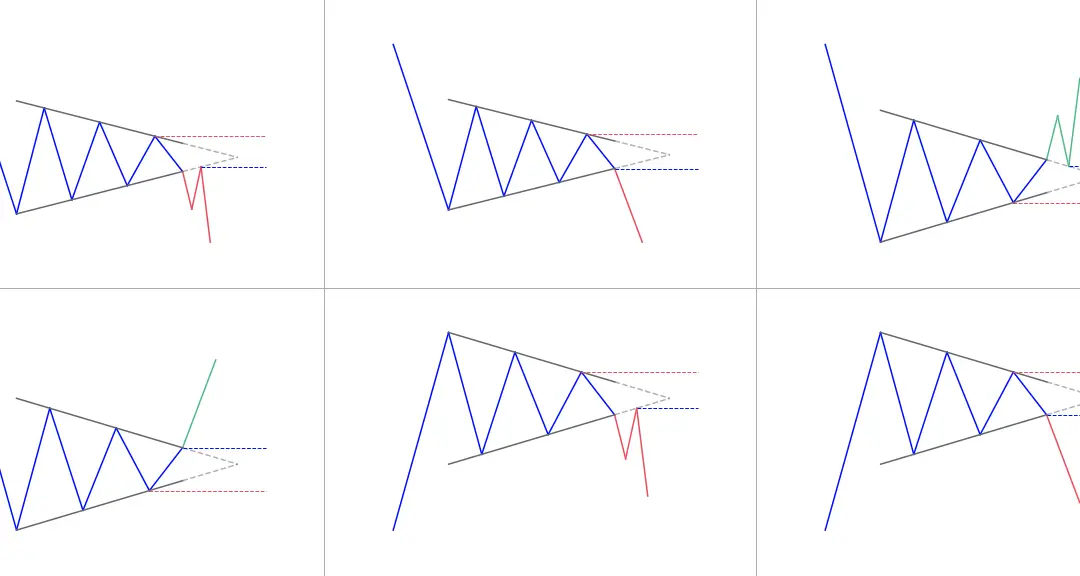
A symmetrical triangles forms when the price of a security consolidates between two trend lines with similar slopesIt can break in both directions, up or downThe symmetrical triangle helps frame your entry, stop and target What is the Symmetrical Triangle pattern?...
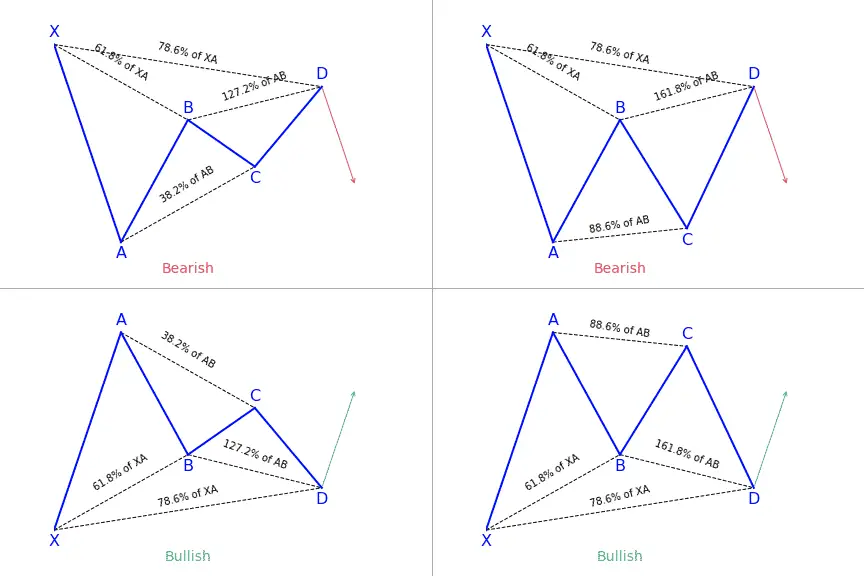
The Gartley pattern is a 4-legged harmonic patternIt can be bullish or bearish It follows clear fibonacci levels (see the Gartley ratios paragraph for detail) Interested in learning more about harmonics pattern in general?You'll love this two courses I shortlisted for...
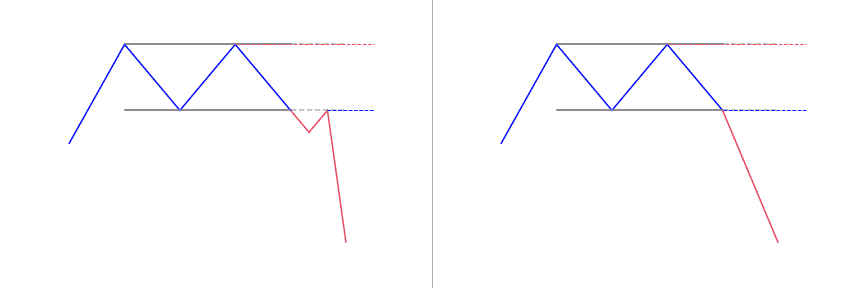
The double top looks like the letter "M"Price touches twice a resistance levelThe double top pattern follows an uptrendIt signals the reversal and the beginning of a potential downtrend What is the Double Top pattern? A double top is a very bearish technical reversal...
![Ascending Triangle Pattern: Full Guide [2022]](https://patternswizard.com/wp-content/uploads/2020/05/ascendingtriangle.png)
The ascending triangle pattern is a continuation pattern. Price typically breakout in the direction of the prevailing trend.It forms between a horizontal resistance and an upward slope trendlineIt helps traders frame their trade, giving an entry, stop and target If...
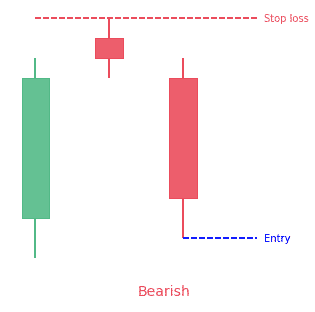
An evening star pattern is a bearish 3-bar reversal candlestick patternIt starts with a tall green candle, then a small candle and finishes with a tall red candleThe middle candle reports indecision in the marketThe opposite pattern is the morning star pattern...
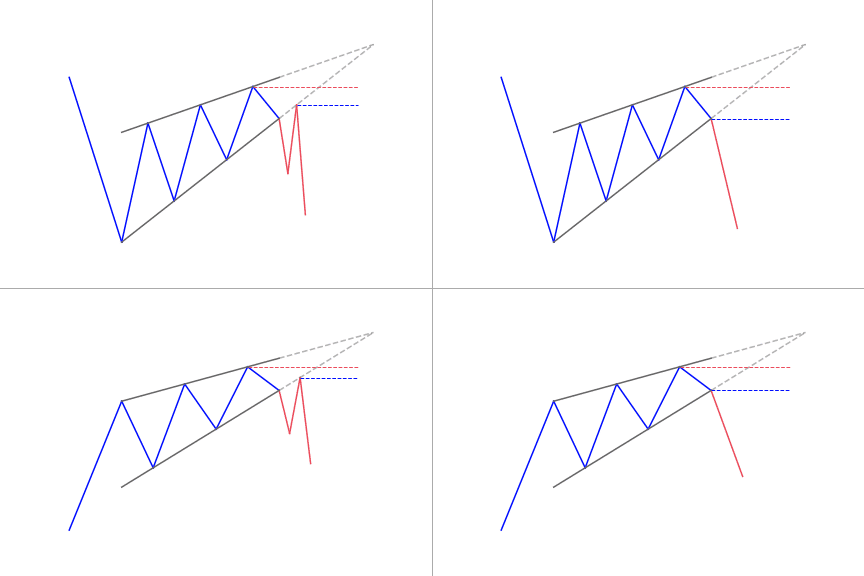
A rising wedge forms when two converging upward slope trendlines encapsulate the priceIt is a bearish pattern What is a Rising Wedge? Rising wedge is a popular reversal pattern that can easily be predicted in nature. It offers clues to traders on the direction and...
![Dark Cloud Cover Candlestick Pattern: The Ultimate Guide [2022]](https://patternswizard.com/wp-content/uploads/2020/05/darkcloudcover-bearish.png)
The dark cloud cover is a 2-bar bearish reversal candlestick patternIt starts with a green candle The second candle opens above the first one (gap) but then closes below the midpoint of the prior bullish candleBoth candles show be quite large Statistics to prove if...
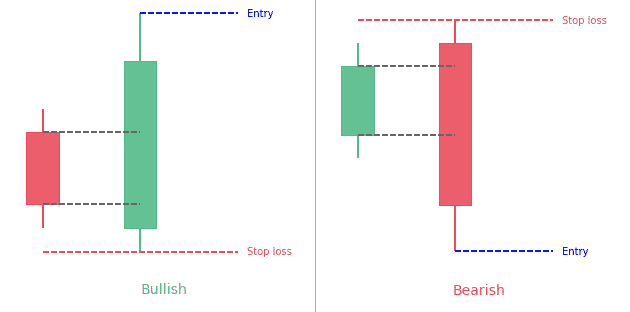
An engulfing pattern is a 2-bar reversal candlestick patternThe first candle is contained with the 2nd candleA bullish engulfing pattern has a red candle engulfed within a green candleA bearish engulfing pattern has a green candle engulfed within a red candle...
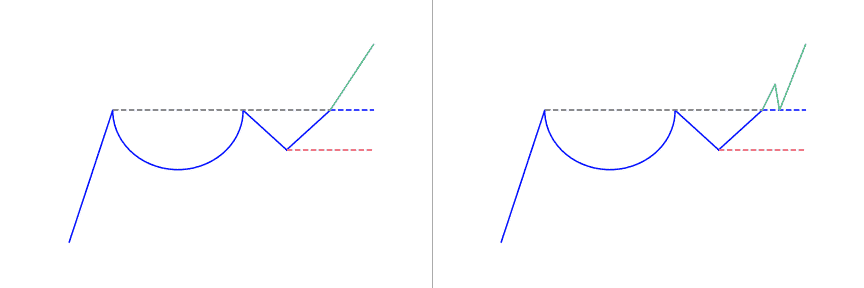
Chart patterns usually occur when the cost of an asset goes towards a direction that a common shape, like a rectangle, triangle, head and shoulders, or in this case, a cup and handle pattern. These patterns are great ways to trade visually. They offer a logical point...
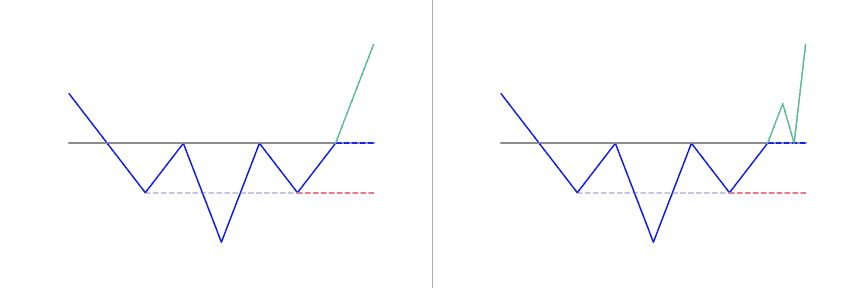
Traders apply charts when studying various patterns in market trends, including the inverse head and shoulders pattern. This pattern is characterized by three troughs (both the upward head and shoulders have peaks), with the middle trough being the deepest. An inverse...
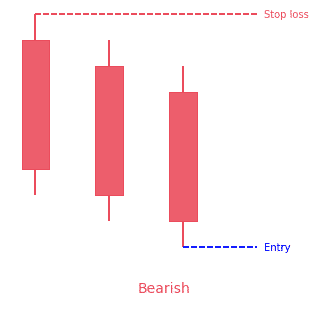
The three black crows is a 3-bar bearish reversal patternThe pattern consists of 3 bearish candles opening above the previous one and closing below the midpoint of the previous candleEach candle should be relatively large to show the strong participation Statistics to...
![Falling Wedge Pattern: Ultimate Guide [2022]](https://patternswizard.com/wp-content/uploads/2020/05/fallingwedge.png)
Out of all the chart patterns that exist in a bullish market, the falling wedge is an important pattern for new traders. It is a very extreme bullish pattern for all instruments in any market in any trend. Depending on the educator and educational material you’ve read...
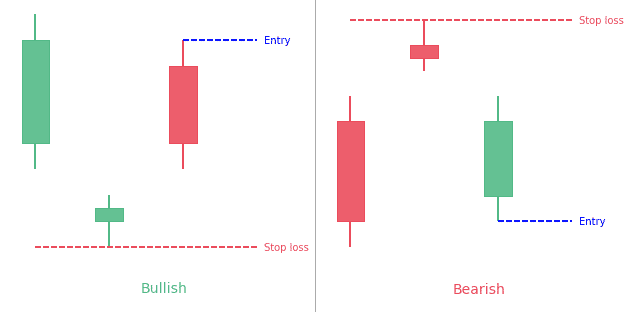
The abandoned baby pattern is a 3-bar reversal pattern.The bullish abandoned baby follows a downtrend. It has a big red candle, a gapped down doji and then a big green gapped up candle.The bearish abandoned baby follows an uptrend. It has a big green candle, a gapped...
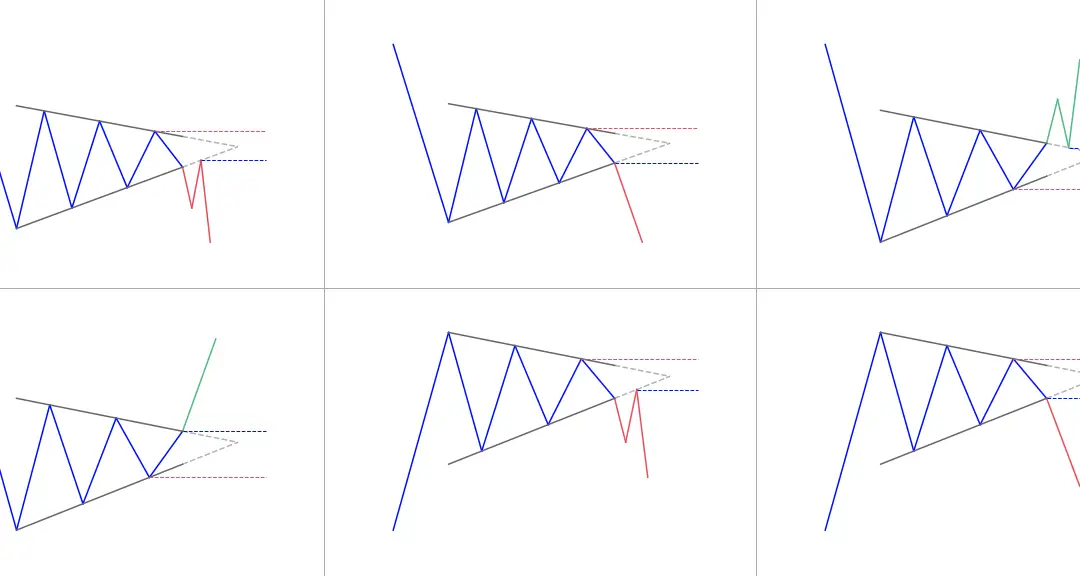
The pennant pattern is a continuation pattern.The pennant shows a time of consolidation before to (likely) continue of the same trend with a breakout.The consolidation period should have lower volume and the breakouts should occur on higher volume. What is the Pennant...
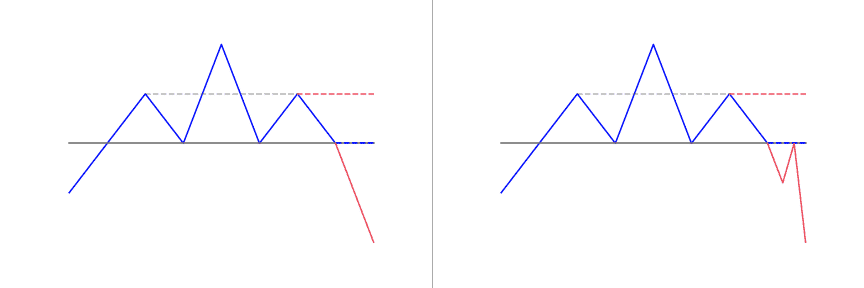
Recognizing chart patterns is one of the most reliable techniques for trading the market. There are various chart formations that traders can observe and apply to their arsenal. Today, we will go through one of the most dependable chart patterns: the head and...
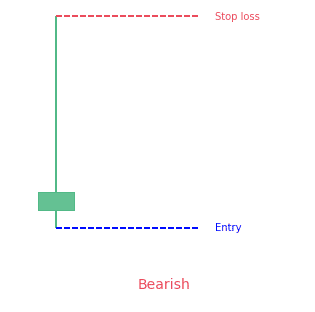
The shooting star is a 1-bar bearish reversal candlestick patternThis formation is bearish because the price tried to rise sharply throughout the day, but then the seller took over and pushed the price down to the opening price Statistics to prove if the Shooting Star...
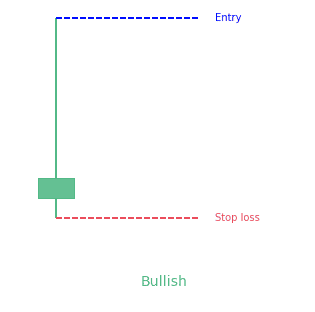
The inverted hammer is a 1-bar bullish candlestick pattern.It looks like a letter "T" upside-down. Statistics to prove if the Inverted Hammer pattern really works What is the Inverted Hammer candlestick pattern? As far as the...
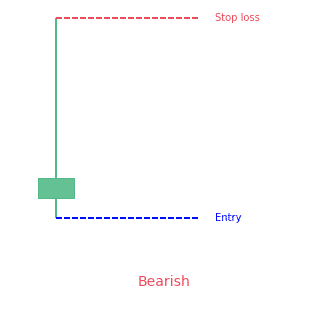
The Gravestone Doji Candlestick Pattern is one of the fabulous and versatile patterns in trading. It an interesting bearish trend reversal candlestick pattern. Some traders, use this pattern in their daily lives to learn about the feel of the market. The article is...
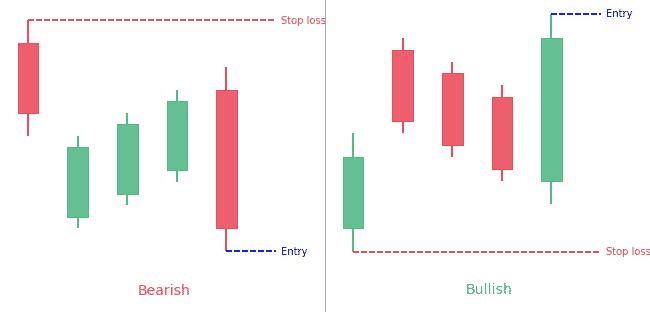
The Mat Hold candlestick pattern is a 5-candle patternIt can be bullish or bearish depending on its formationFor the bullish pattern, there is a tall green candle, 3 small red candles and the last candle is a tall green candle closing above the patternFor the bearish...
![Crab & Deep Crab Harmonic Pattern: The ultimate guide [2022]](https://patternswizard.com/wp-content/uploads/2020/06/crab.png)
Harmonic trading is a kind of technical analysis generally used across futures, stocks and forex. Harmonic trading makes use of particular price patterns which are subject to alignment of specific Fibonacci extension and retracement levels. As a result of the...
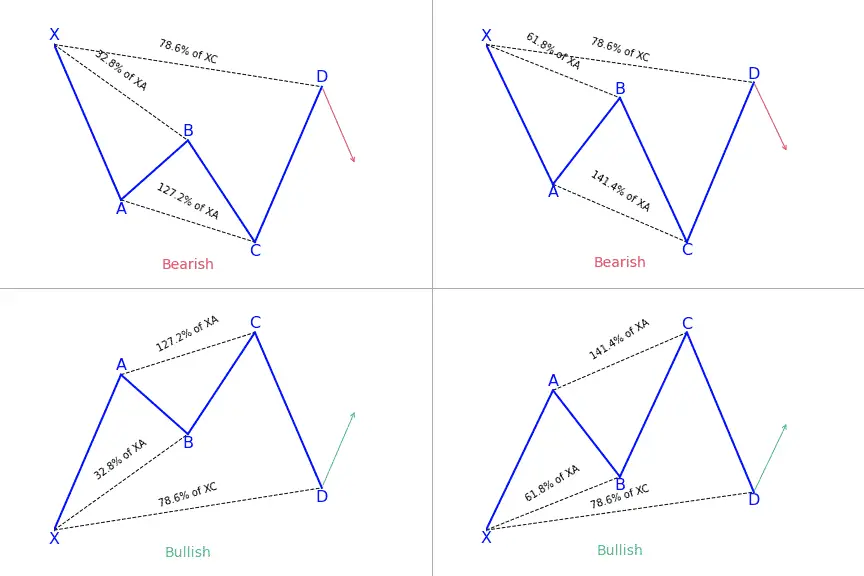
The cypher pattern trading strategy teaches traders how to correctly trade and draw the cypher pattern. The cypher harmonic pattern can be used on its own and provide traders a profitable forex trading strategy. It is not surprising that geometric patterns are used in...
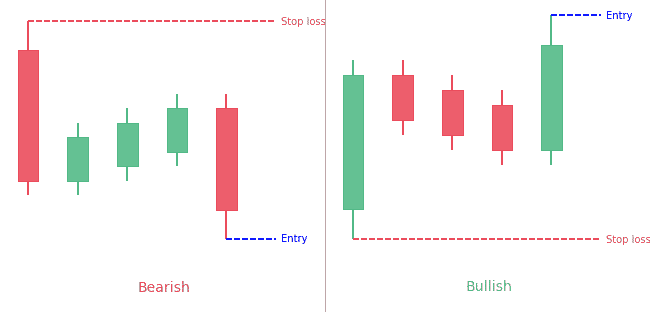
Candlestick patterns have become the preferred method of charting for a lot of traders. Their colorful bodies make it simple to spot market action and patterns that could hold predictive value; they also form patterns that have various meanings. One pattern is the...
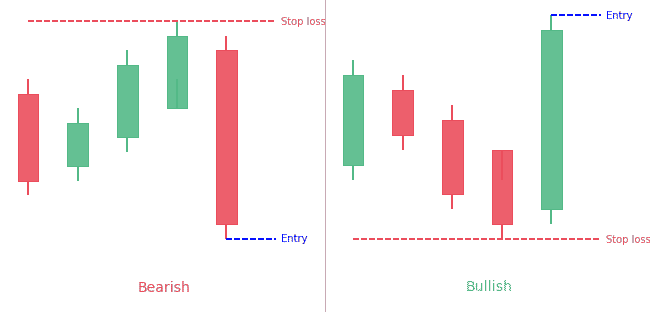
Trading price action usually brings about surprise and excitement at the same time. Price is commonly used as a base for any technical analysis, and the hikkake trading strategy takes in consideration three price action bars to identify the pattern. The pattern looks...
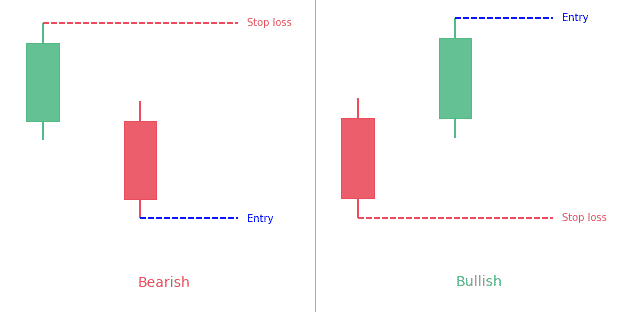
Traders have applied candlestick patterns in analyzing the movement of a market. One of such patterns is the separating lines candlestick pattern. The pattern comes up when there's an uptrend in the market and when there's also a pullback. The separating lines...
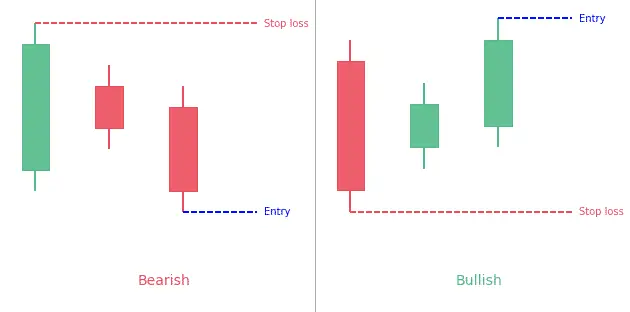
To interpret candlestick patterns, you need to look for particular formations. These candlestick formations assist traders know how the price is likely to behave next. In this article, we will go in-depth into the Three Inside Up / Down candlestick pattern. Some...
![Three-Line Strike Pattern: Complete Guide [2022]](https://patternswizard.com/wp-content/uploads/2020/06/threelinestike.png)
Recognizing patterns is a necessary aspect of technical analysis. Traders should make sure that if they have a moment of doubt, they can act on a situation if they have seen it before. In this article, we will cover in-depth the Three Line Strike candlestick pattern....
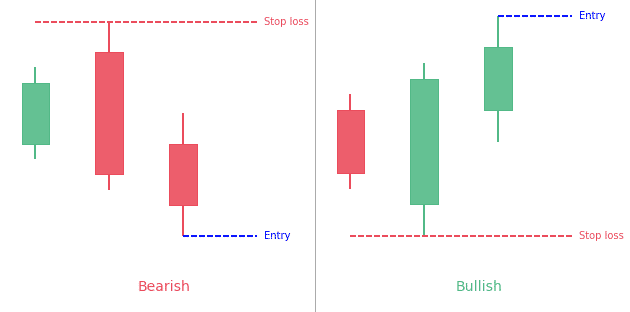
The Three Outside Up & Down candlestick patterns are 3-bar opposite reversal patterns.They are made of one up or down candle and then 2 candles of the opposite color.The second candle contains the first one.The third candle closes over (for the bullish formation)...
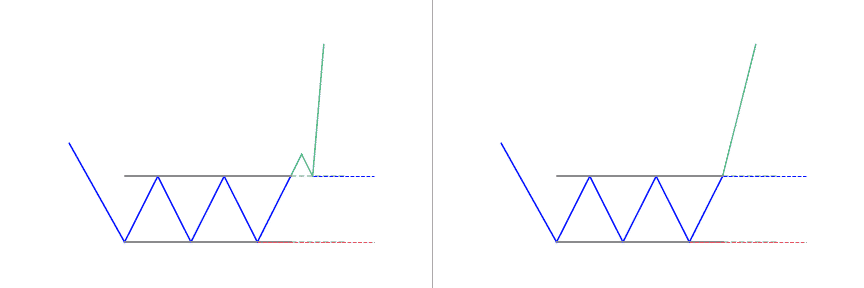
The triple bottom pattern is a bullish reversal pattern. It's created when price bounces off support 3 time at similar levels.It's a sign the buyers are coming in the market to avoid the security price to drop lower. What is the Triple Bottom pattern? The Triple...
The dragonfly doji candlestick pattern is a 1-candle bullish pattern.It looks like the letter "T".It prints when the candle as a long bottom shadow but (almost) no upper shadow and open and close are almost the same. Statistics to prove if the Dragonfly Doji pattern...
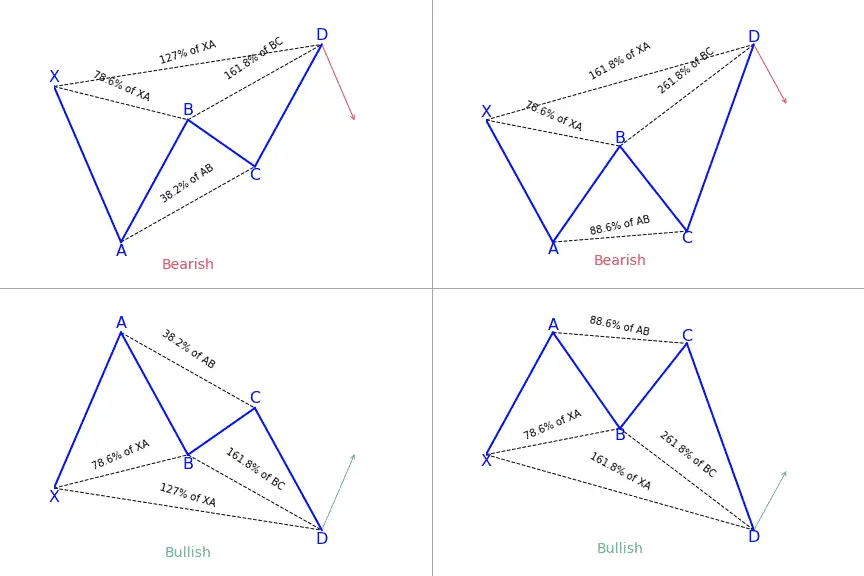
When you decide to trade, the secret to becoming successful is in reading patterns. Harmonic price patterns take geometric price patterns to the next level by applying Fibonacci numbers to define specific turning points. Unlike other more trading processes, this...
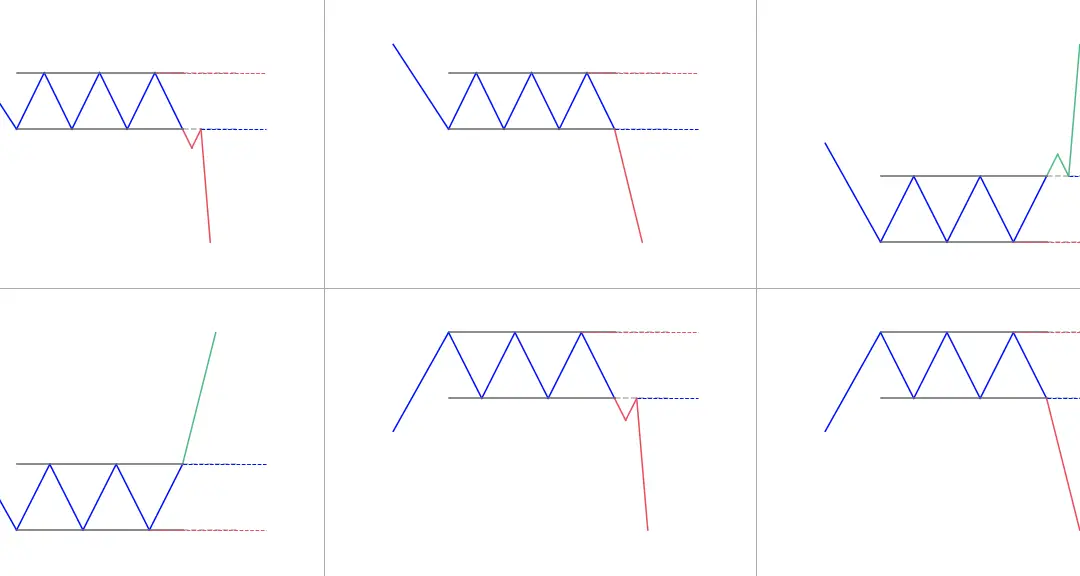
The Rectangle pattern is bullish or bearish depending on the direction of the breakoutIt forms when price oscillates between a horizontal support and resistance. What is the Rectangle pattern? The rectangle formation is a classical technical analysis pattern shown by...
![Shark Harmonic Pattern: Full Guide [2022]](https://patternswizard.com/wp-content/uploads/2020/06/shark.png)
When it comes to harmonics, trading forex is very similar to the animal world. After crabs and butterflies, sharks have come to share their name with popular five-point patterns used in trading. A very new pattern, the shark harmonic pattern, was discovered by Scott...
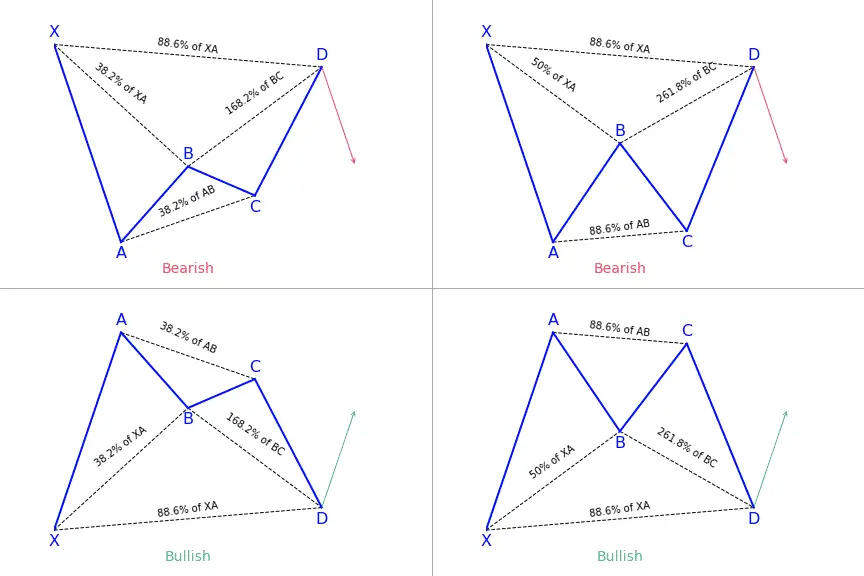
The Bat harmonic pattern is close to the Gartley pattern. It is a retracement and continuation pattern that comes up when a trend temporarily changes its direction but then continues on its original course. The Bat harmonic pattern is a reversal pattern.It follows...
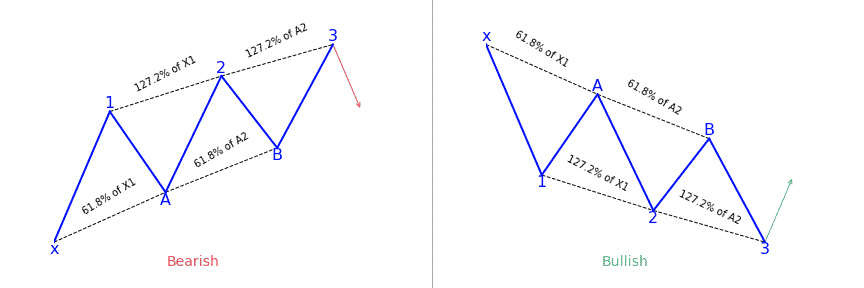
Trading with technical analysis demands traders to depend mostly on a mixture of technical indicators and trade based on the signals from this approach. Apart from using technical indicators, traders also utilize chart patterns to base their trading decisions, whether...
![Key Reversal Bar Pattern: Complete guide [2022]](https://patternswizard.com/wp-content/uploads/2020/06/keyreversalbar.png)
Most times, traders take a 'ready, fire, aim' process to trade which is a backward way of trading. Trade is different from a trade trigger. A trade setup that most traders are always on the lookout for is a key reversal bar pattern combination. It forms when prices...
![5-0 Harmonic Pattern: Complete guide [2022]](https://patternswizard.com/wp-content/uploads/2020/06/5-0.png)
The 5-0 pattern is a reversal harmonic pattern.It follows specific fibonacci ratios (which you can read more below) Interested in learning more about harmonics pattern in general and you prefer videos to text?You'll love this two courses I shortlisted for you on...
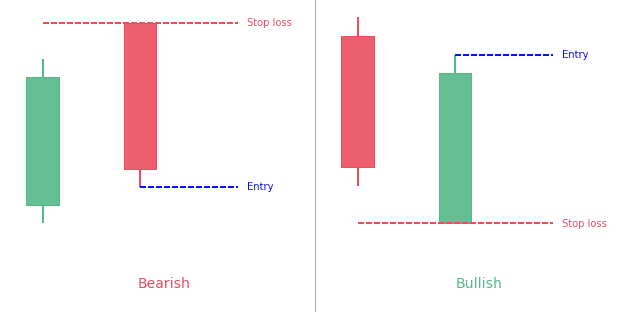
All patterns have a unique tale to tell about market forces that lead to its formation. And traders might benefit by trying to identify what drove the market to where it is now. Knowing exactly why a market carried out a particular move is almost impossible. Having...
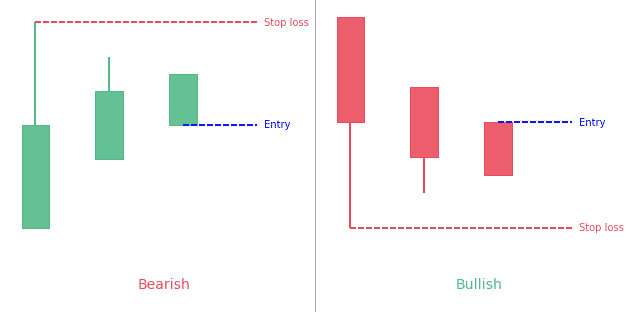
The Three Stars in the South candlestick pattern is a very rare pattern that doesn't typically precede large price moves.The bullish pattern forms with three black or red (down) candles of decreasing size. It usually follows a price decline.The bearish pattern forms...
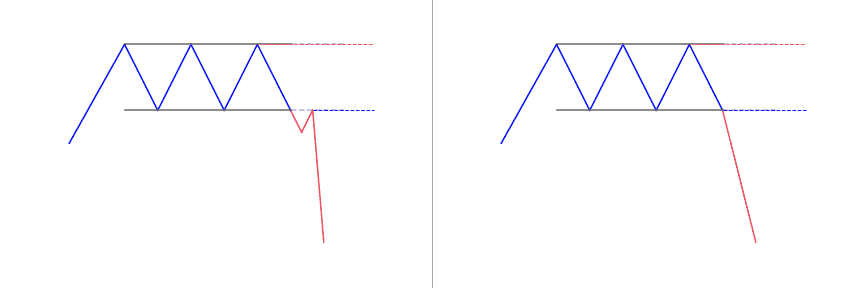
The triple top pattern is a bearish reversal pattern.It's created when price bounces off resistance 3 time at similar levels.It's a sign the sellers are coming in the market to avoid the security price to shoot higher. What is a Triple Top pattern? Triple top is a...
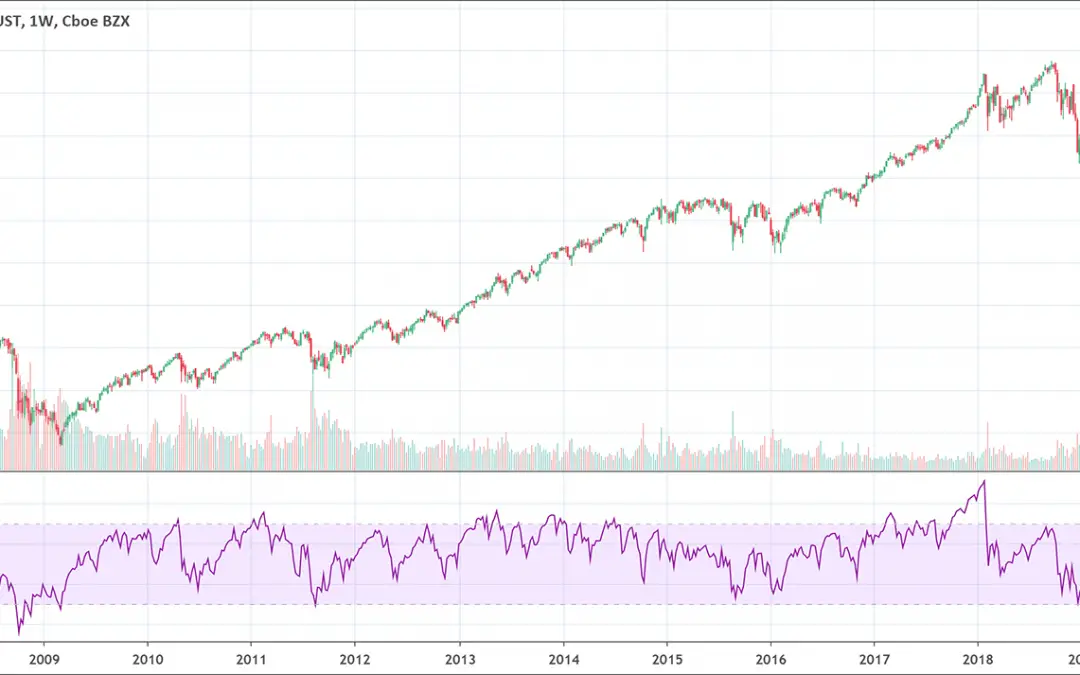
The RSI (Relative Strength Index) indicator is a popular momentum oscillator.It provides traders with bullish and bearish price momentum signal.When the RSI is above 70%, it's considered overbought; when it's below 30%, it's considered oversold. What is the Relative...
![Stochastic Oscillator: Full Trading Guide [2022]](https://patternswizard.com/wp-content/uploads/2020/06/Stochastic-1080x675.png)
The stochastic oscillator is a popular momentum technical indicator.It gives traders overbought and oversold signals. What is the Stochastic indicator? The Stochastic Oscillator is a momentum indicator A stochastic oscillator is a momentum indicator that compares a...
![MACD Indicator: The Ultimate Guide [2022]](https://patternswizard.com/wp-content/uploads/2020/06/MACD-1080x675.png)
The Moving Average Convergence Divergence (MACD) is both a momentum and trend following indicator.It is calculated by subtracting the 26-period EMA (Exponential Moving Average) from the 12-period EMA.There are several ways to read it:When the lines crossWhen the...
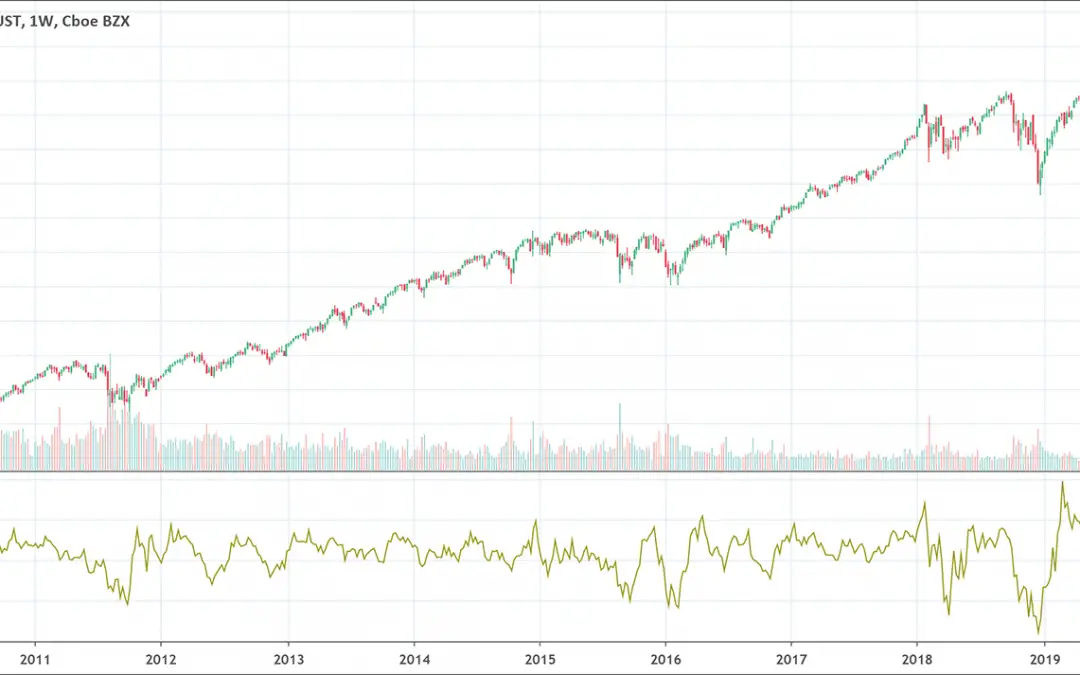
Traders use momentum indicators to have a better understanding of the speed or rate at which the price of a security changes. Momentum indicators are best used with other indicators and tools because they don’t work to detect the direction of movement, only the...
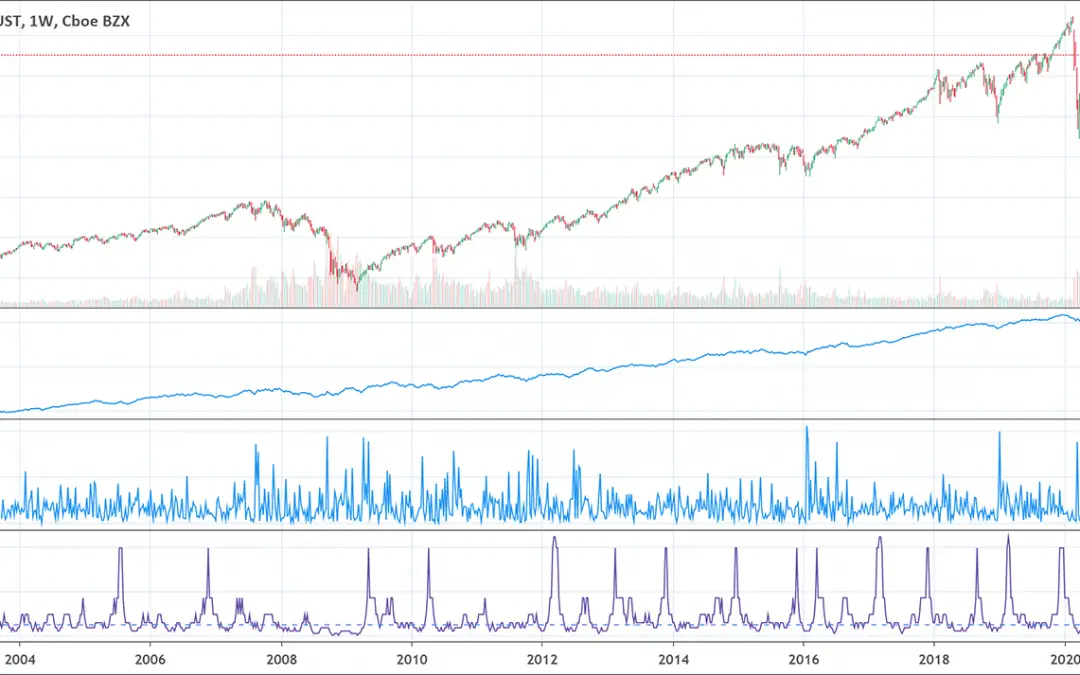
The accumulation distribution indicator (ADL) is a volume-measurement kind of indicator. It was created by a well-known trader and analyst, Marc Chaikin, as a stock selection tool. He has subsequently found broader application as a leading indicator for other markets,...
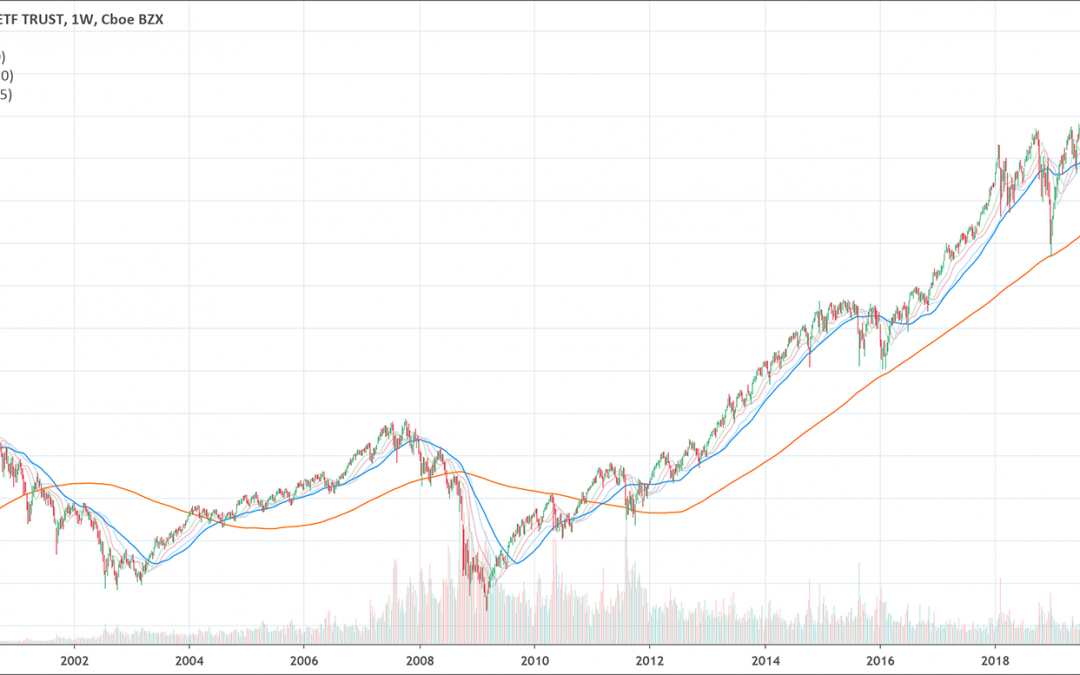
A SMA (Simple Moving Average) indicator calculates the average of prices for a given number of periods.The SMA is used alone (for its slope) or with others MAs (for the crossing). What is the Moving Average indicator? In technical analysis, the moving average is an...
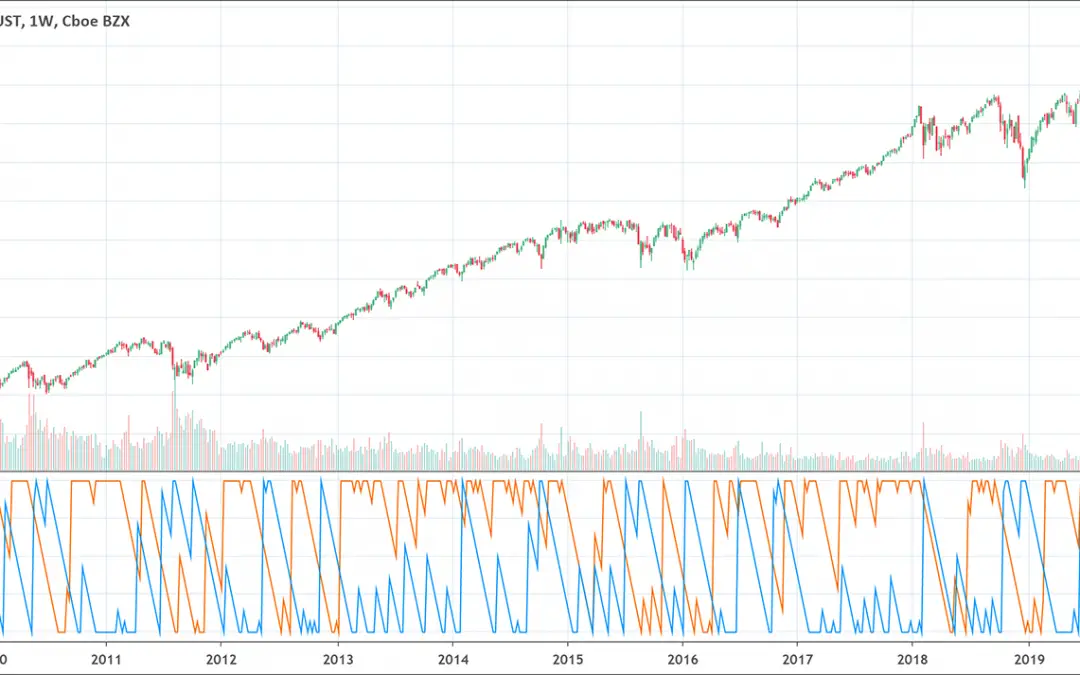
The Aroon indicator is composed of two line:An up line which measures how far is the previous highA down line wich measures how far is the previous lowWhen AroonUp is above AroonDown, it gives a bullish biais.When AroonUp is below AroonDown, it gives a bearish biais....
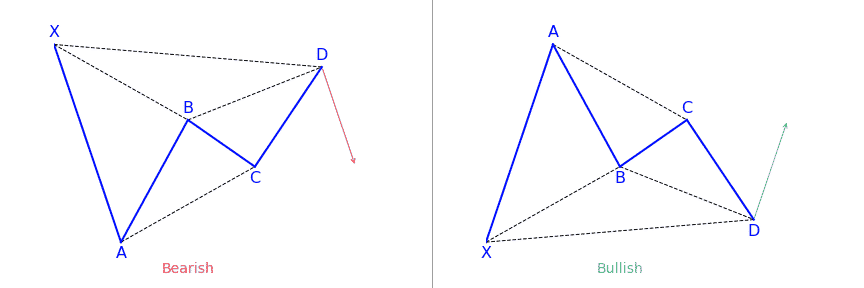
Chart patterns provide so many smart ways of applying harmonic patterns in your chart. Some of them are fully automated approaches and some of them are semi-automated approaches. One of them is using the XABCD harmonic chart pattern. The XABCD harmonic is a group of...
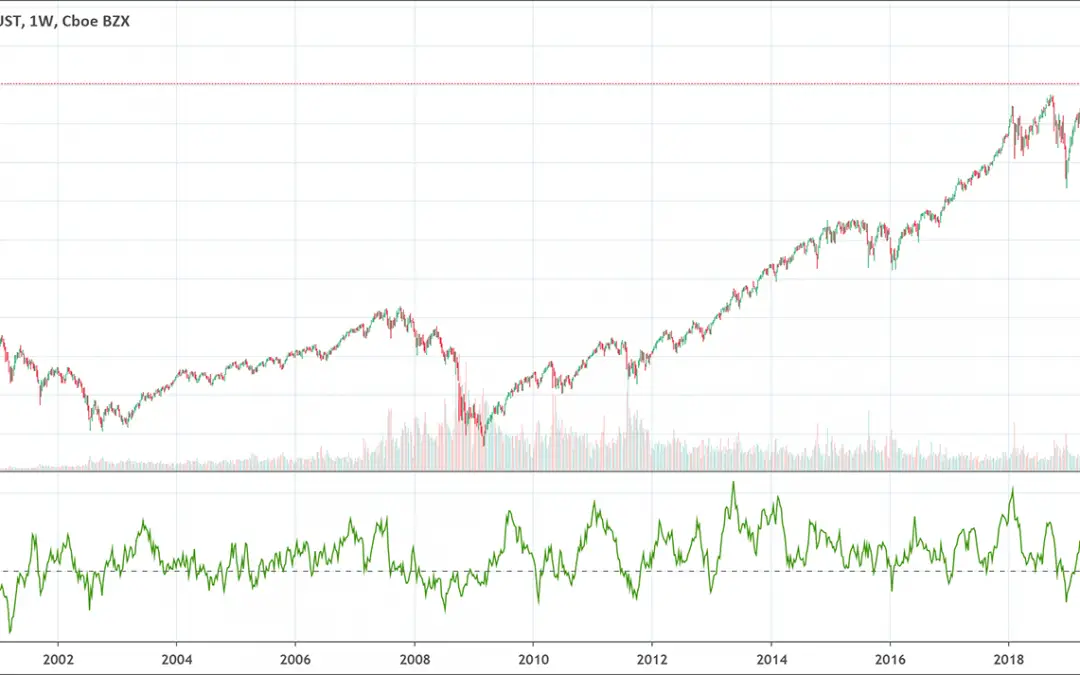
Created by Marc Chaikin, this Chaikin Money Flow indicator measures the amount of money flow volume over a particular time. Money flow volume is the basis for the accumulation/distribution Line. Rather than having a cumulative total, Chaikin money flow combines money...
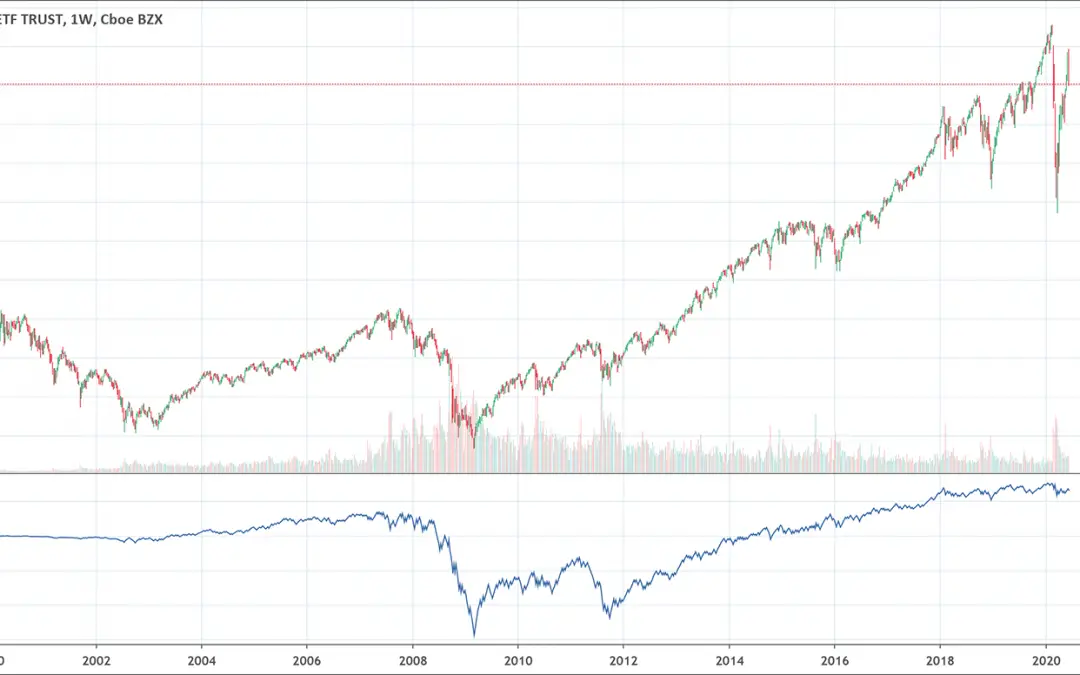
The OBV (On Balance Volume) technical indicator uses volume to indicate momentum.The OBV indicator shows crowd sentiment and help traders predict a bullish or bearish outcome.It's mainly useful when in divergence with price as it shows unexpected strength or...
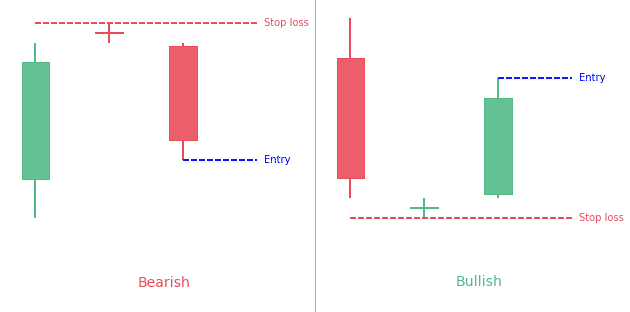
A Doji Star candlestick pattern is a three-bar pattern. It is considered as a signal of a potential upcoming reversal of the current trend of the market. It is a versatile candlestick pattern that is found in two variants, bullish and bearish. Its variants depend on...
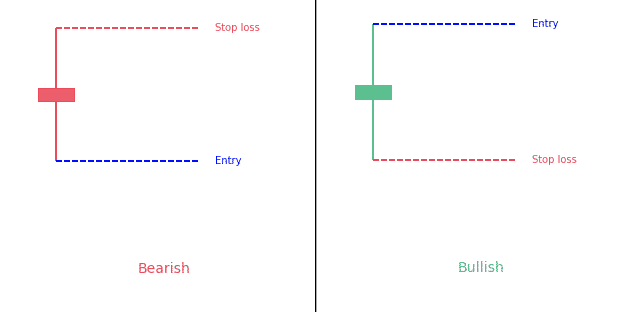
Candlestick patterns that have the same opening and closing price are known as "Doji candlestick pattern". There are four basic types of Doji candles: Four-Price DojiLong-legged DojiDragonfly Doji Gravestone Doji The Doji Candlestick is a 1-bar neutral...
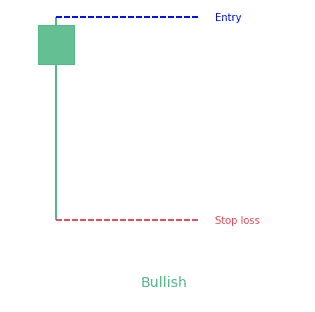
The Hammer candlestick pattern is a bullish reversal pattern that indicates a potential price reversal to the upside. It appears during the downtrend and signals that the bottom is near. After the appearance of the hammer, the prices start moving up. Hammer...
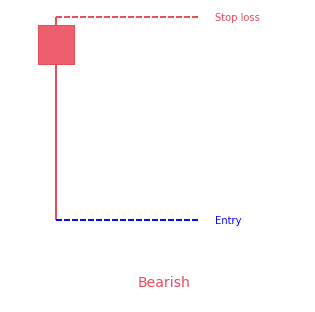
As the name suggests, the Hanging Man candlestick pattern is a bearish sign that appears in uptrends. On occasions, it also tells traders about the upcoming price reversal. The experts of the domain suggest that the Hanging Man pattern must be taken as a warning, not...
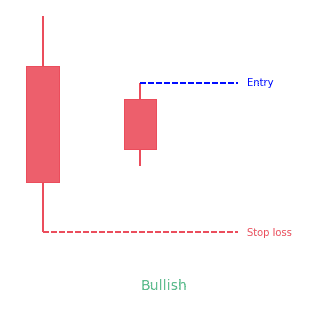
The Homing Pigeon candlestick pattern is a two-line candlestick pattern. Traditionally, traders consider it a bullish reversal candlestick pattern. However, testing has proved that it may also act as a bearish continuation pattern. This new development proves it to be...
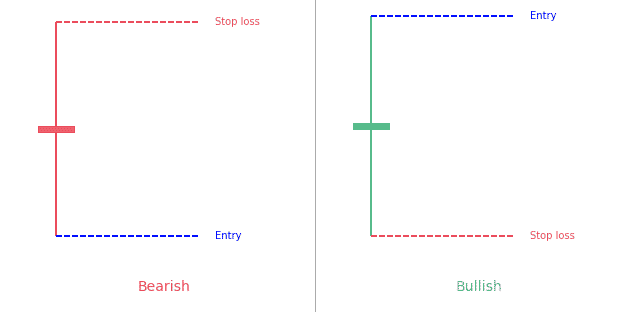
Candlestick patterns are becoming more and more popular these days for charting prices. They are easy to detect with their colorful bodies and black wicks and easy to observe the ways and the behavior of the market. One such popular candlestick pattern is the...
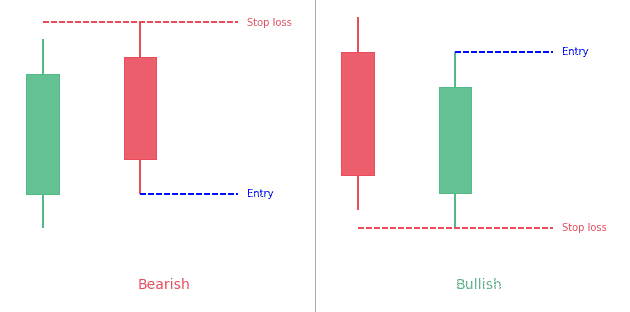
A Piercing line candlestick pattern is a two-day bullish candlestick reversal pattern that appears in a downtrend. It signals a potential short term reversal from downwards to upwards. It consists of two major components, a bullish candle of day 2 and a bearish candle...
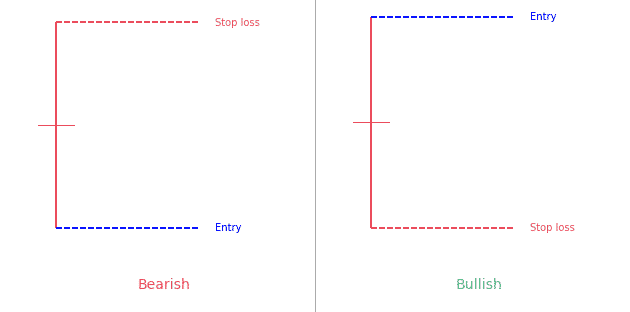
The Rickshaw Man candlestick pattern is very similar to the Long-Legged Doji pattern. A Long-Legged Doji pattern is the one that has a closing and opening price happening at or in the middle of the shadows. The high and low prices are far apart and make very long...
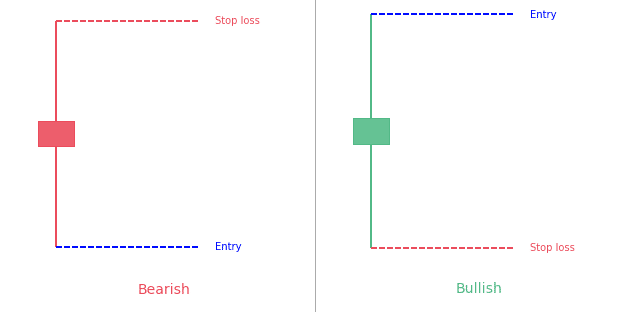
The Spinning Top candlestick pattern is a versatile single candle pattern. It is versatile and mysterious because of its formation that can occur at the peak of an uptrend, in the very middle of a trend, or at the bottom of a downtrend. It is a small candlestick...
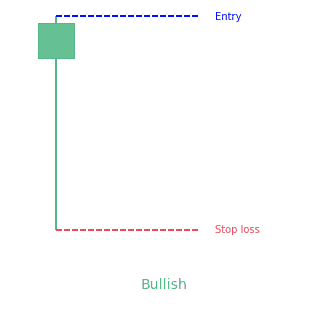
The Takuri candlestick pattern is a single candle bullish reversal pattern. It has a very small body with a much longer lower wick and without an upper wick. This pattern illustrates how a downtrend is opposed by the bulls and the candle eventually closes near its...
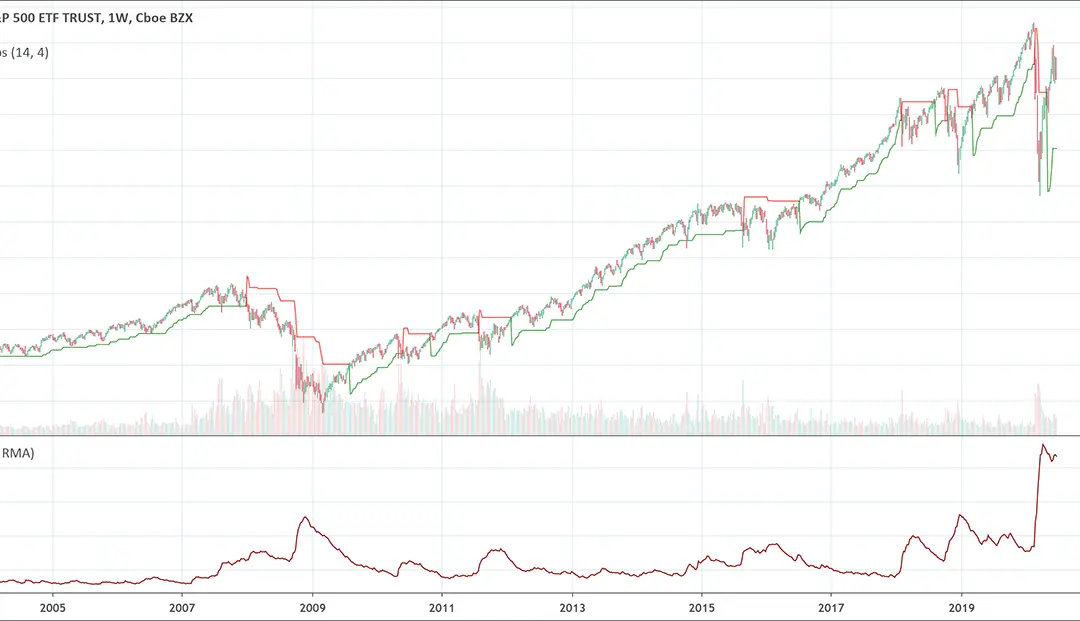
Average True Range (ATR) indicator is one of the most influential technical analysis tools that track volatility in a predefined period of time. Unlike most of the indicators, ATR does not identify trends and only focuses on measuring volatility in a particular...
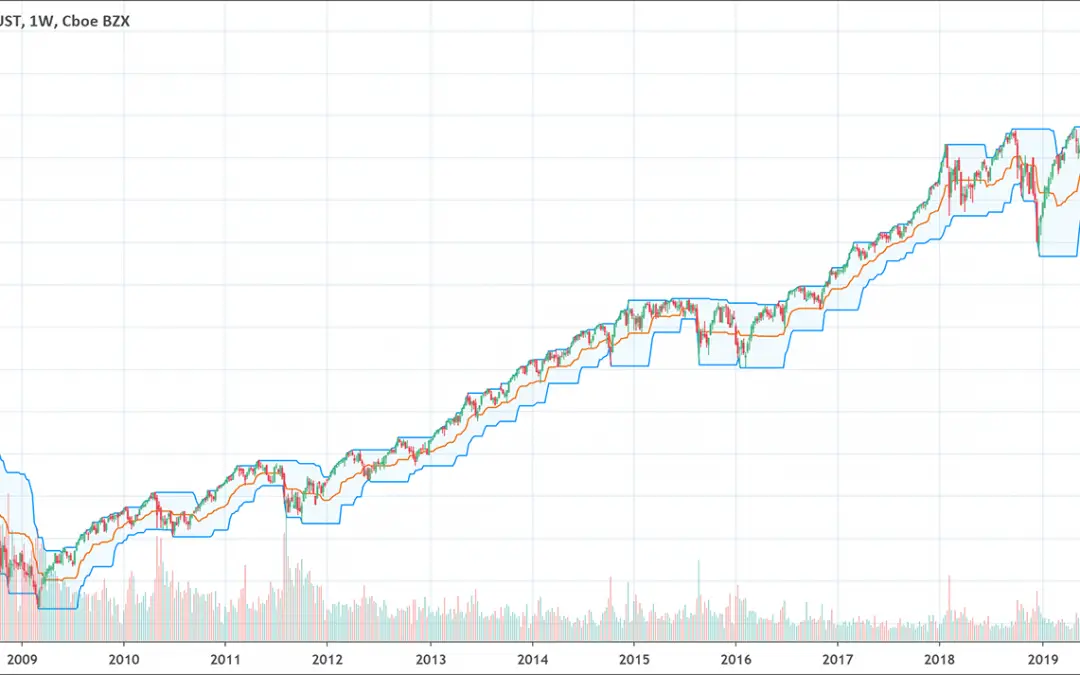
The Donchian Channel indicator is an intraday trend following indicator that allows you to identify trends. As we all know that trade breakouts is a popular trend following strategy. Breakouts can be conveniently measured through the lowest low and highest high. It...
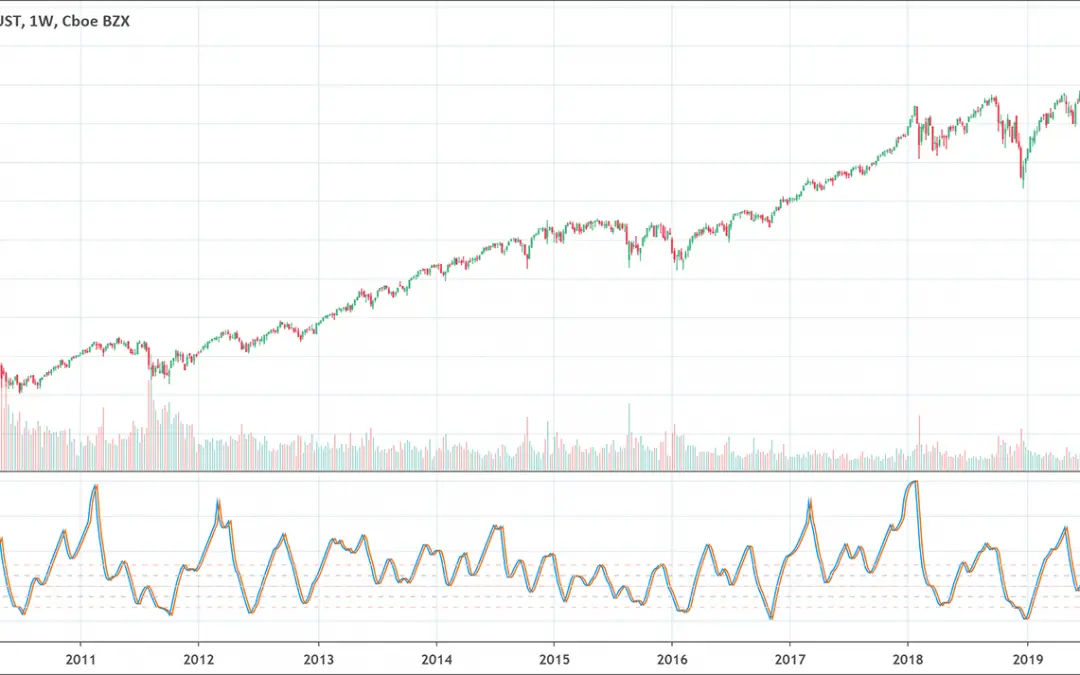
The Fisher Transform indicator is an oscillator that helps traders to satisfactorily identify significant trend reversal. It identifies trend reversals through normalization of prices over a predefined number of periods by the users. It also helps to visualize the...
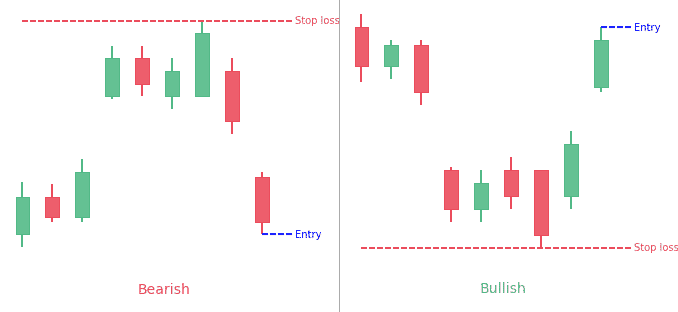
An Island Reversal Pattern appears when two different gaps create an isolated cluster of price.It usually gives traders a reversal biais. What is the Island Reversal candlestick pattern? The Island Reversal candlestick pattern is a fantastic candlestick pattern that...
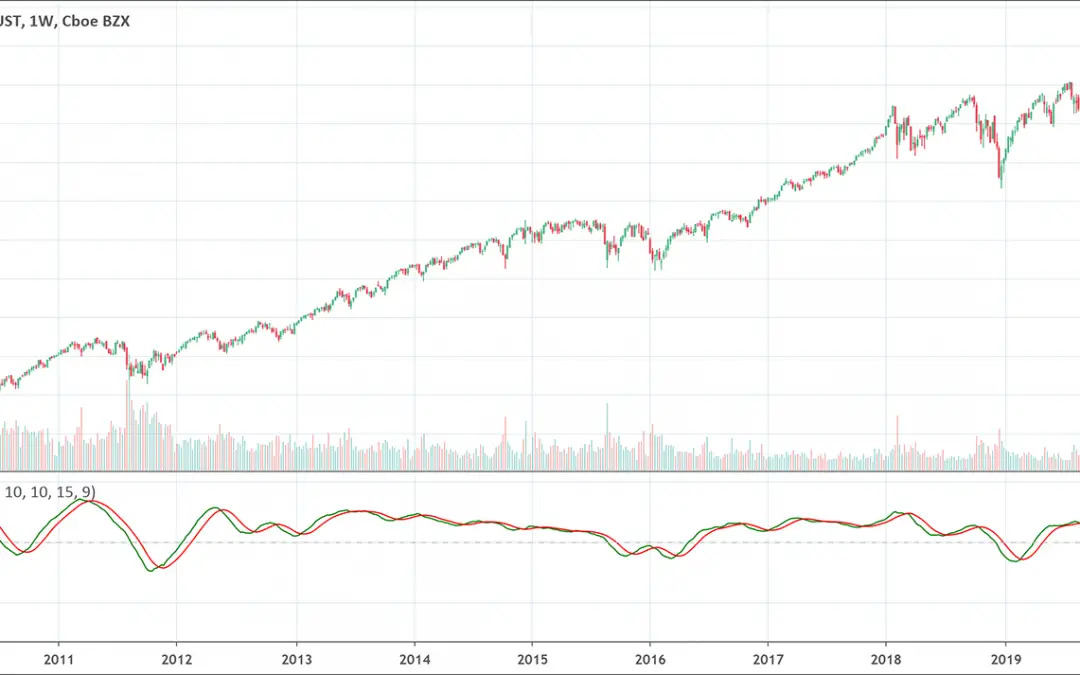
The Know Sure Thing indicator, or KST, is a momentum oscillator.It takes into account four time periods (and not a single one as other indicators).It gives traders a bullish or bearish biais. The Know Sure Thing (KST) indicator that gives bullish and bearish...
![McGinley Dynamic Indicator: Full Guide [2022]](https://patternswizard.com/wp-content/uploads/2020/07/mcginleydynamic-1080x675.png)
The Mcginley Dynamic indicator is an indicator that is based on moving average line indicator with a soothing mechanism. Its soothing mechanism is so effective that it tracks prices far better than any other indicator. There is an inherent problem in all moving...
![Rate of Change Indicator: Complete Guide [2022]](https://patternswizard.com/wp-content/uploads/2020/07/rateofchange-1080x675.png)
The Rate of Change (RoC) indicator is an unbounded momentum oscillator.Three main states are possible:A rising RoC above zero typically confirms an uptrend A falling RoC below zero indicates a downtrendA RoC hovering near zero hints for consolidation What is the ROC...
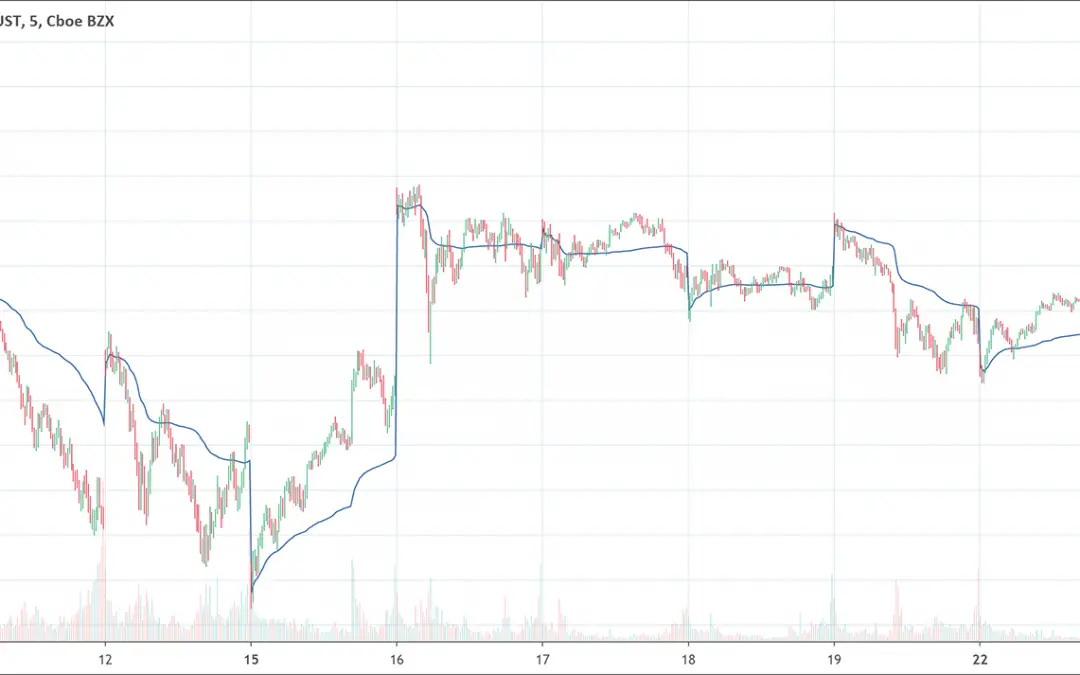
There are various technical indicators that have made the analysis of the financial markets remarkably easy. Some of them work with the objective of finding momentum. Others aim to find potential points of interest on a chart. But what is the most important aspect of...
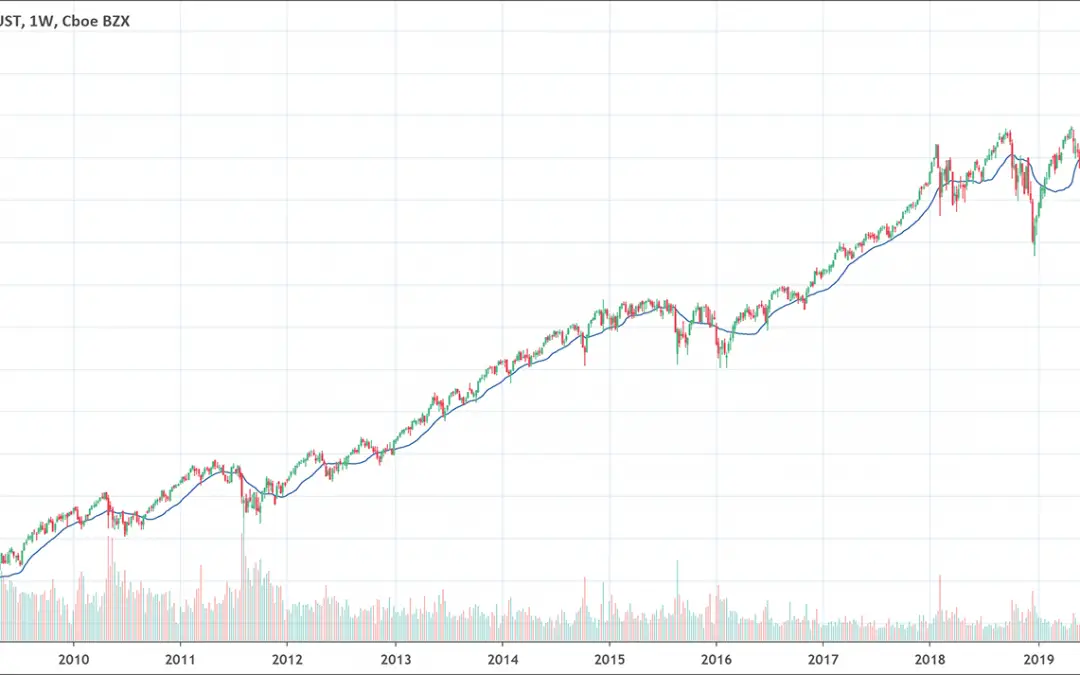
If you have an interest in financial trading, you must have knowledge of two concepts, moving averages and volume. Moving averages is one of the most common and widely used indicators in the financial trading world. Volume is also another important concept that is...
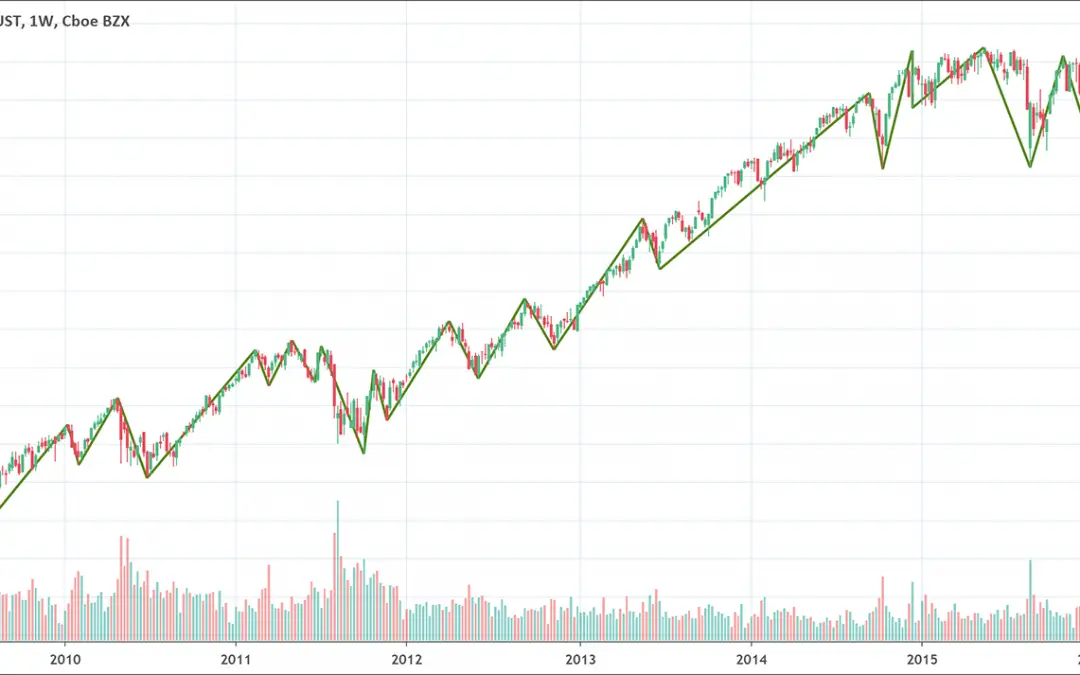
The Zig Zag indicator helps traders reduce market noise. It highlights underlying trends with its higher highs or lower lows.The indicator works best in strongly trending markets. What is the Zig Zag indicator? The Zig Zag indicator is a very well-known tool by...
![Stochastic RSI indicator: Full Guide [2022]](https://patternswizard.com/wp-content/uploads/2020/07/stochrsi-1080x675.png)
The oscillator helps trader take advantage of both momentum indicators to make another indicator. The new indicator is more sensitive and synchronises well to the historical performance of a particular security. It doesn’t generalized analysis of price variation. In...
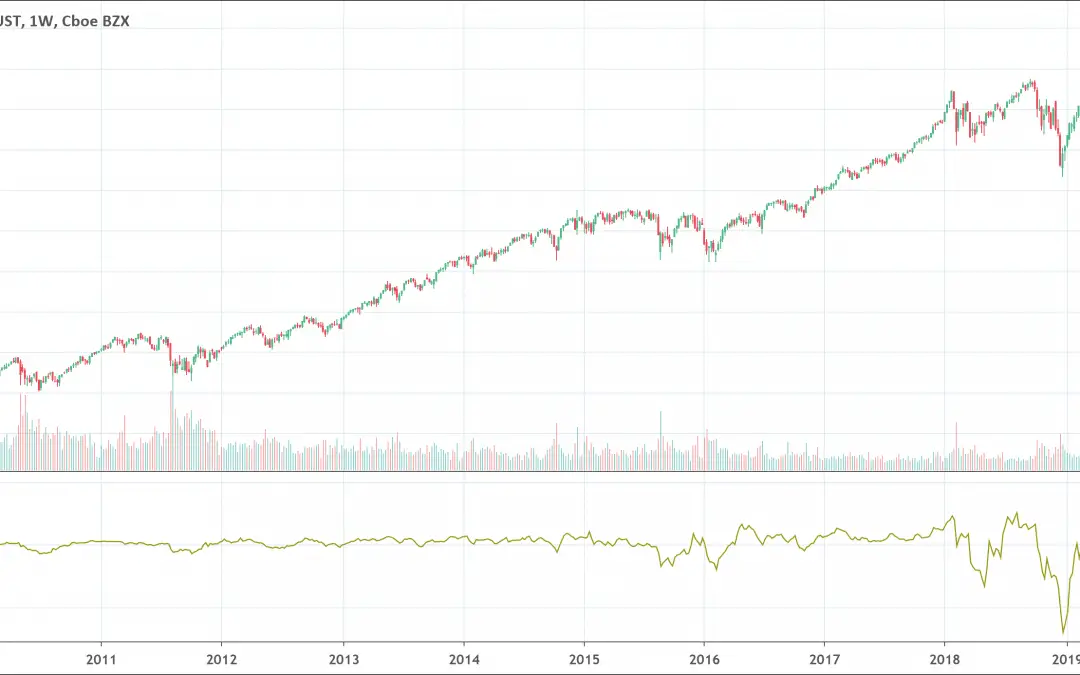
Ease of movement (EMV) momentum indicator shows the link between the rate of change in the price of an asset and its volume. It is best to use it for the daily chart and longer timeframes. Just as its name implies, the bigger the magnitude of the indicator, the easier...
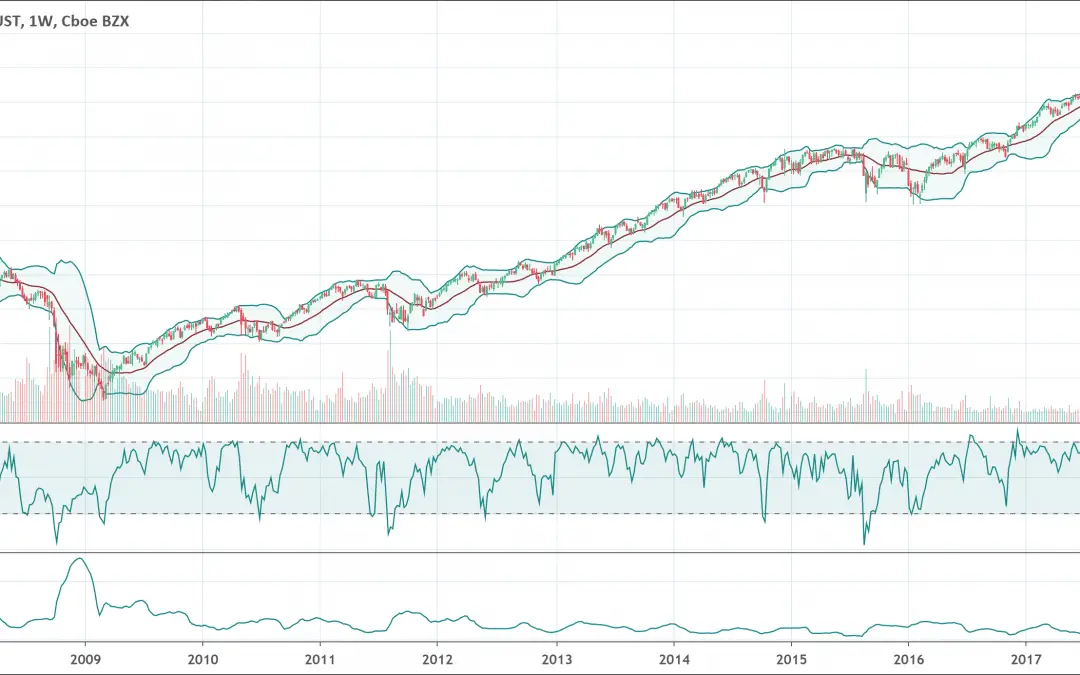
John Bollinger created the technique of using a moving average with two trading bands below and above it. He introduced this technique in the 1980s and he trademarked this term in 2011. Bollinger was a long-time technician of the markets. Previously, it was known as...
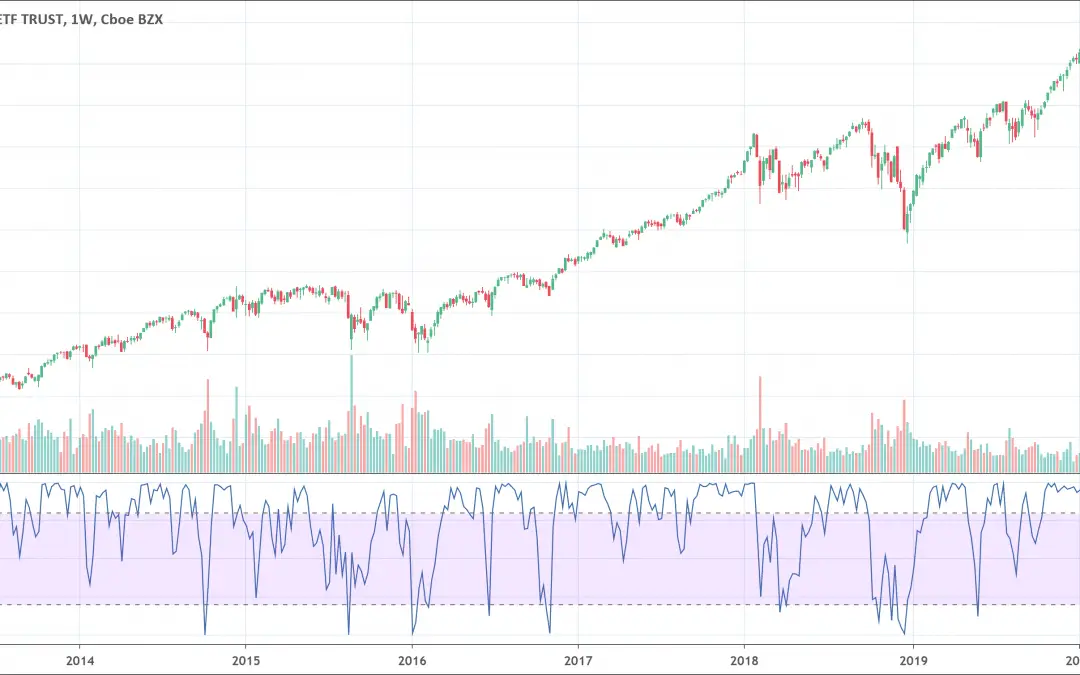
The Williams %R indicator oscillates between 0 and -100.When its value is above -20, it sends an overbought signal.When its value is below -80, it sends an oversold signal.Overbought and oversold signals are clues the price is reaching extremes. What is the Williams...
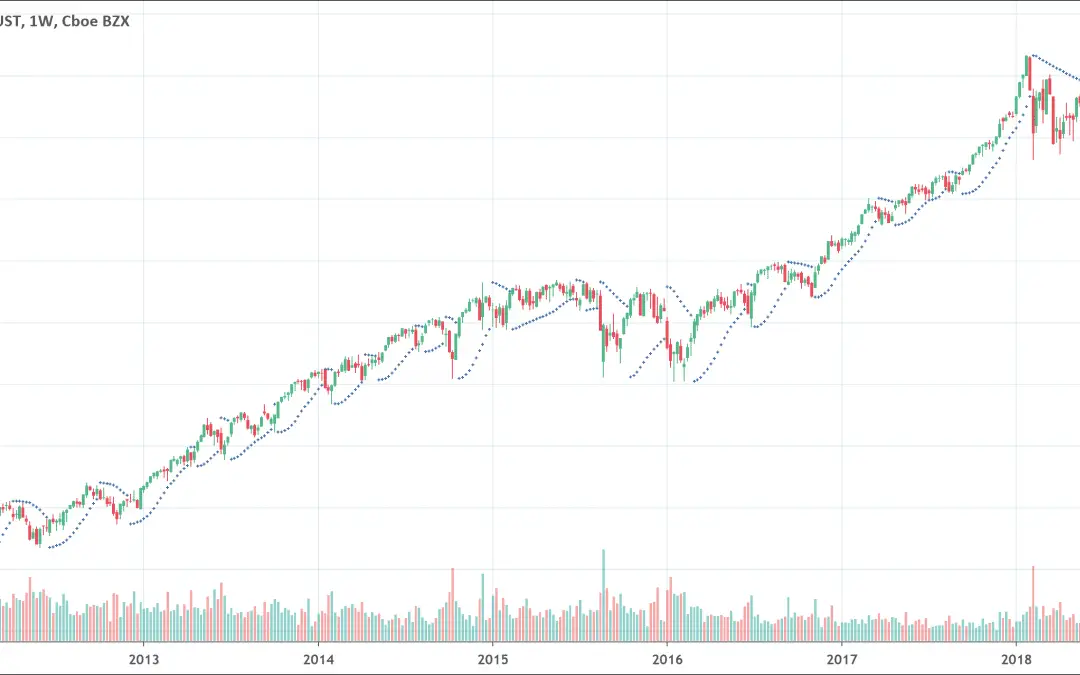
The Parabolic SAR indicator helps traders spot trend direction and potential reversals.It appears on charts as a series of dots/cross above (when price is going down) or below (when price is going up) security’s price.It’s mainly used as a trailing stop. What is the...
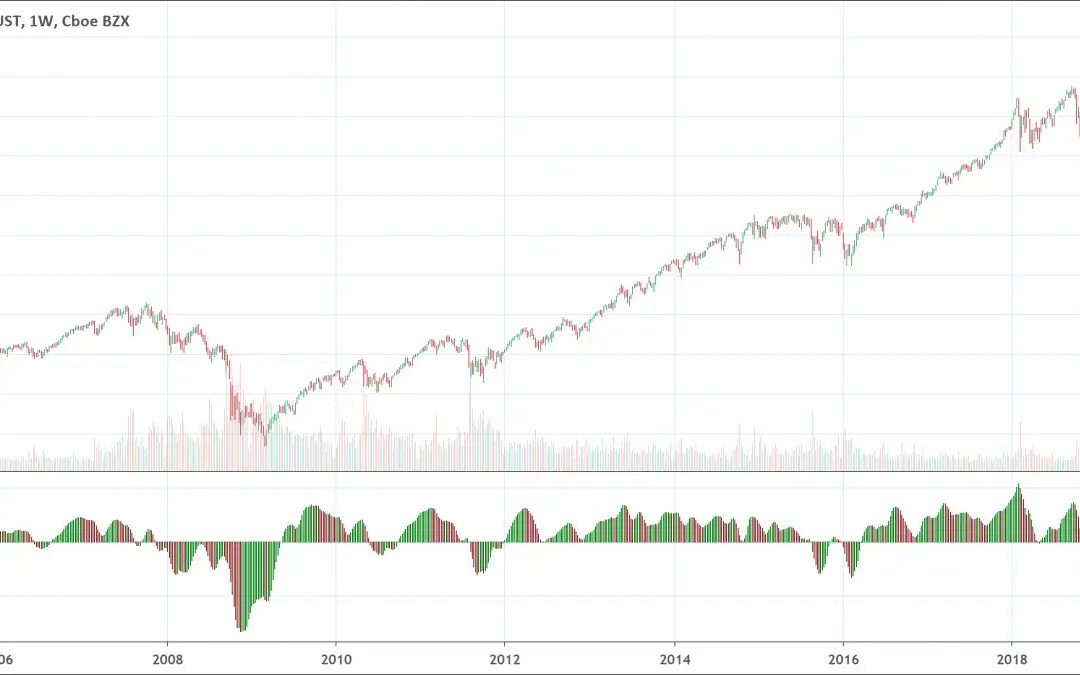
The legendary chartist, Bill Williams created the Awesome Oscillator indicator. He showed it as the best momentum indicator that is as simple as it is elegant. Traders use it to determine the momentum of the asset at hand in the course of recent events within the...
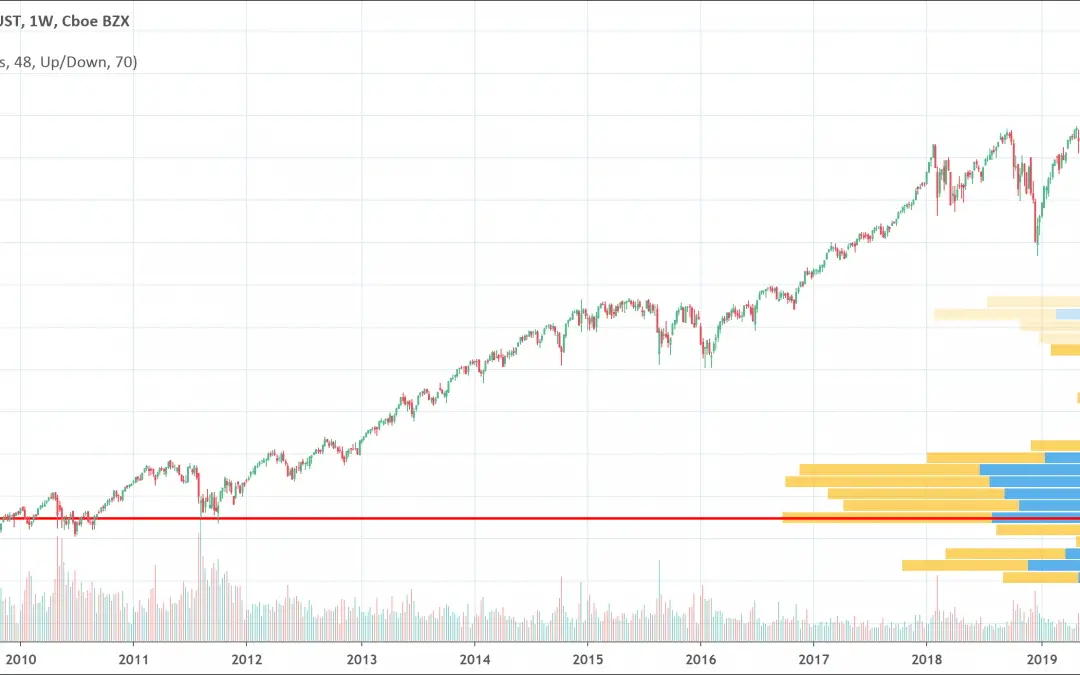
Volume Profile shows the price where the security was most traded.It takes a given range for computation (either visible or fixed).The more volume traded at a given price, the bigger the Volume Profile bar will be. What is the Volume Profile indicator? Volume Profile...
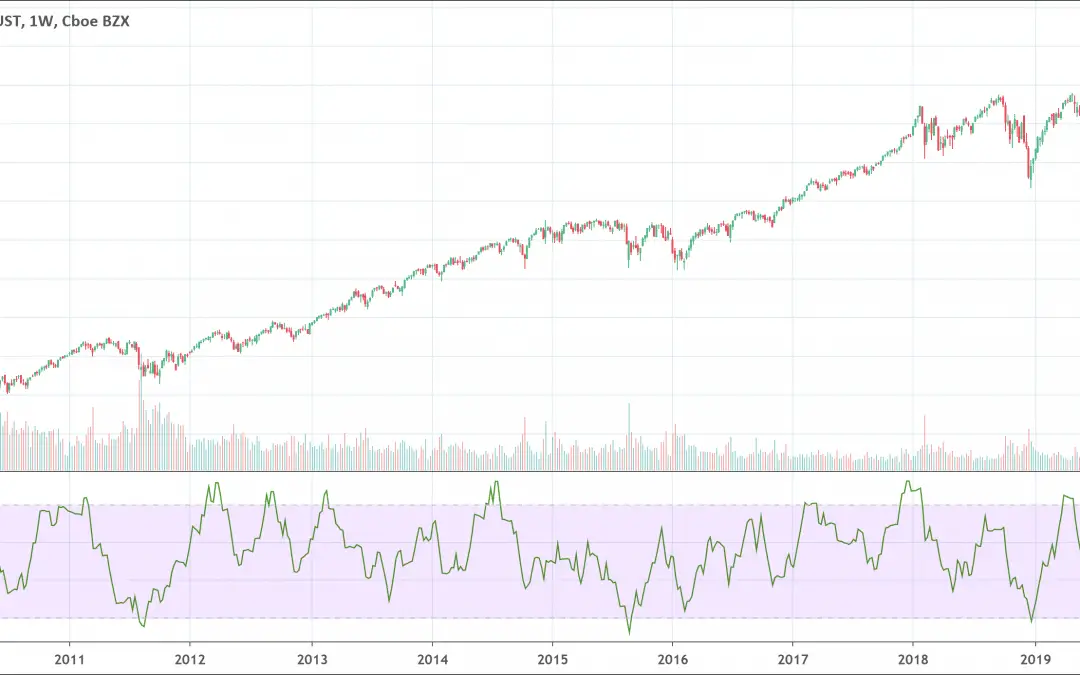
The Money Flow Index (MFI) indicator is a momentum indicator.When MFI is above 80, the market is considered overbought.When MFI is below 20, the market is considered oversold.The indicator value can be used on its own, but it also can be used when it draws in...
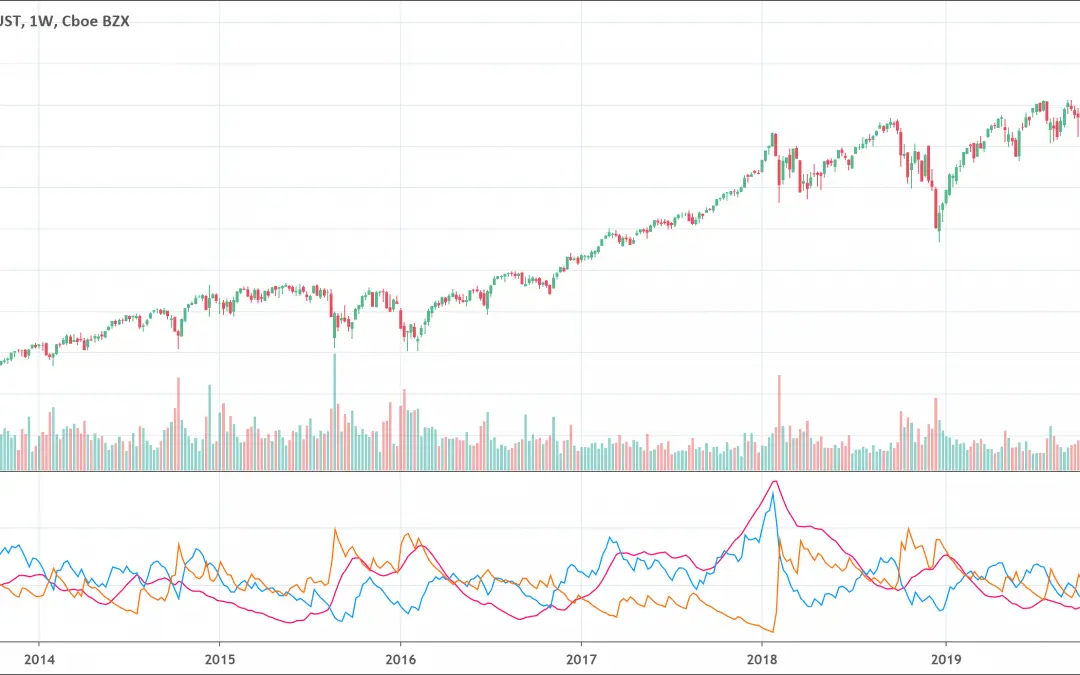
The Directional Movement Index (DMI) is composed of 2+1 linesThe -DI line shows the selling pressure (-DI),The +DI line shows the buying pressure And the DX line shows the difference between the two othersWhen +DI is above -DI, it means the price is mainly having...
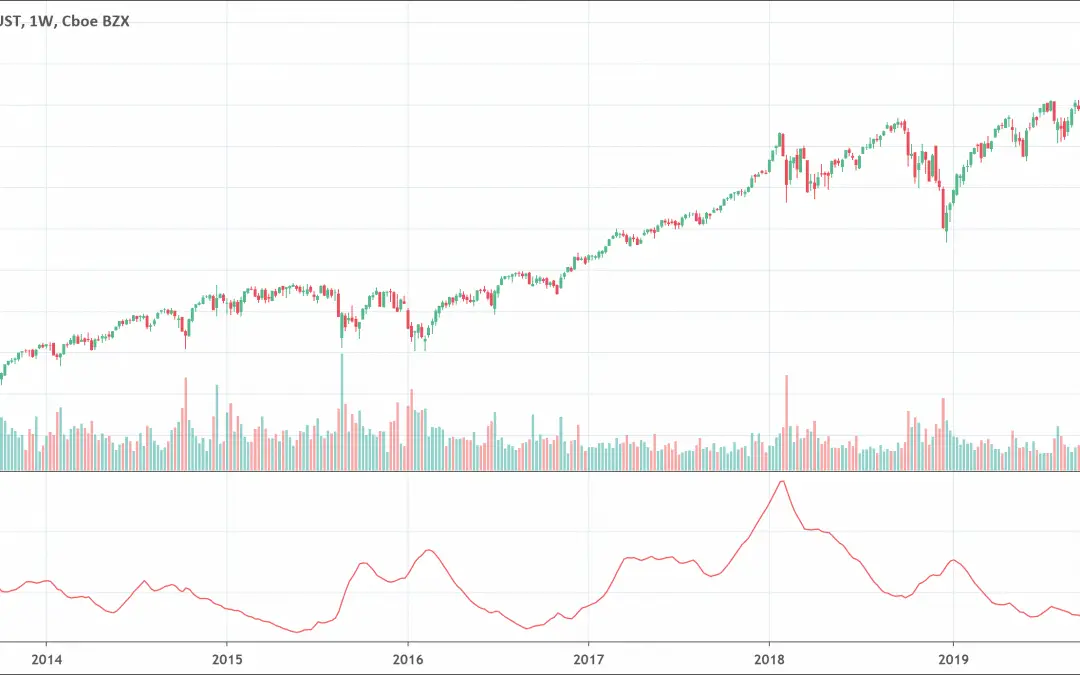
The Average Directional Index is built on top of the Directional Movement Index.When ADX > 25, the trend is considered to be strong.When ADX < 20, the trend is considered weak or trendless. What is the Average Directional Index (ADX)? Average Directional...
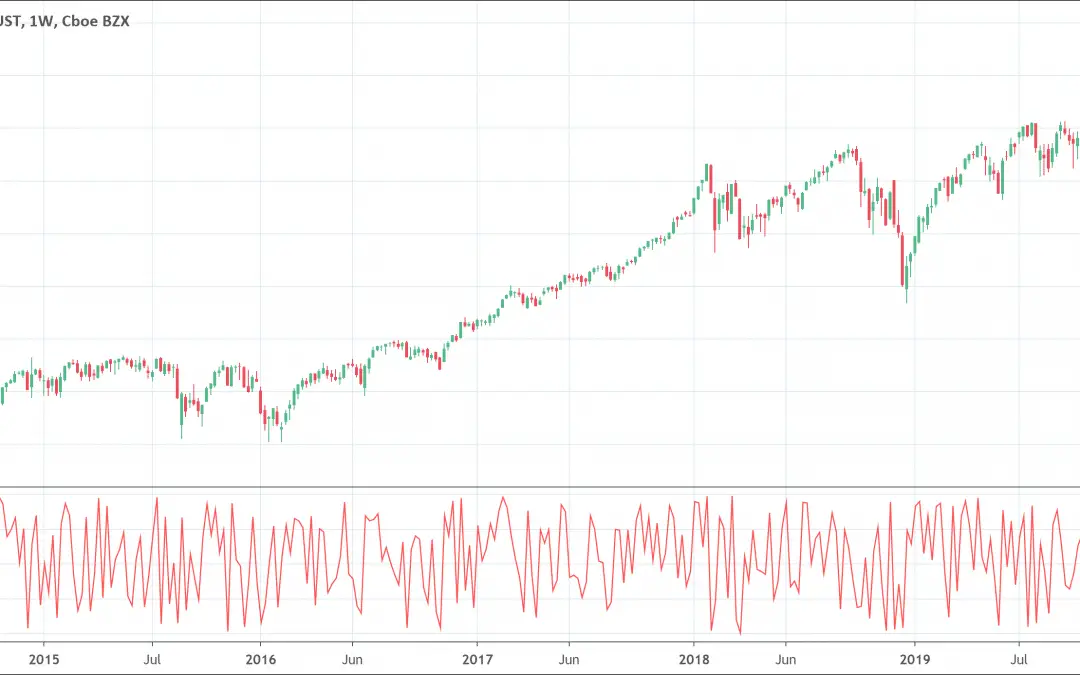
The Balance of Power indicator measures the strength of buyers in the market against sellers.It does so by assessing how able each side are to drive prices to an extreme level. Balance of Power = (Close price – Open price) / (High price – Low price)The result can be...
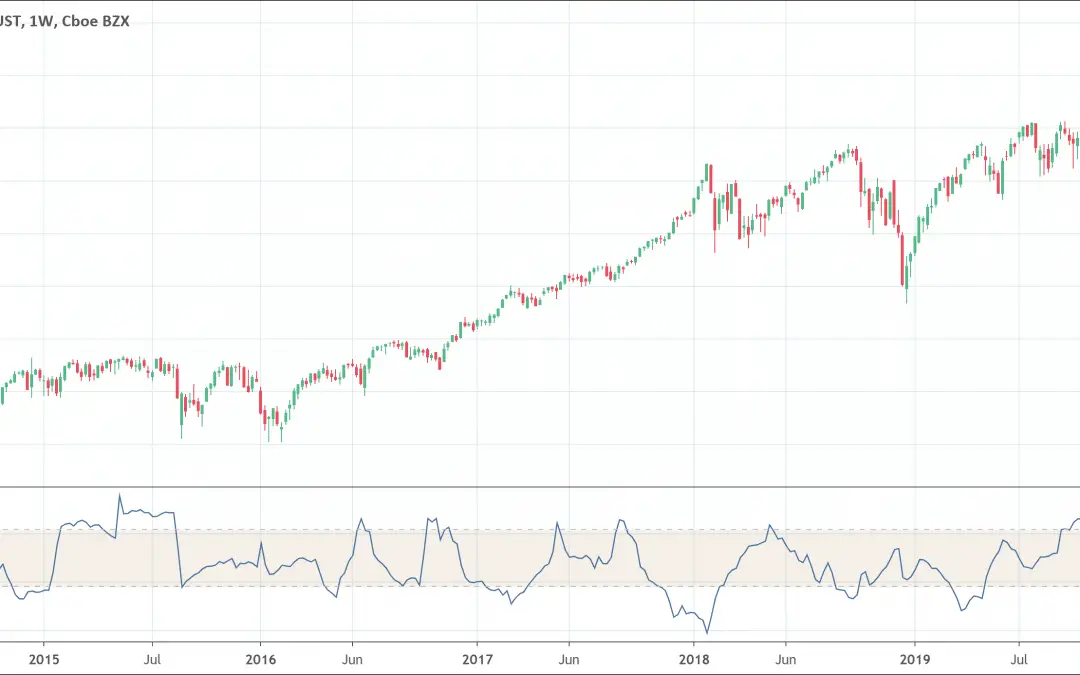
The Choppiness Index indicator is a volatility indicator.It determines whether the market is following a trend or the market is choppy and trading sideways. The Choppiness Index indicator is a volatility indicator that determines whether the market is following a...
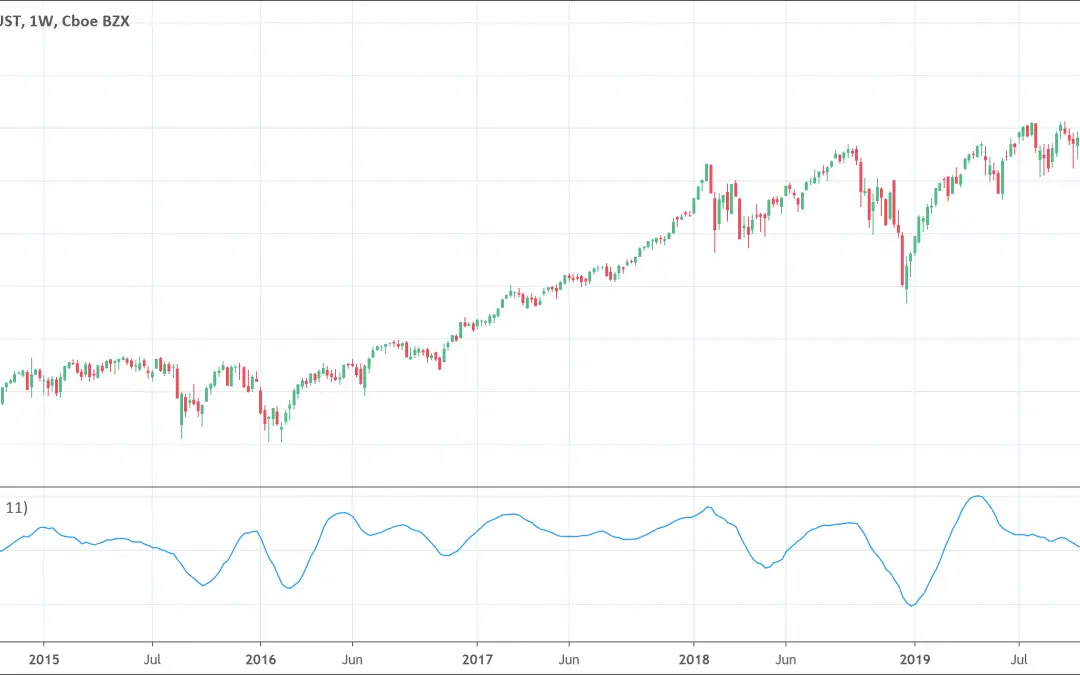
The Coppock Curve indicatoris a momentum indicator.It helps to identify long-term trading opportunities in the stock market.The Zero-Line functions as a trade-trigger. It gives the buying signal when the Coppock Curve is above zero and selling signals when the Coppock...
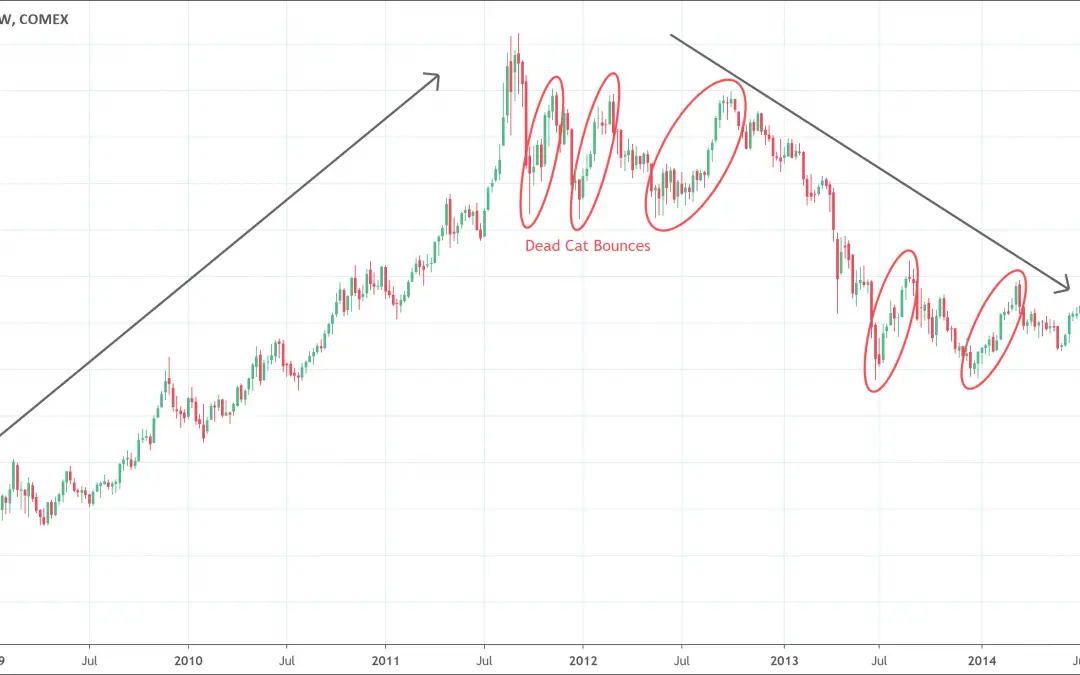
The dead cat bounce pattern is a specific stock chart phenomenon that occurs during a long downtrend.It is a short term reversal bounce that takes place in the context of a very long downtrend.In simple words, the pattern is a correction of a long bearish trend. The...
![Elliott Waves Theory: The Complete Guide [2022]](https://patternswizard.com/wp-content/uploads/2020/08/elliottwave-1080x675.png)
Elliott Waves help traders better understand where price is within bigger trend.There are two types of waves: motive and corrective.Proper Elliott Waves follow strict counts (12345 for motive waves, ABC for corrective waves). The impulsive phases establish the trend...
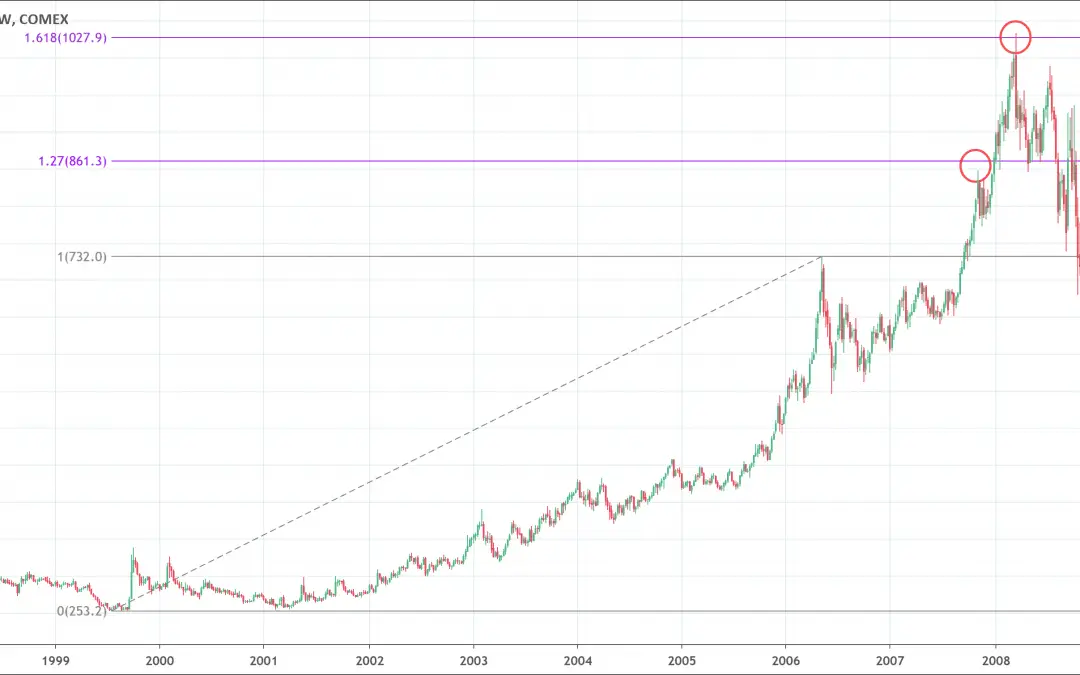
Fibonacci extensions are projections to give clues about where price could reverse in unchartered territories.123.6%, 138.2%, 150%, 161.8%, and 178.6% are the most important Fibonacci extensions levels. Fibonacci extensions, also known as Fibonacci expansions or...
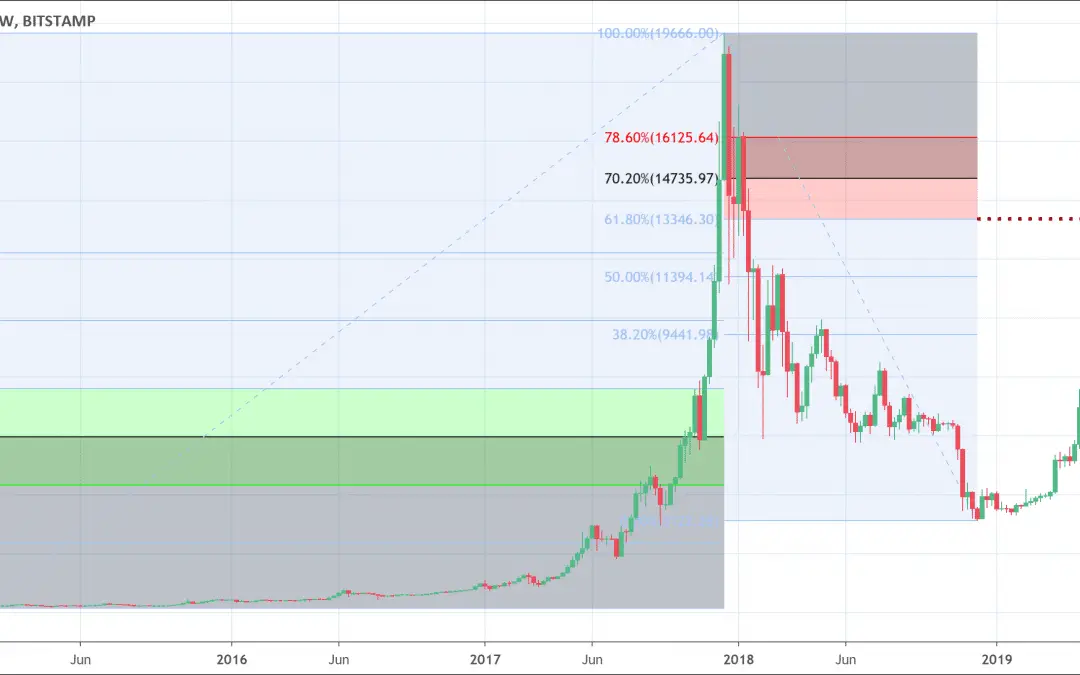
Fibonacci Retracement gives traders levels for the price to retrace after 23.6%, 38.2%, 50%, 61.8% and 78.6% are the most common levels. Fibonacci Retracement or Fib Retracement is a technical analysis tool that traders use to predict areas of interest on a chart. Fib...
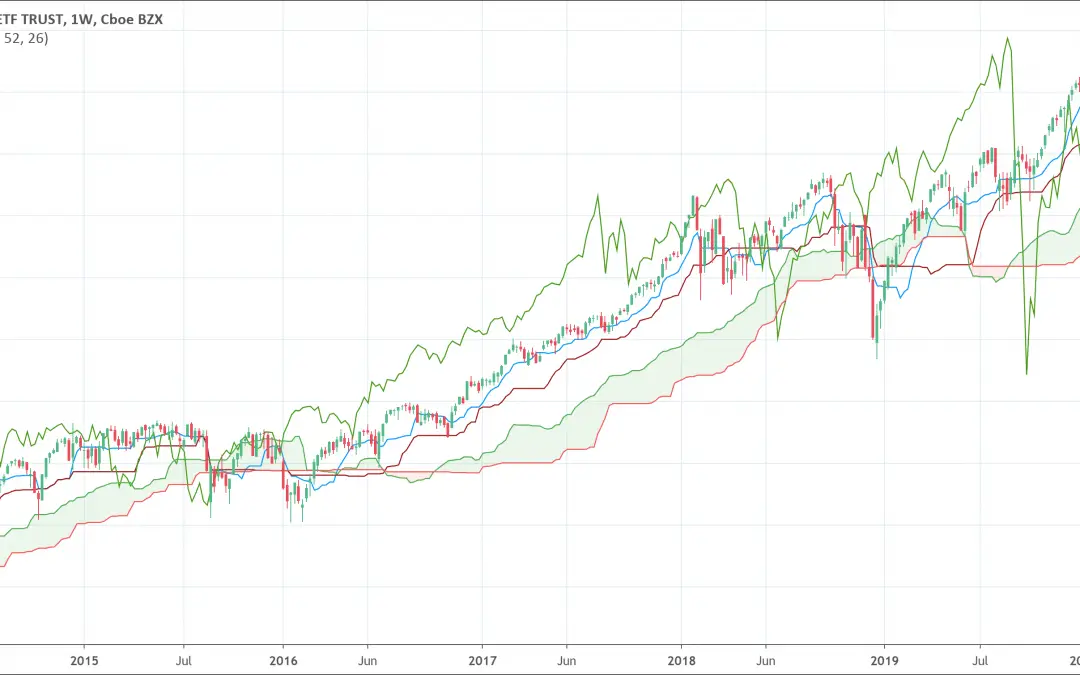
The Ichimoku Cloud is composed of five lines. The include a:nine-period average, 26-period average, average of those two averages, 52-period average, and a lagging closing price line.The Cloud is a key part of the indicator. When price is below the cloud the trend is...
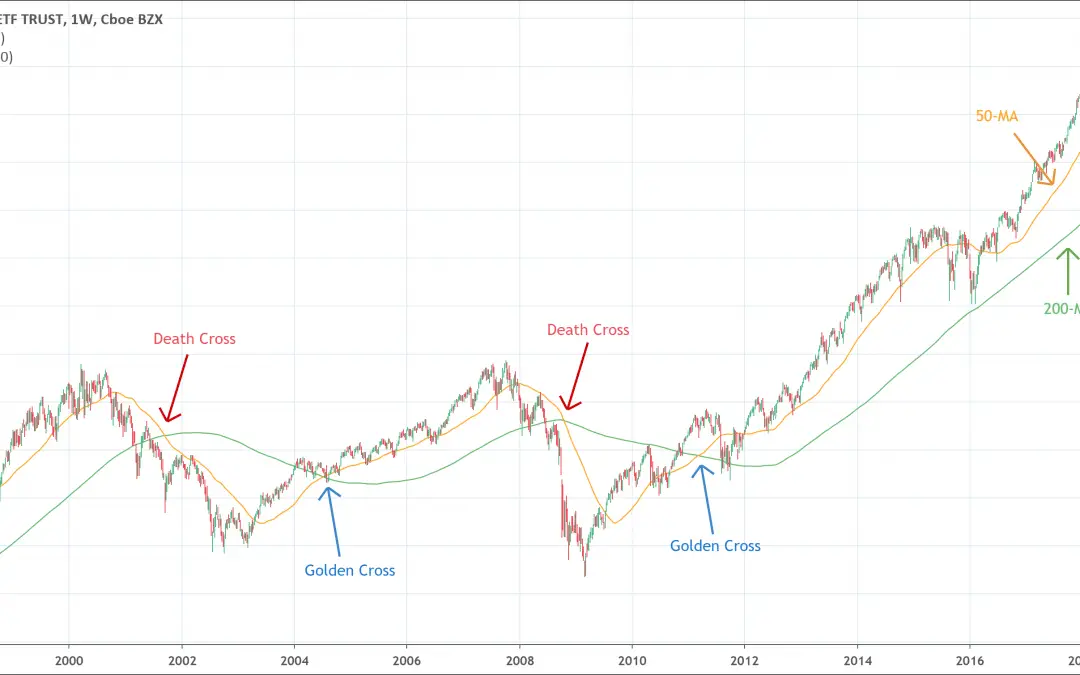
Moving Average Crossover signals a trend reversal.The most popular one is between the 50-MA & 200-MA.The bullish cross is the golden cross and the bearish cross is the death cross. Before you keep looking down this article, you should check 2 of courses I...
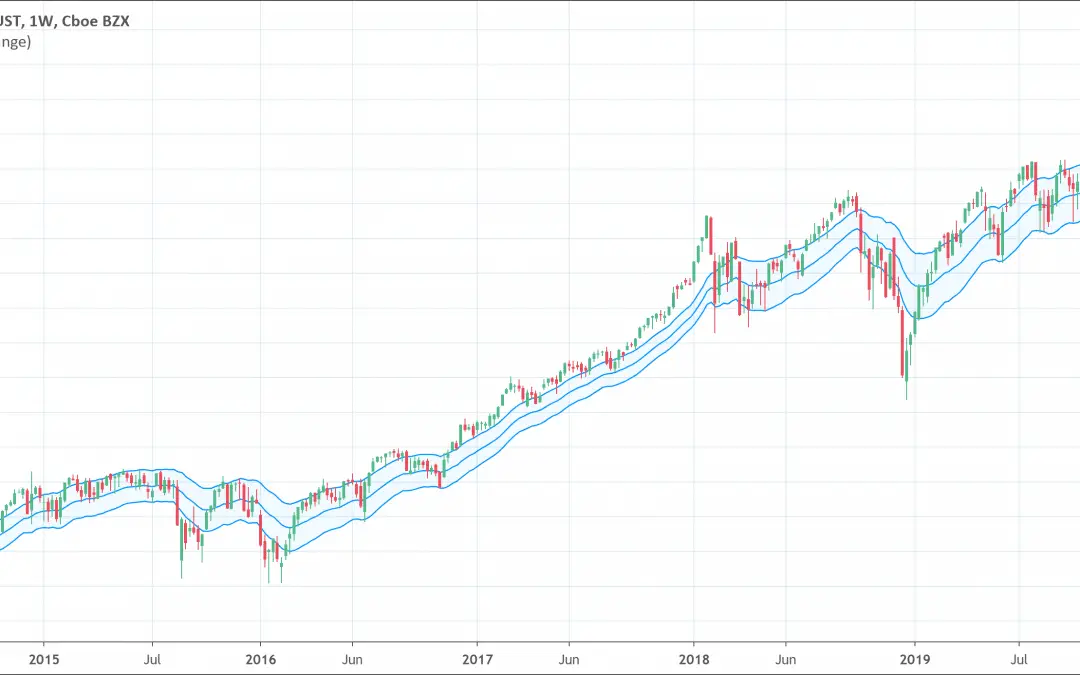
The Keltner Channel is a volatility based indicator.It indicates whether the market's trend is likely to continue or it may change direction.It is generally built with a 20-period EMA as the center line and two lines above at a 2 Average True Range distance. The...
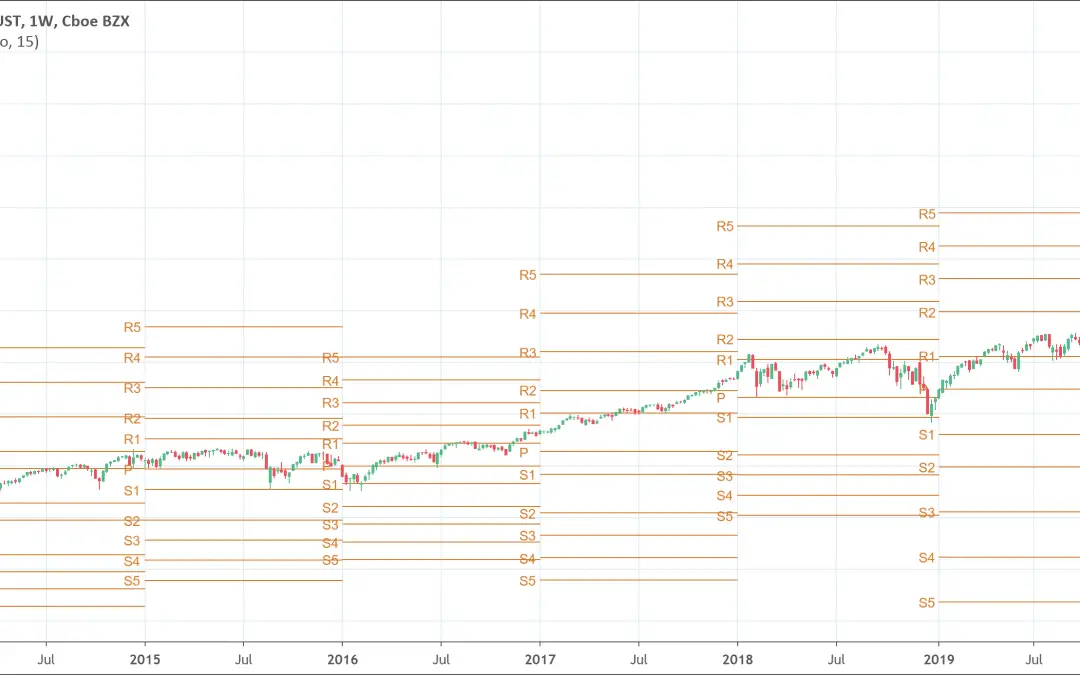
The Pivot Point indicator automatically draws potential resistance/support levels.It make use of the high, low, and close of the previous period to estimate future support/resistance levels. Pivot points are important levels chartists that traders use to detect...
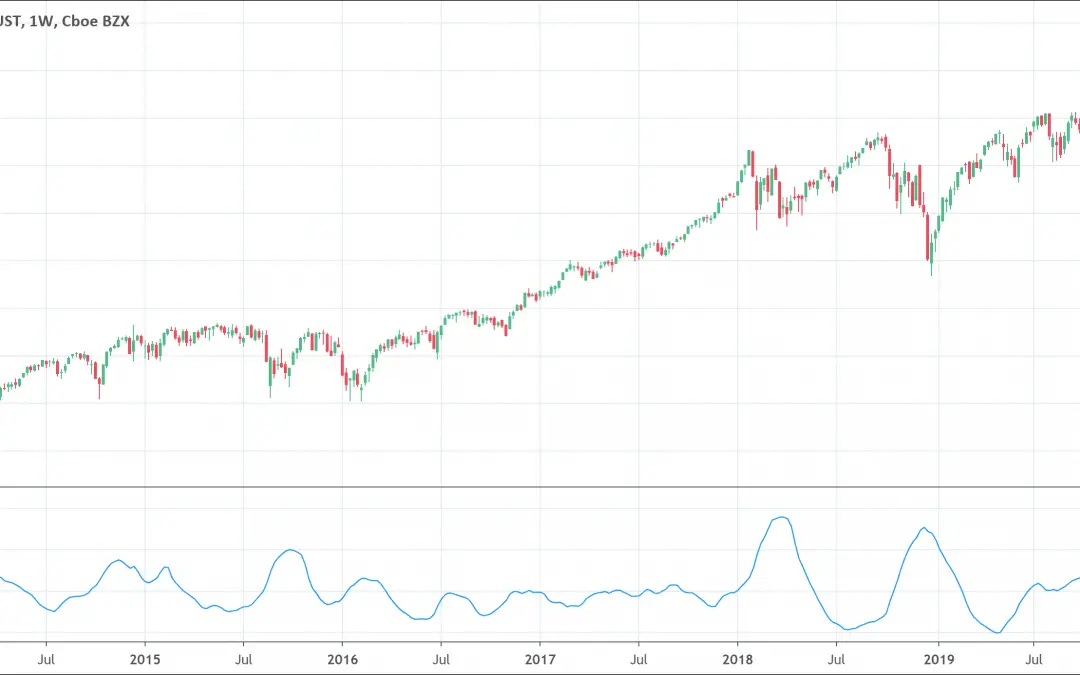
The Mass Index indicator helps traders determine trend reversals.It examines the difference between low and high prices in a security over a period.It calculates with the exponential moving average (EMA) of price over a nine-days period and the exponential moving...
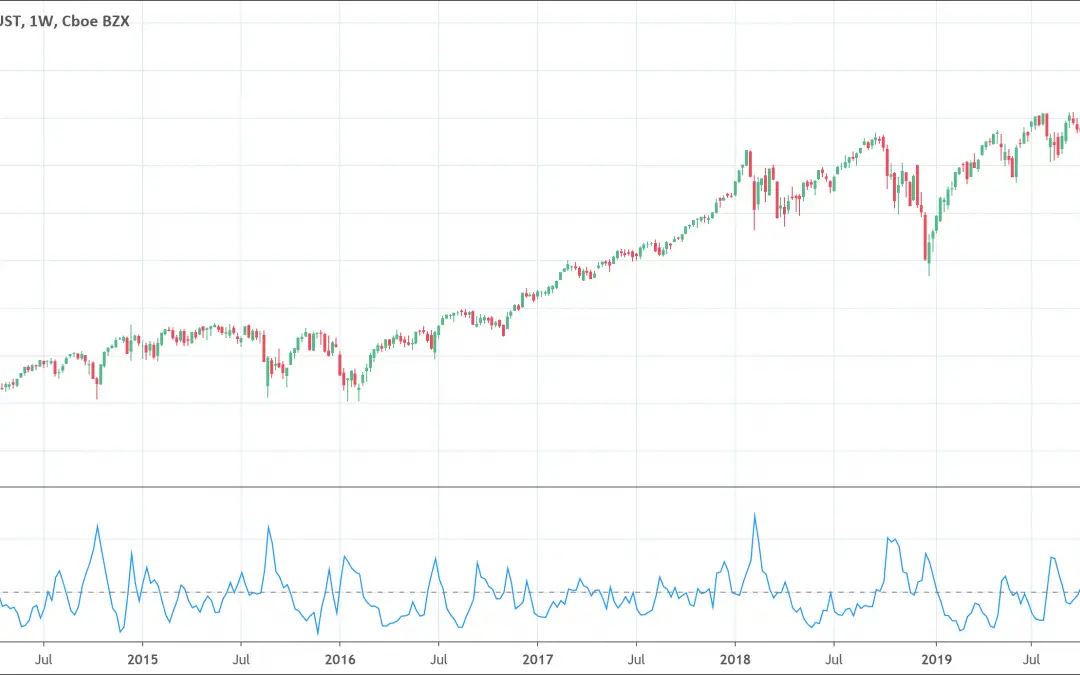
The Volume Oscillator identifies the trend in volumes with a system of two Exponential Moving Averages..The Volume Oscillator is made up of two moving averages of volume, one fast and the other slow.The moving average of the fast volume is subtracted from the moving...
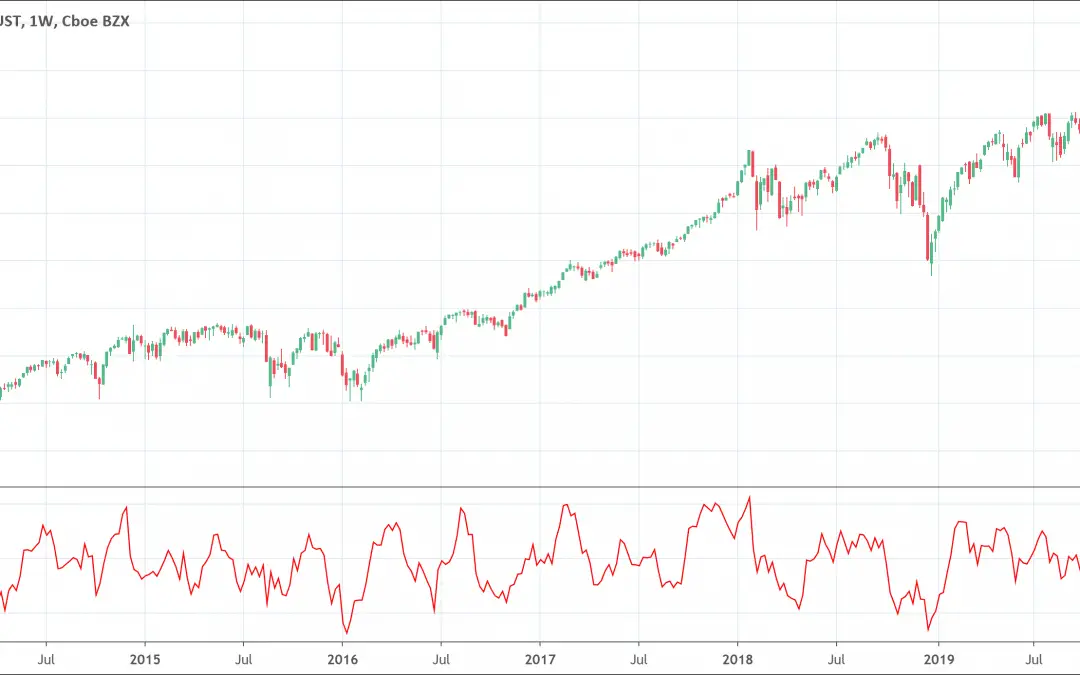
The Ultimate Oscillator is a momentum indicator.It integrates three various times within one value.It directs traders on how to better time their entry and exits in the market. The ultimate oscillator is a momentum indicator. It grabs momentum across three...
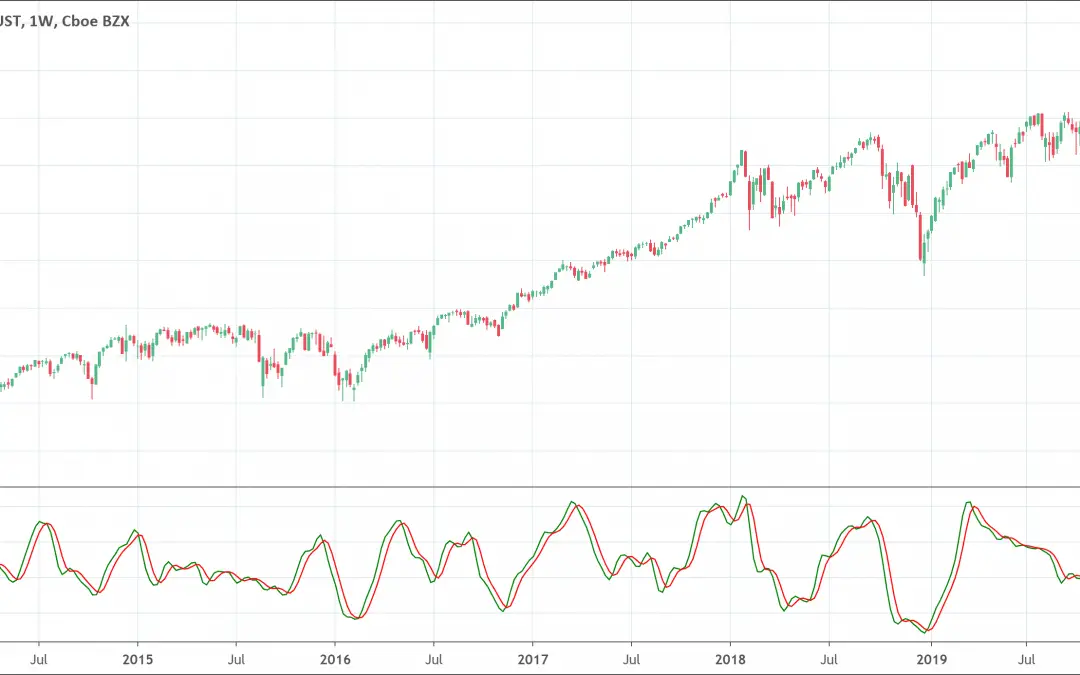
The Relative Vigor Index indicator is an oscillator.It measures the strength behind a price move.It compares the end price range and offers a reading of the strength of price movement up or down. The Relative Vigor Index compares the end price range and offers a...
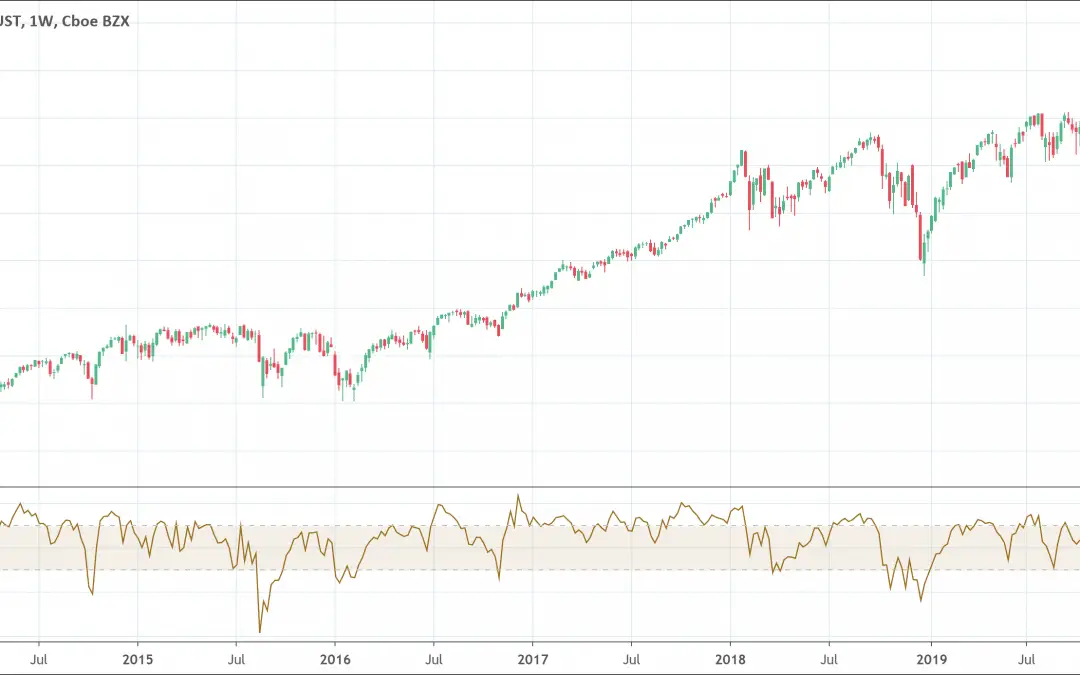
The Commodity Channel Index is a momentum-based indicator.It helps traders determine when an investment vehicle gets to a condition of being overbought or oversold.This information makes it possible for traders to know if they want to enter or leave a trade. The...
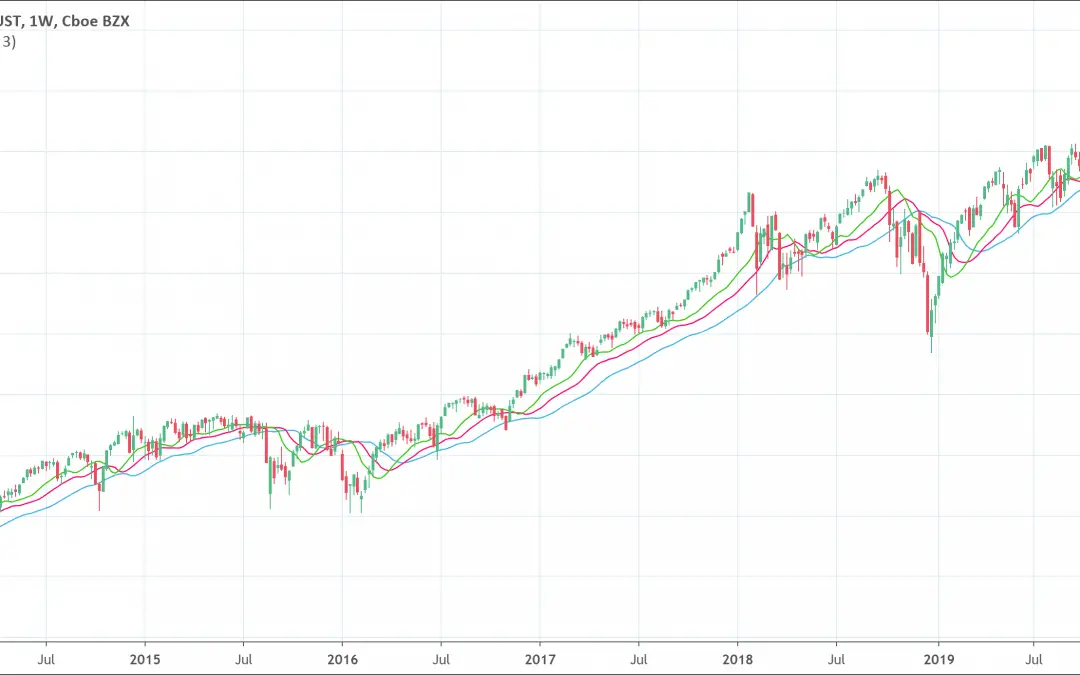
The Williams Alligator indicator is composed of 3 lines. Each line is a Moving Average is a different period (5-8-13).It helps traders understand the market trend and potential reversal. When the fastest line is above the middle one which is above the slow one, trend...
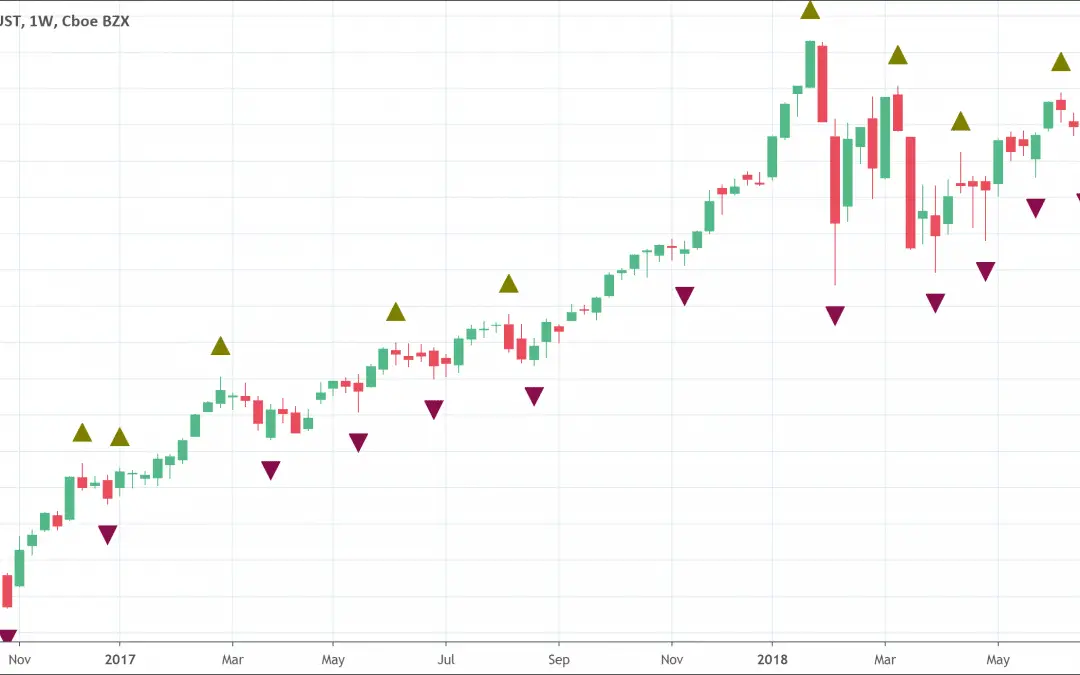
The Williams Fractal indicator detects patterns known as fractals.The fractals are made of five or more bars.It helps traders spot potential bullish and bearish price reversals. If you're wondering where to go to chart your favorite markets and display the Williams...
![Volume Price Trend Indicator: Full Guide [2022]](https://patternswizard.com/wp-content/uploads/2020/08/pricevolumetrend-1080x675.png)
The Volume Price Trend is a volume momentum indicator.It makes use of both percentage changes in price and volume. It uses them to confirm the strength of the trend in price. The volume price indicator adds or subtracts multiples of a percentage change in recent stock...
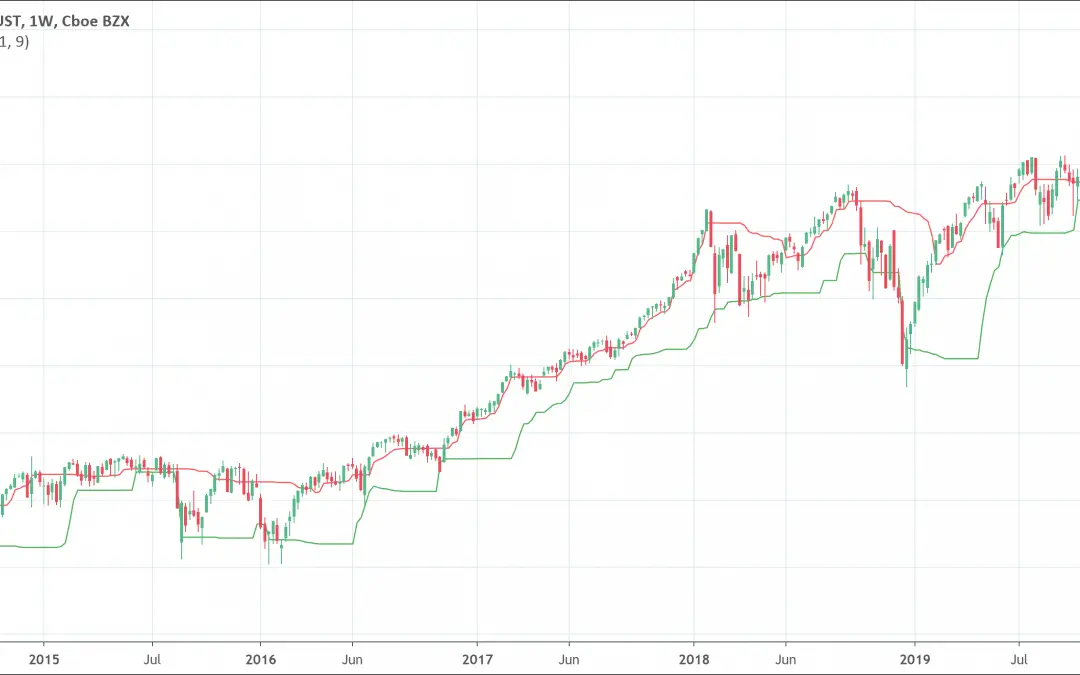
The Chande Kroll Stop indicator is made of two lines.It automatically allows placement of protective stops based on both upward and downward volatility. Tushar Chande and Stanley Kroll suggested the Chande Kroll Stop indicator in their book “The New Technical Trader”....
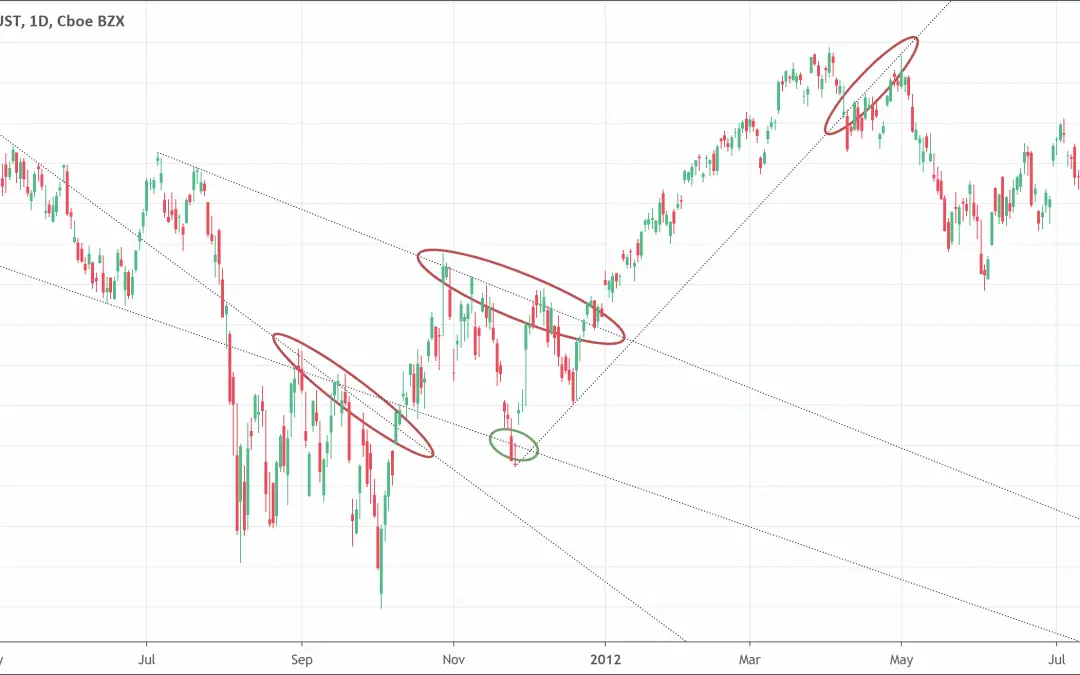
Trendlines connect two price points at least and may extend further forward to indicate support and resistance areas.It helps traders understand the trend and possible reversals. Trendlines are an indicator that helps to identify and confirm trends. It is a simple but...
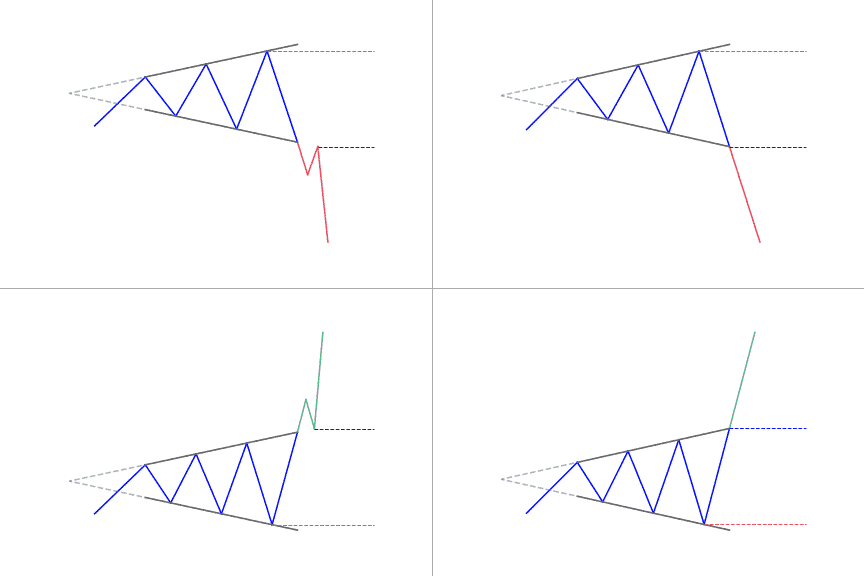
The broadening top pattern is a bearish reversal pattern.It's tougher to trade than other classical patterns as lows and highs get taken out one by one.It can also be called the "megaphone pattern". What is the broadening top pattern? The broadening top pattern...
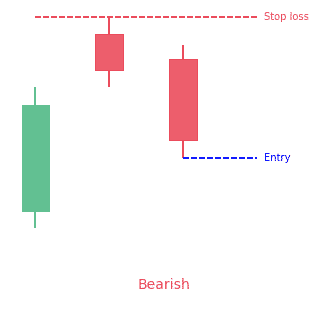
The Two Crows candlestick pattern is a three-line bearish reversal pattern.How to identify the pattern:The market must be in an uptrend. The first candle must be a long white candle. The second candle is a short black candle that starts with an...
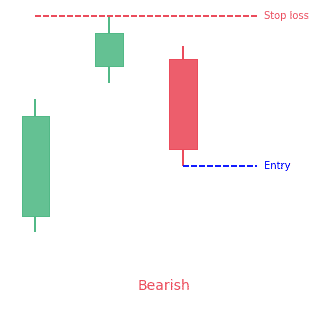
The upside gap three methods candlestick pattern is a 3-bar bearish continuation pattern.It has 2 green candles and a red one.The second candle gaps above the first one. Statistics to prove if the Upside Gap Three Methods pattern really works [displayPatternStats...
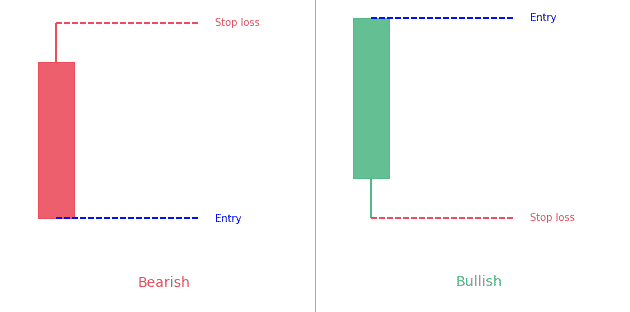
The Closing Marubozu is a 1-bar continuation candlestick pattern.It's a long candle close at it's high (bullish) or low (bearish). Statistics to prove if the Closing Marubozu pattern really works What is the Closing Marubozu...
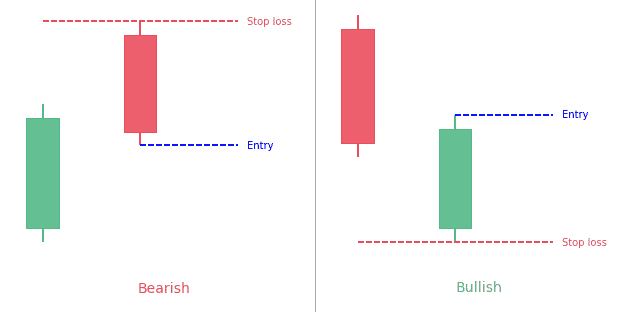
The Thrusting candlestick pattern is a two-bar pattern.The second candle gaps up/down and then retrace to close within the 1st candle's body. Statistics to prove if the Thrusting pattern really works What is the Thrusting...
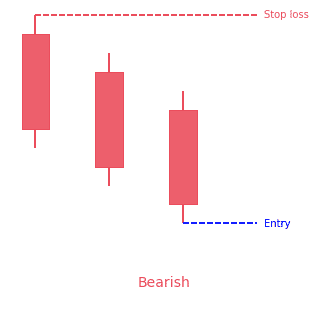
The identical three crows candlestick pattern is a 3-bar bearish reversal pattern.It occurs during an uptrend.It is made of three consecutive bearish candlesticks. Statistics to prove if the Identical Three Crows pattern really works [displayPatternStats...
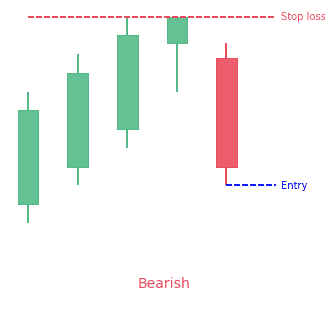
The Ladder Top candlestick pattern is a 5-bar bearish reversal pattern that appears at the end of a bullish trend.You can identify it with the following characteristics: The first three candles are always white with long real bodies opening and closing above the open...
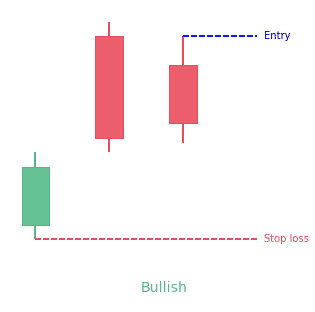
The up-gap side by side white lines candlestick pattern is a 3-bar bullish continuation pattern.The first and second lines are separated by a bullish gap. Statistics to prove if the Up-Gap Side By Side White Lines pattern really works [displayPatternStats...
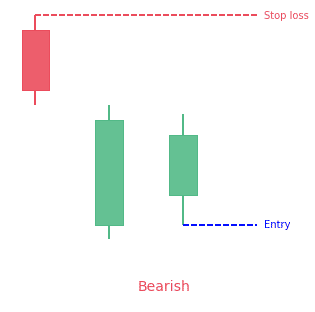
The down-gap side by side white lines candlestick pattern is a 3-bar bearish continuation pattern.It appears during a downtrend. Statistics to prove if the Down-Gap Side By Side White Lines pattern really works What is the...
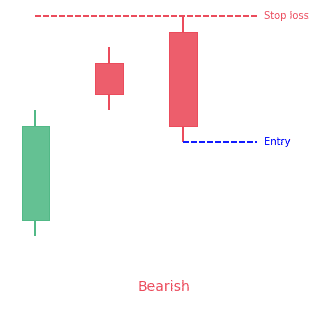
The upside gap two crows candlestick pattern is a 3-bar bearish reversal pattern.It appears during an uptrend. Statistics to prove if the Upside Gap Two Crows pattern really works What is the upside gap two crows candlestick...
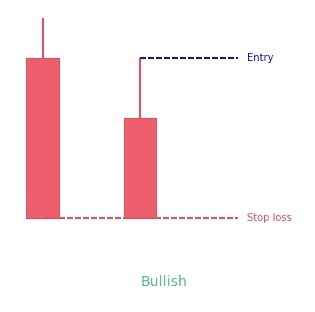
The matching low candlestick pattern is a 2-bar bullish reversal pattern. It occurs during a downtrend.As his name suggests, both lows from the 2 candles are equal. Statistics to prove if the Matching Low pattern really works ...
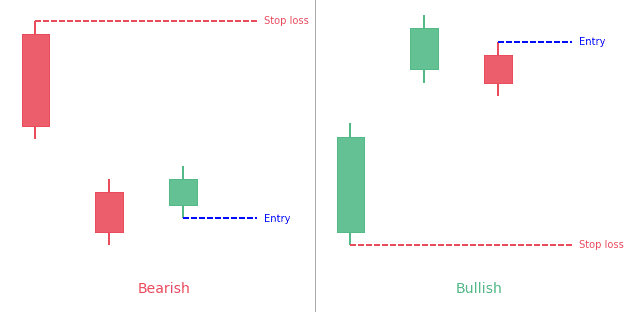
The Tasuki gap candlestick pattern is a three-bar continuation pattern.The first two candles have a gap between them.The third candle then closes the gap between the first two candles. Statistics to prove if the Tasuki Gap pattern really works...
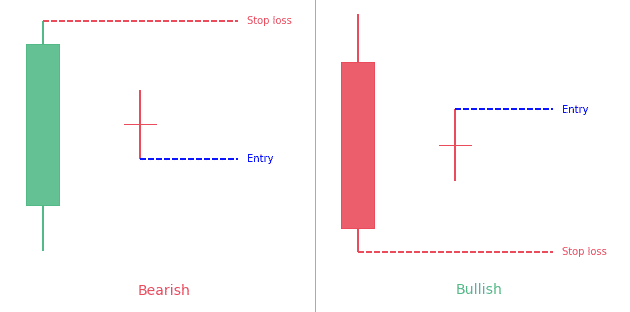
The harami candlestick pattern consists of two candlesticks.The first candle is a big one and the second candle is a doji, contained within the first one's body. Statistics to prove if the Harami Cross pattern really works What...
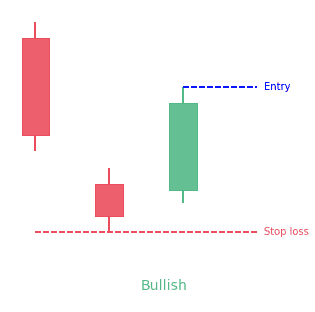
The downside gap three methods is a 3-bar candlestick pattern.It appears during a downtrend.The first two candles have a gap down between them while the third candle covers the gap between the first two. Statistics to prove if the Downside Gap Three Methods pattern...
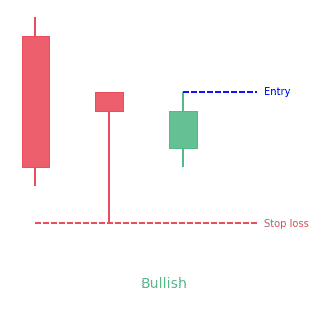
The unique three river bottom candlestick pattern is a bullish reversal pattern.It occurs during a downtrend in the market. Statistics to prove if the Unique Three River pattern really works What is the unique three river...
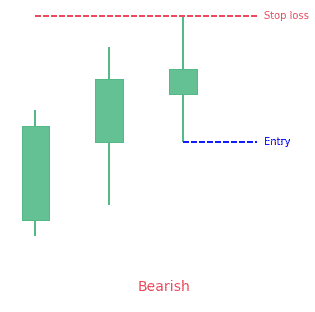
The advance block candlestick pattern is a 3-bar bearish reversal pattern.It has three long green candles with consecutively higher closes than the previous candles.Each candle has a shorter body than the previous one. Statistics to prove if the Advance Block pattern...
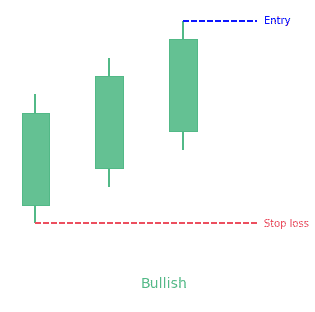
The three white soldiers candlestick pattern is a 3-bar bullish pattern.It has 3 long green candles, each making new higher high.Each candle's body should be approximately the same size. Statistics to prove if the Three White Soldiers pattern really works...
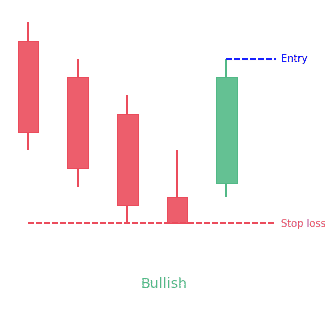
The ladder bottom candlestick pattern is a 5-bar bullish reversal pattern.It forms following these characteristics:The first three long black candlesticks, resembling three black crows formation, with successive lower opens and closeThe fourth is also a black...
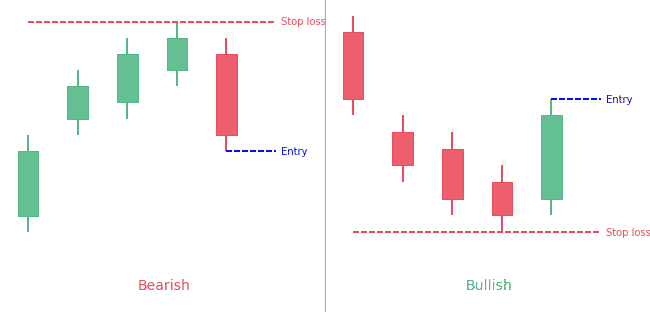
The breakaway candlestick pattern is a five bar reversal candlestick pattern.It can be bullish or bearish.The first candle must be a long candle.The next three candles must be spinning tops. The second candle must also create a gap between the first and...
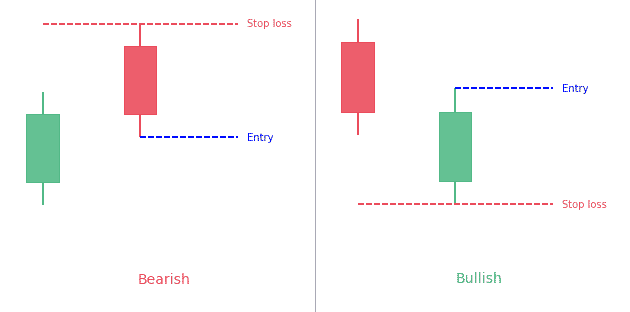
The counterattack candlestick pattern is a reversal pattern that indicates the upcoming reversal of the current trend in the market. There are two variants of the counterattack pattern, the bullish counterattack pattern and the bearish counterattack pattern. The...
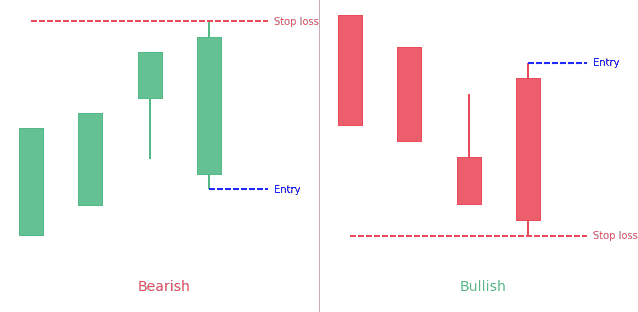
The concealing baby swallow candlestick pattern is a 4-bar bullish reversal pattern.The first candle must be a Marubozu which appears during a trend. The second candle must also be a same color Marubozu. It opens within the body of the previous candle and closes...
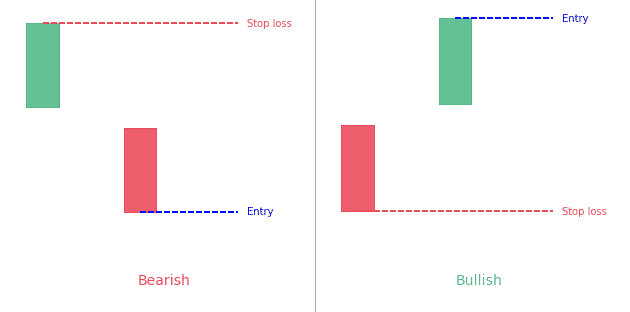
The kicking candlestick pattern is a 2-bar reversal pattern.It is made of two opposite side marubozus separated by a price gap. Statistics to prove if the Kicking pattern really works The kicking candlestick pattern is a two-bar...
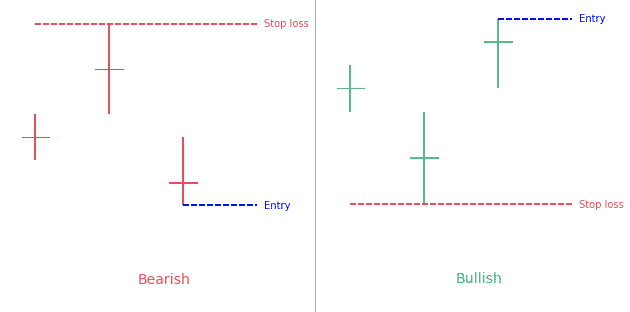
The tri-star candlestick pattern is a 3-bar trend reversal pattern.There must be a clear and defined trend in the market. Three consecutive Doji candles must appear. The second Doji candle must create a gap below the first and third Doji candles creating a...
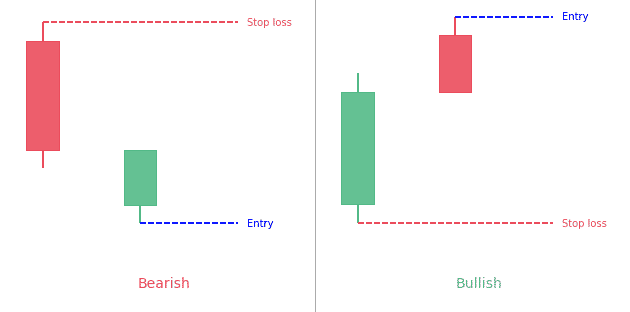
The in-neck candlestick pattern is a 2-bar continuation pattern.Closing prices of both candles are the same or nearly the same forming a horizontal neckline. Statistics to prove if the In-neck pattern really works The in-neck...
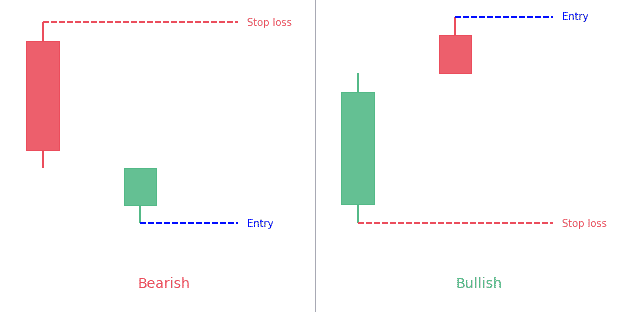
The on-neck candlestick pattern is a 2-bar continuation pattern.Closing prices of the second candle is nearly the same than first candle high/low forming a horizontal neckline. Statistics to prove if the On-neck pattern really works ...
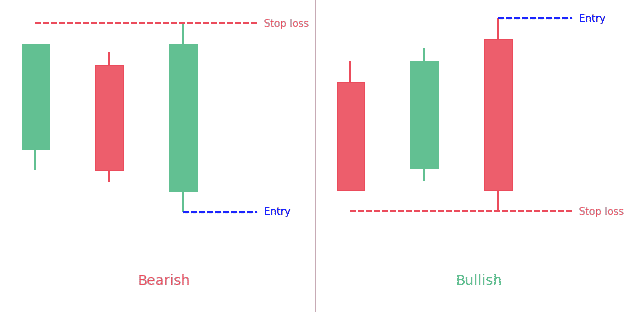
A stick sandwich is a 3-bar pattern.The closing prices of the two candlesticks that surround the opposite colored candlestick have to be the same. Statistics to prove if the Stick Sandwich pattern really works What is the Stick...
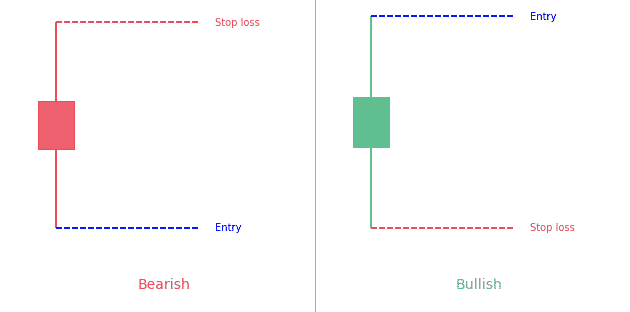
High wave is a 1-bar candlestick pattern that has very long upper and lower shadows and a small real body.It shows indecision in the market. Statistics to prove if the High Wave pattern really works A lot of candlestick traders...
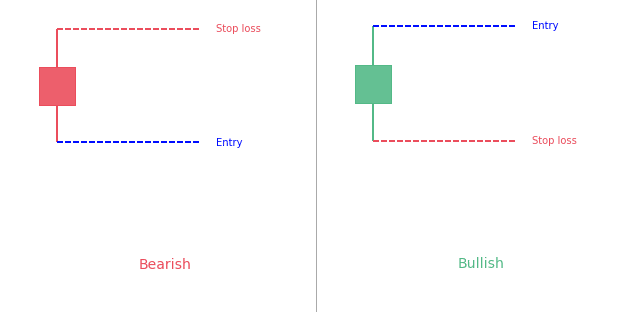
The Short Line candlestick pattern is a 1-bar very simple to understand pattern.It simply consists in a candle with a short body.There are various kind of specific variations of the short line pattern (doji, hammer, hanging man, shooting star). Let's go in-depth about...
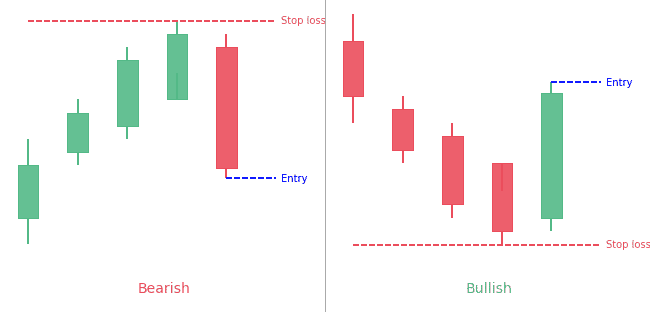
The modified Hikkake candlestick pattern is the more specific and upgraded version of the basic Hikkake pattern.The difference with the normal pattern is that the "context bar" is used prior to the inside price bar. It consists of a context bar, an inside bar, a fake...
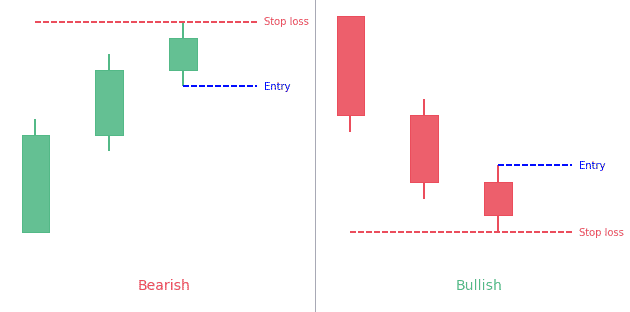
The stalled candlestick pattern is a three-bar pattern that predicts an upcoming reversal of the trend in the market. Although it is usually a bearish reversal pattern, yet there are strong possibilities that a bullish variant of the stalled pattern may also appear...

The Alternate Bat pattern is popular for incorporating the 1.13XA retracement.Firstly, an important factor is the B point retracement that must be 0.382 retracements or it must be less of the XA leg. Furthermore, it only utilizes a 2 or more BC...

The Flag pattern is a continuation pattern. Its formation is a strong sign of consolidation (price stops to trend for a while to build back momentum).It is identifiable with 3 components: the flagpole, the flag (the consolidation part) and the continuation. The flag...
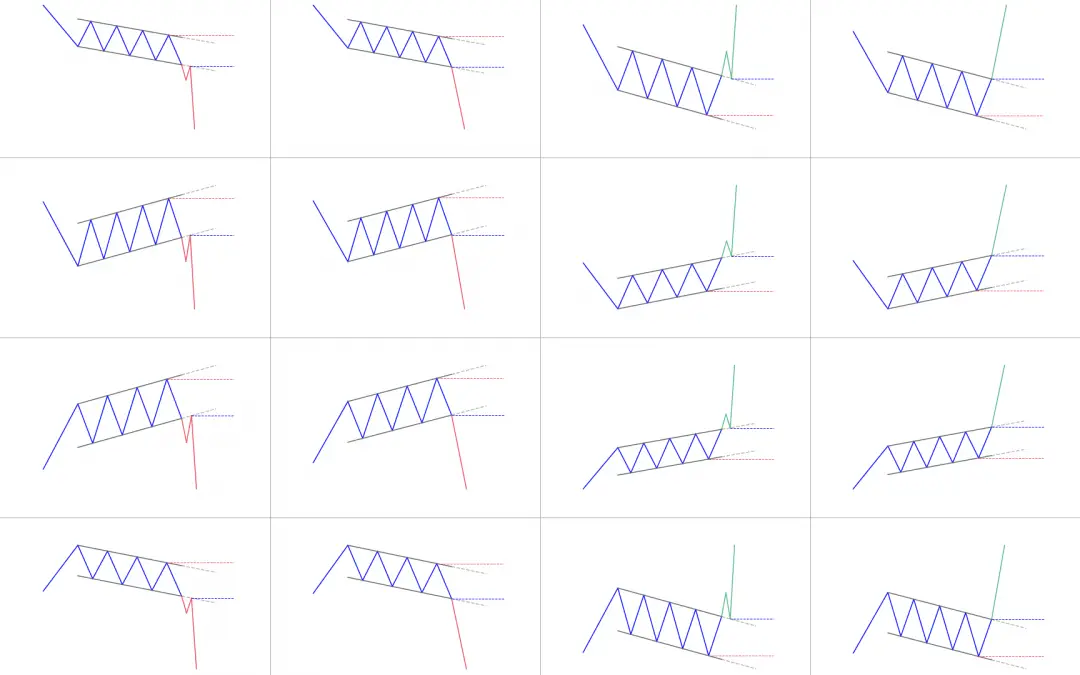
The channel pattern is a technical analysis pattern that capitalizes on the trending tendencies of the market.It is also known as price channel.This pattern appears in the market when price oscillates between two lines with the same slope.It can be a rising channel or...
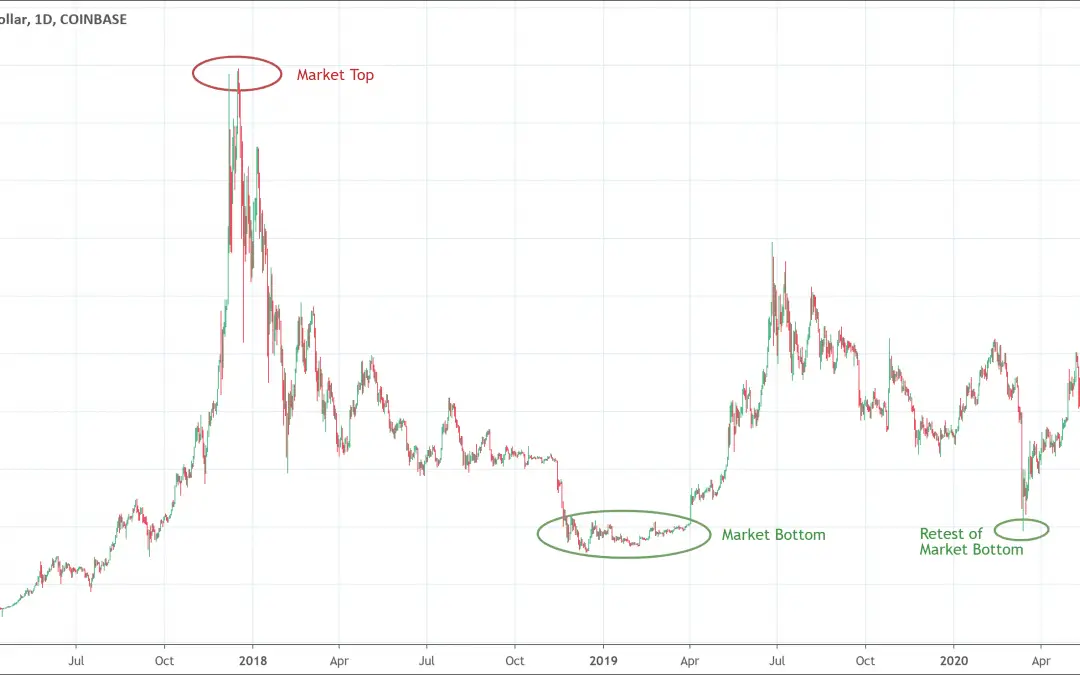
TopIt's a transition from buying pressure to selling pressure is known as the market top.It often forms a double top (price checks the previously established extreme high).BottomThe market bottom is the end of the bearish or downward trend and the beginning of a...
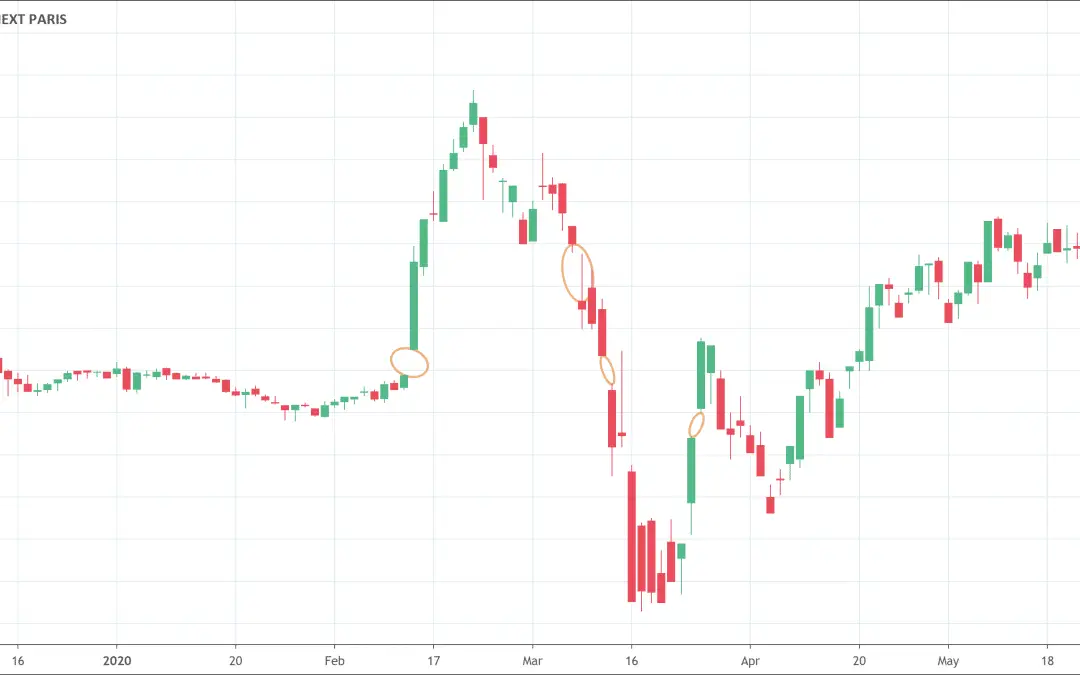
A gap appears on the technical analysis chart when there is a unfilled area. It shows there was no trading activity in that area.It happens when price closes at a level and open at a different level (higher or lower).There are different types of gaps: breakaway gap,...
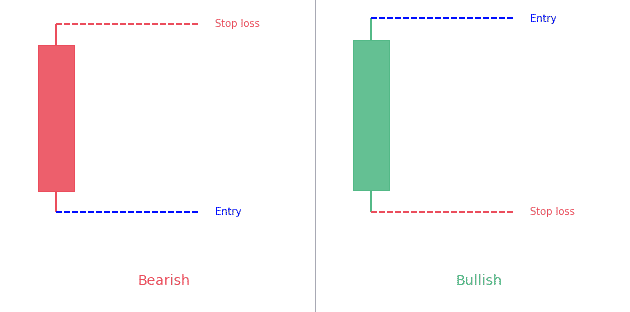
The Long Line candlestick pattern is a 1-bar pattern.It simply consists of a long body candle.It can be bearish or bullish. What is a long line candle? Candlesticks provide different visual hints on the trading charts for a better and easy understanding of the...
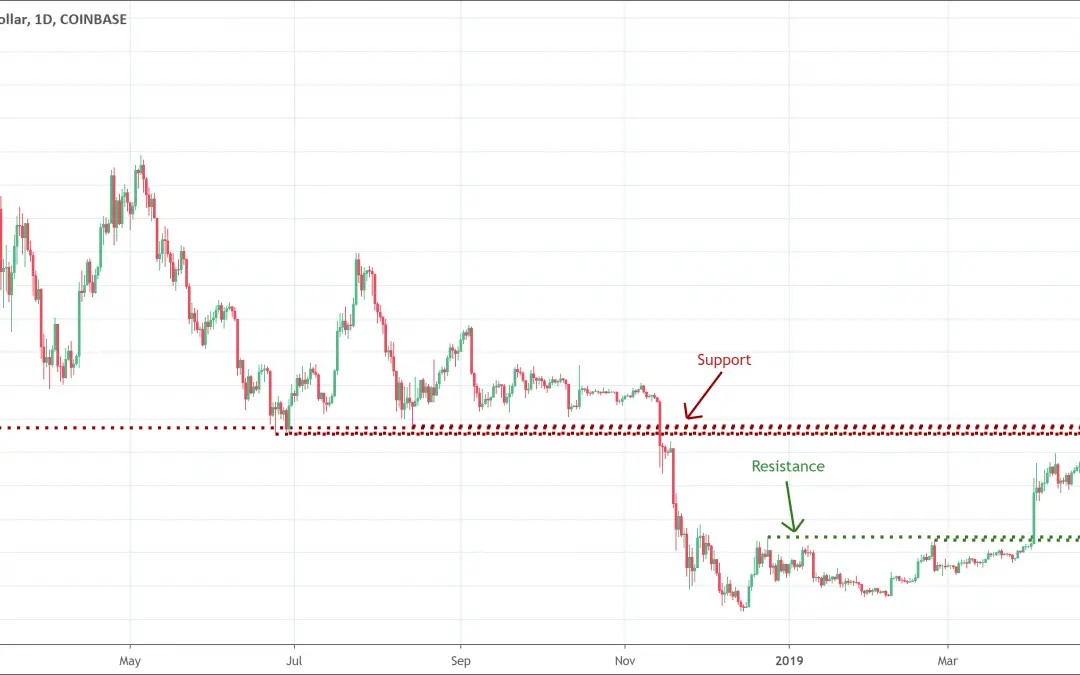
Support and resistance levels represent areas where we can anticipate a price reaction of an asset.Prices regularly stop falling and bounce back up at the support level.Prices stop rising and take a dip back at the resistance level. Support and resistance concept is...
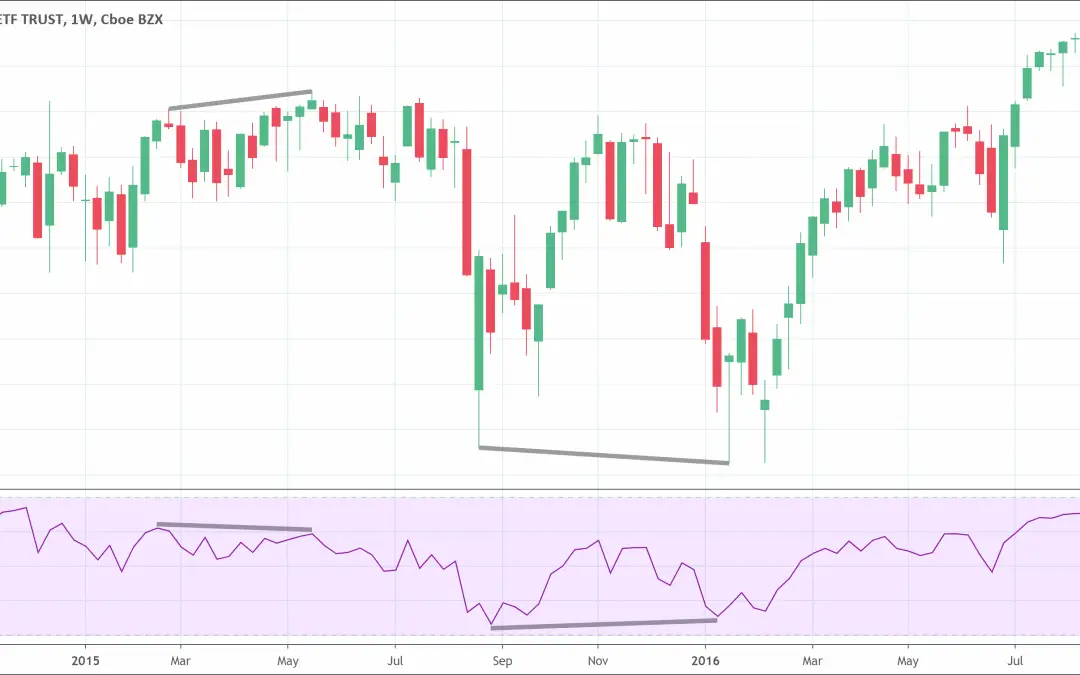
Divergences occur in the market when price doesn't move in the same way as an indicator.If price makes a new high/low but the indicator does not, it creates a divergence.It helps traders spot moments where price move is not a strong/weak as it looks to be.It is a...
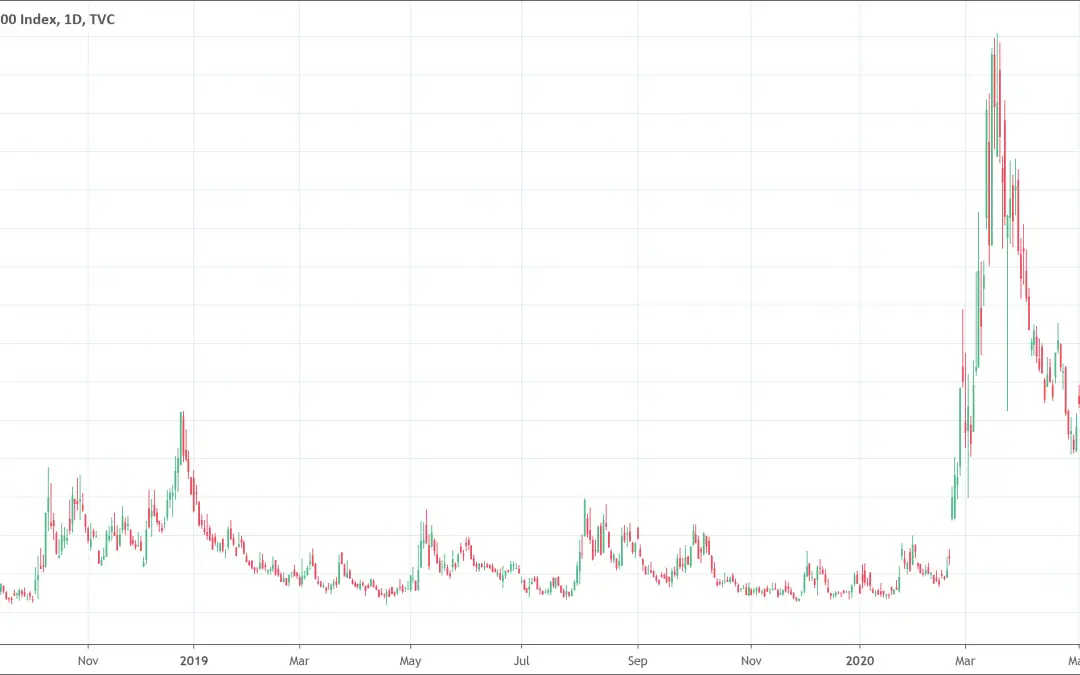
Implied volatility (IV) is a measure that helps traders to understand the chances of changes in the prices of a given security.In options, IV is the underlying instrument’s volatility. Implied Volatility? What is it? Implied volatility (IV) is a measure that helps...
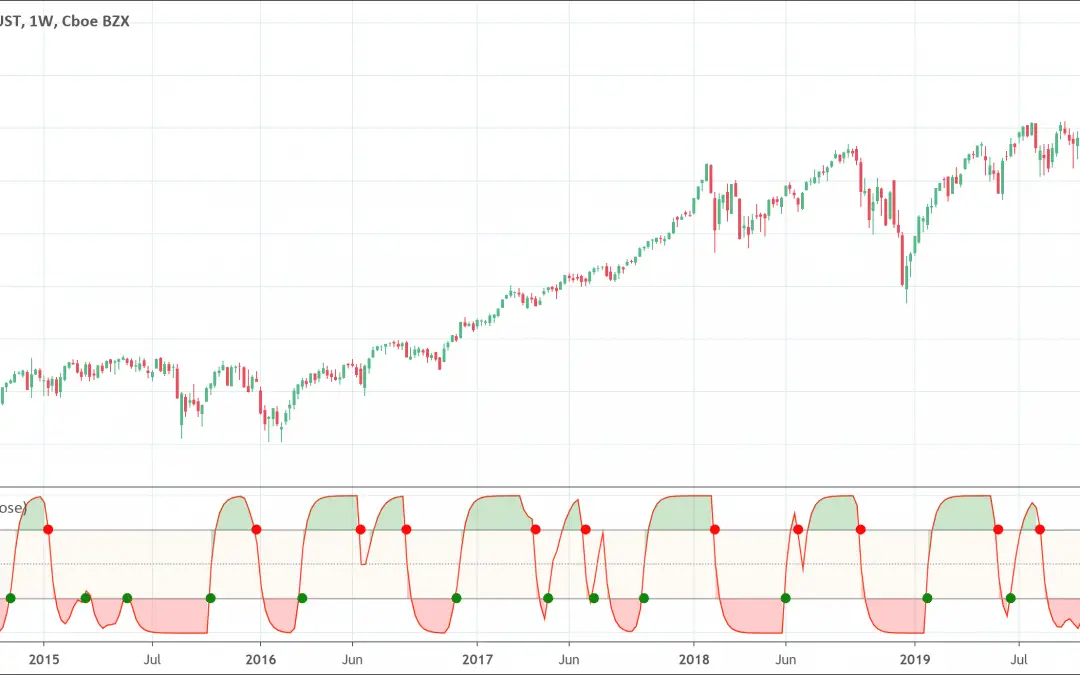
The Schaff Trend Cycle (STC) indicator is an oscillator.It helps to identify the market trends with improved speed and accuracy. The Schaff Trend Cycle (STC) indicator is an oscillator indicator that helps to identify the market trends with improved speed and...
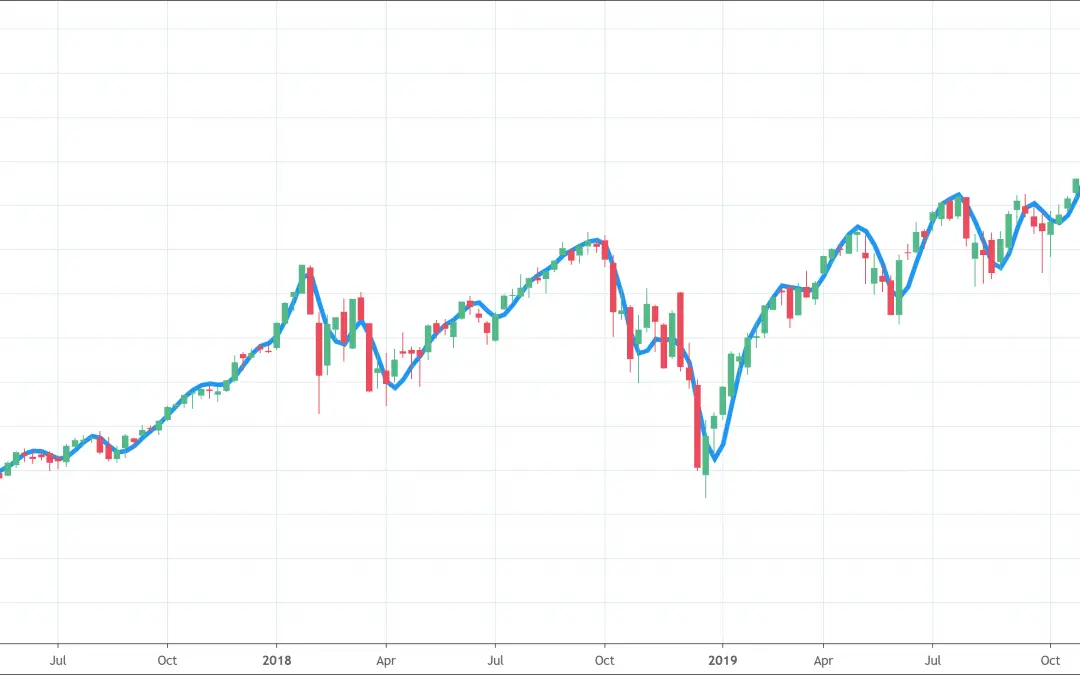
The Hull moving average indicator or HMA indicator helps to identify the current trend in the market.It is an extremely fast and smooth moving average. The Hull moving average indicator or HMA indicator helps to identify the current trend in the market. Allan Hill...
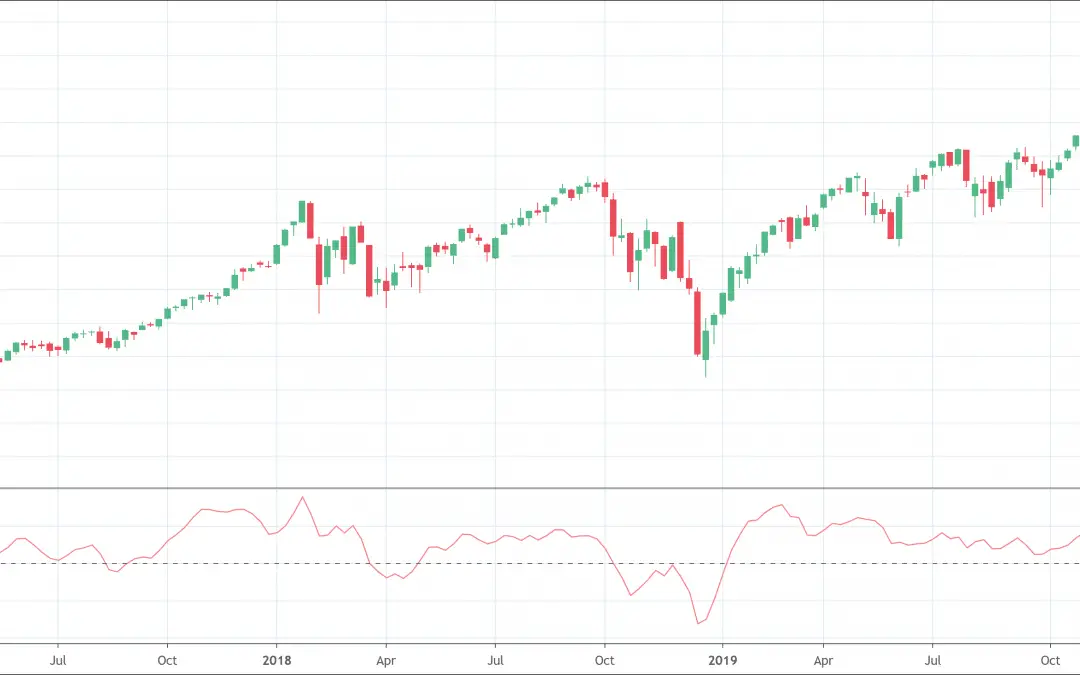
The Chaikin oscillator measures the Accumulation/Distribution Line of MACD.A cross above the ADL indicates that investors are accumulating (buying). Price follows volume, based on an old investing axiom. When traders buy a large number of shares of a stock that appear...
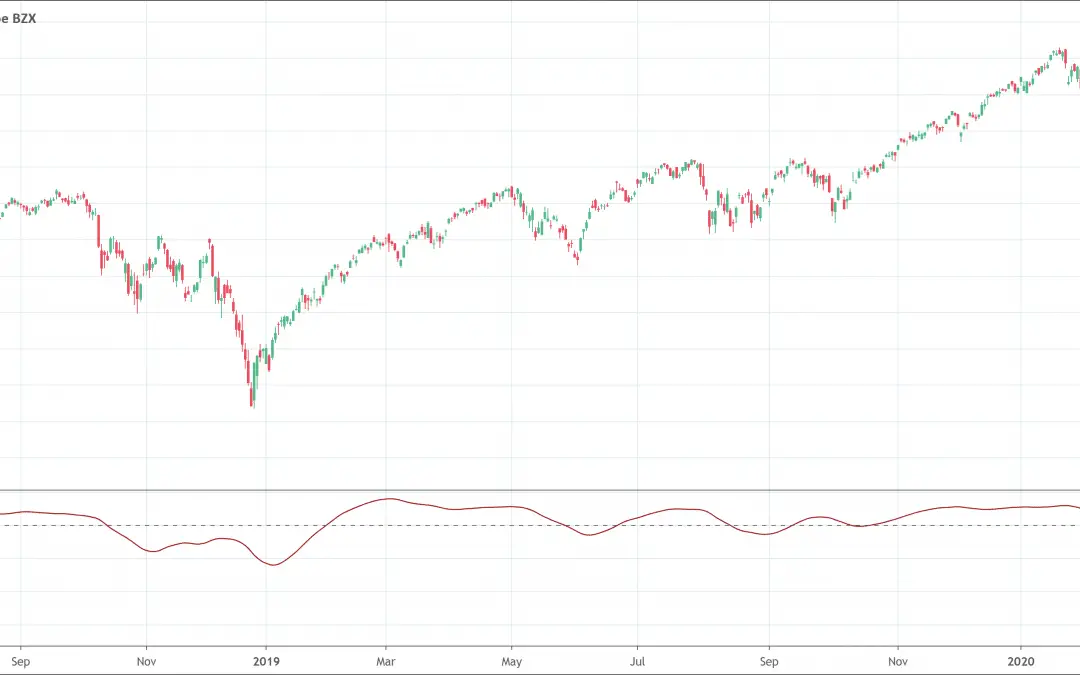
The Triple Exponential Moving Average (TRIX) helps investors determine the price momentum and identify oversold and overbought signals in a financial asset.It is composed of 3 main components: Zero line, TRIX line, Percentage Scale What is the TRIX Indicator? The...
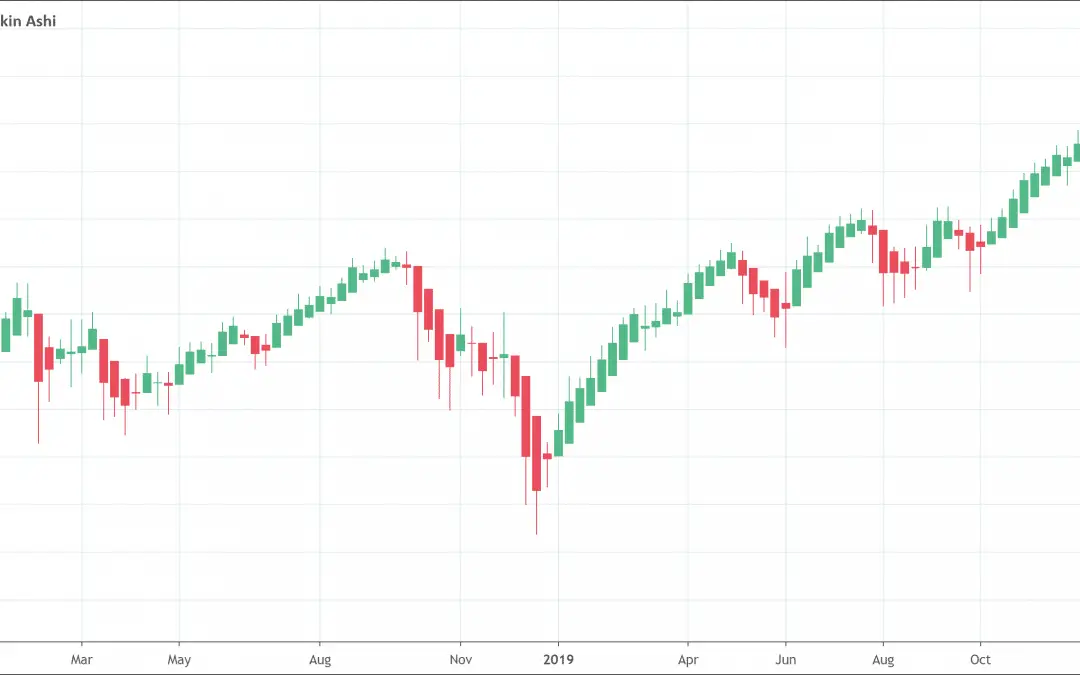
The Heikin-Ashi chart helps traders filter out market noise.Rather than using the open, high, low, and close like standard candlestick charts, this technique uses a modified formula based on two-period averages.Traders use the Heikin Ashi technique traders to easily...
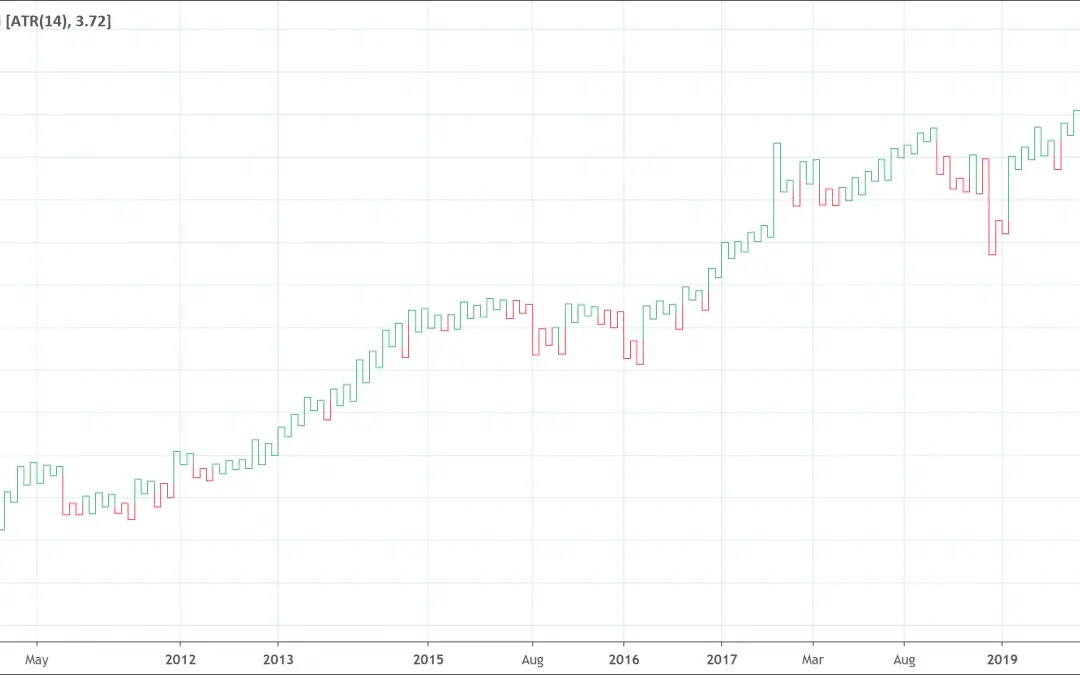
Kagi chart is a kind of chart that tracks the price movements of a security. While price and time appear on traditional charts, with Kagi charts, only the price is important.A Kagi chart plots price like a snake, continuously. When the price falls, the line appears...
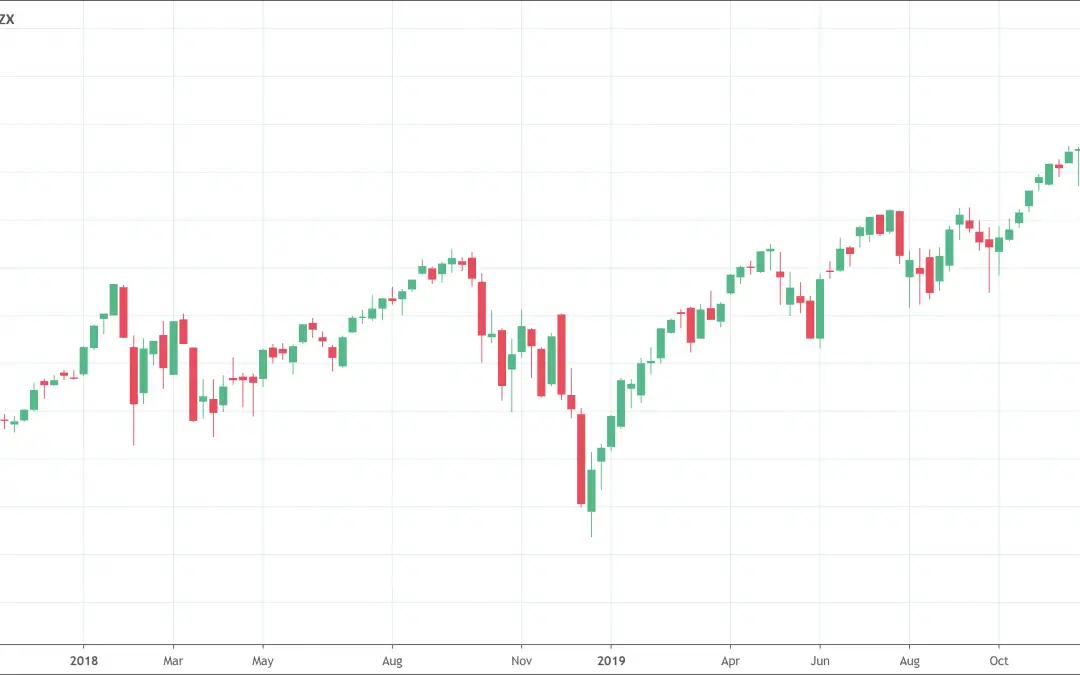
Candlestick charts are very popular.It shows 4 prices for every fixed period:Open priceClose priceHighest price for the sessionLowest price traded during the sessionTraders use the candlestick chart to determine where price is heading based on previous patterns. What...
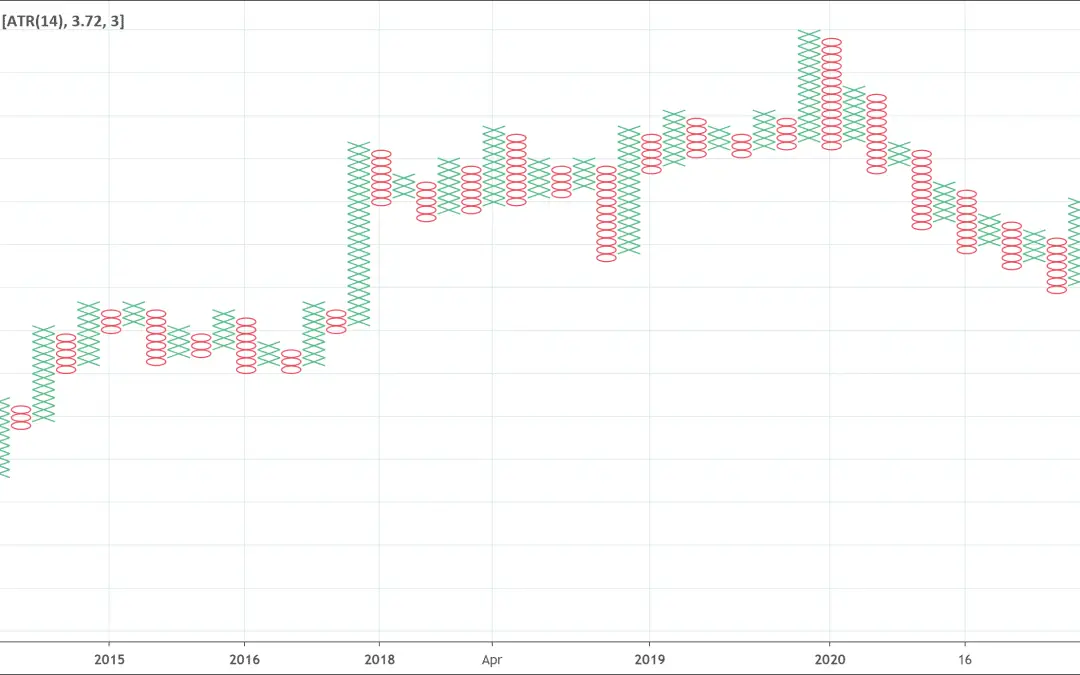
If the price of an asset moves up by a certain amount, then it will form an X.If the price of an asset moves down by a certain amount, then it will form an O. Xs and Os stack on top of each other, and will often form a series of Xs or Os. The size of the box is...
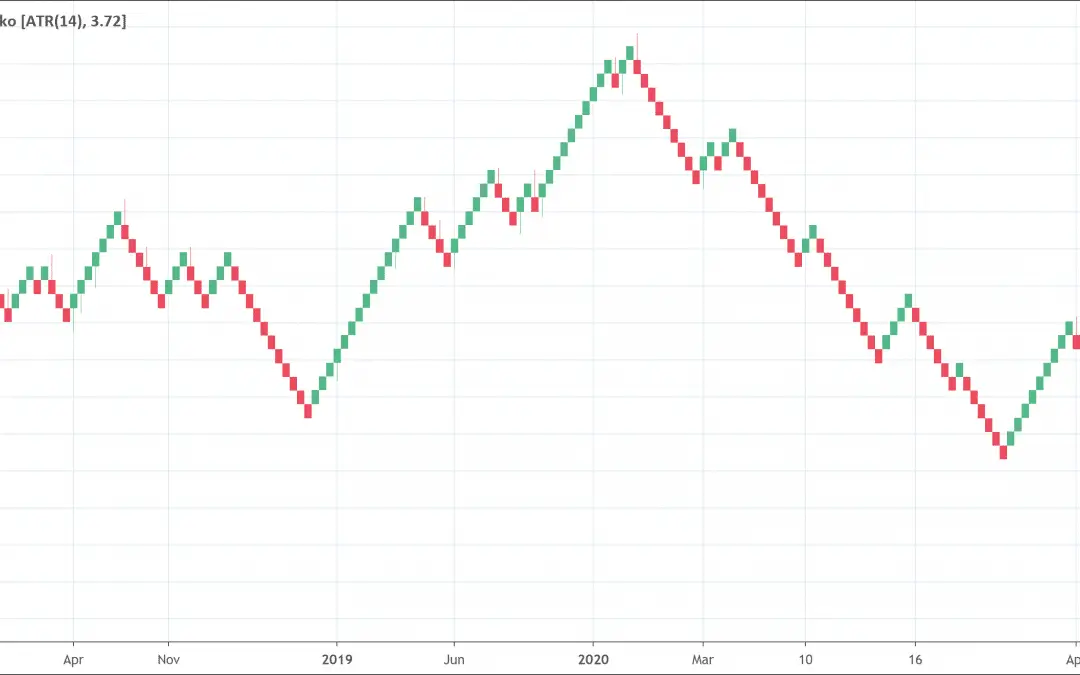
Charts are important in forex trading. It is possible to effectively trade forex today without using a chart. One of the most popular forex charting styles is the Japanese chart, Renko. Renko charts are great in analyzing the market from a completely different point...
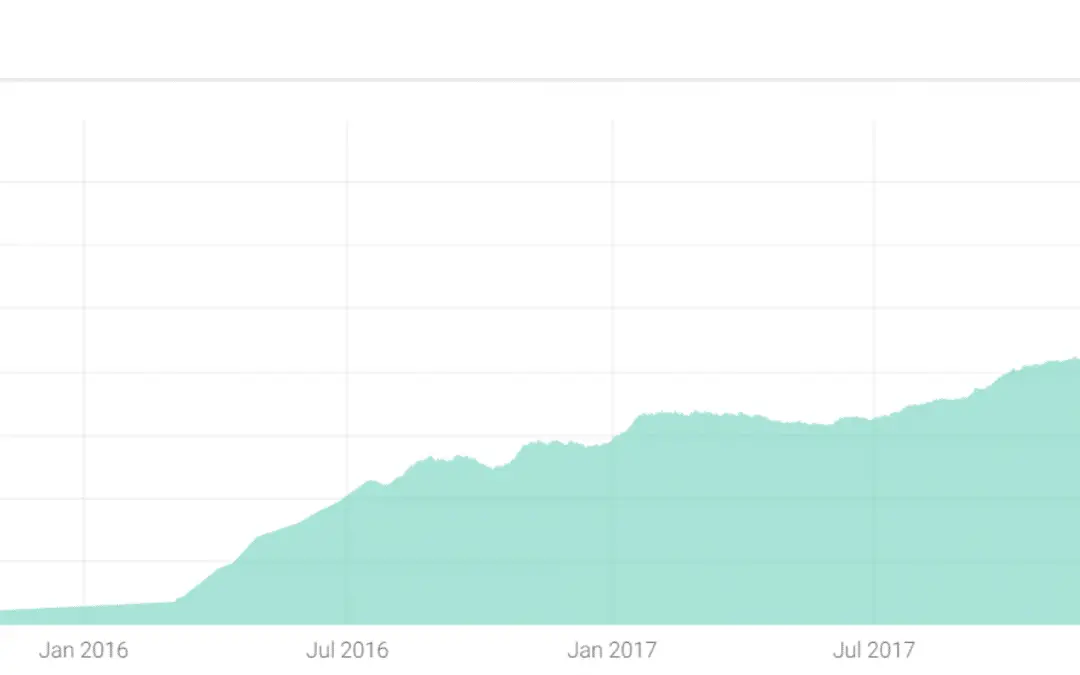
Backtesting is a simulation of the past. You take the data from the past and use it to predict what would have happened if you had used a certain trading strategy.A trading system is a set of rules that tells you when to buy and sell. A backtest is a way to see if the...
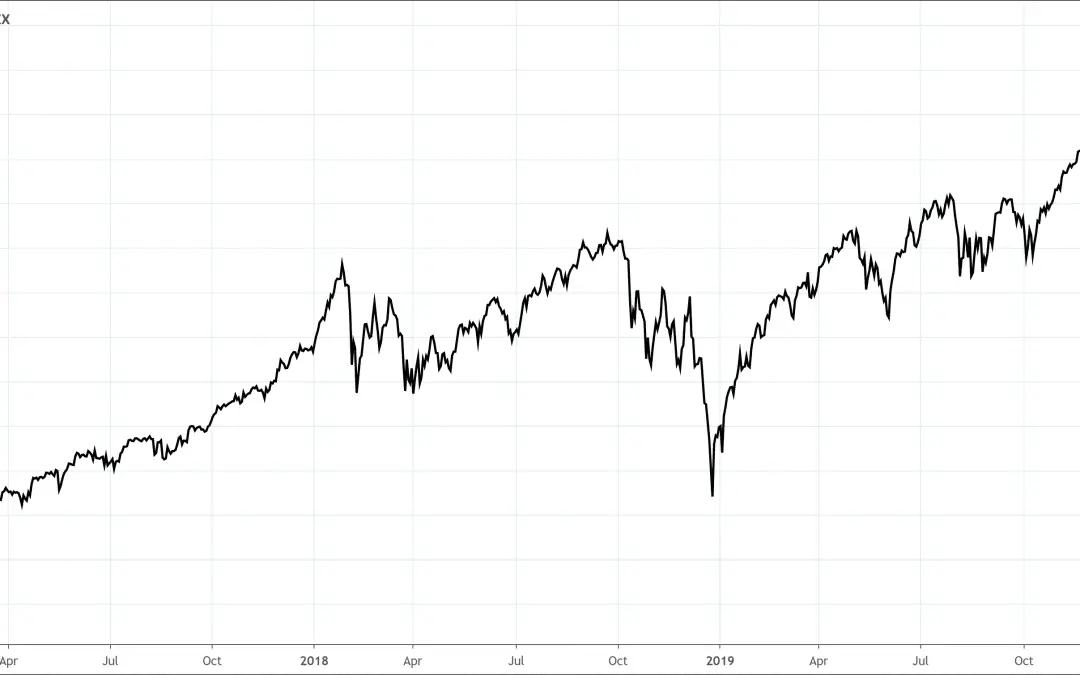
A line chart is the simplest and most basic type of stock chart used to analyze financial markets.The line chart only plots the closing price of the underlying security.It has a line connecting the dots created by the close price. A line chart is the simplest and most...
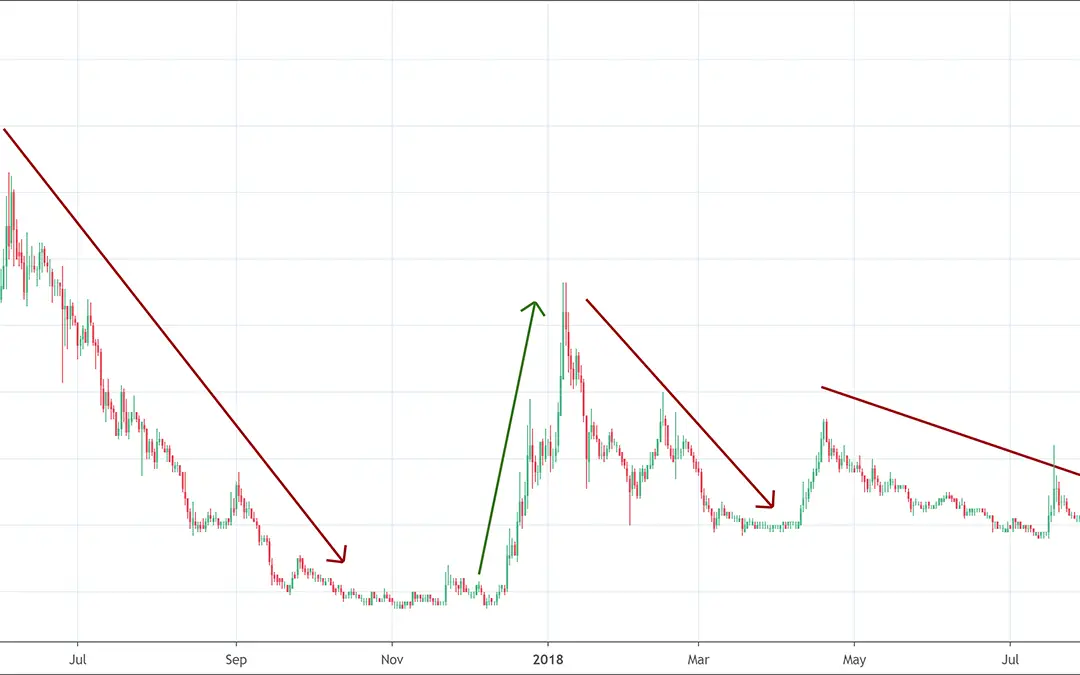
Trend trading, also known as trend following, is a trading strategy based on the assumption that the current trend is likely to continue and the stock will also move in the same direction.There are three types of trend: uptrend, downtrend and sideway.An uptrend is...
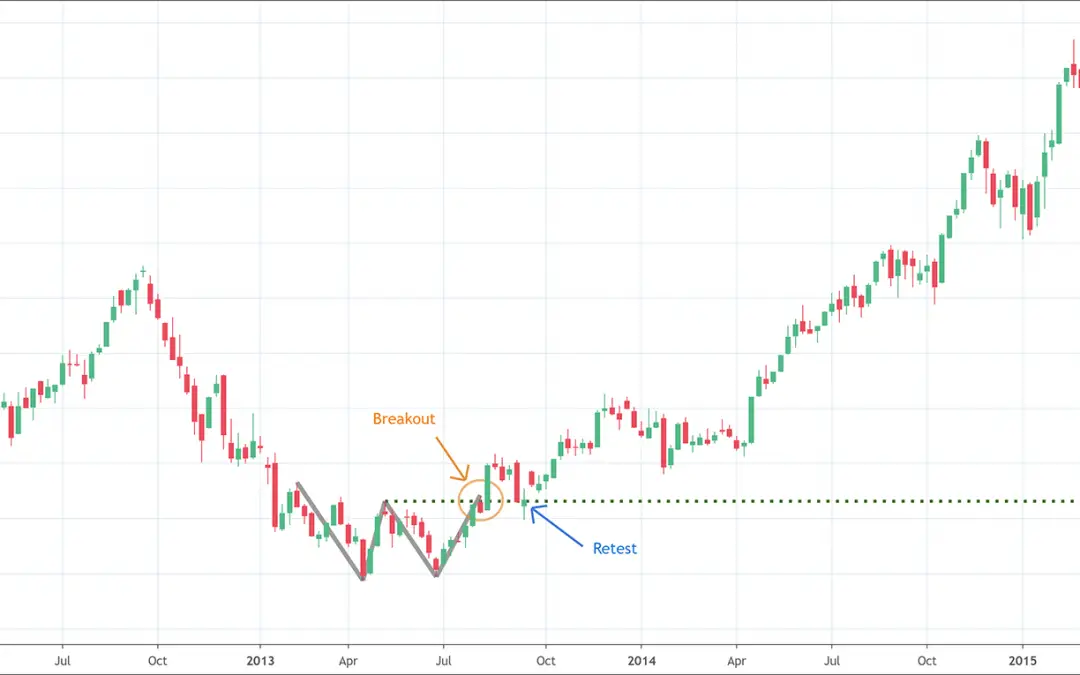
Breakout are trade opportunity which trigger when price crosses above or below a resistance or support level.It signals it can be time to open a position. It also helps frame where you should / could place your stop loss. What is a breakout? Breakout in trading means...
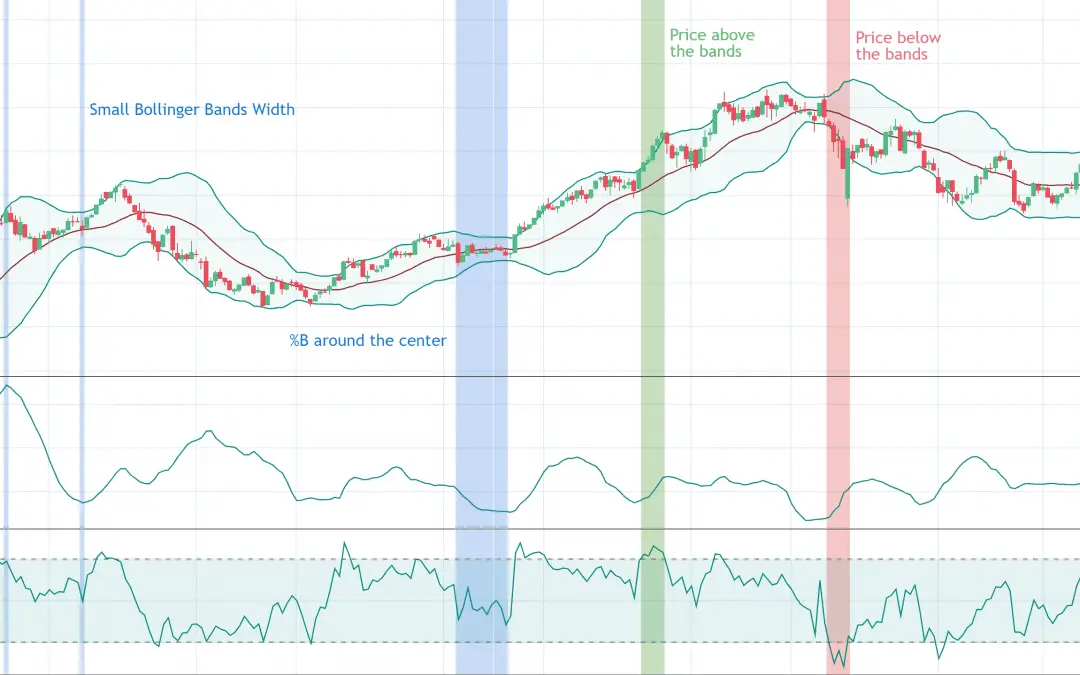
Both the Bollinger Bands Width and the Bollinger Bands %B are indicators based on the Bollinger Bands.The Bollinger Bands Width indicator shows the width of the bands (how wide they are at any moment).The Bollinger Bands %B indicator shows the relative position of the...
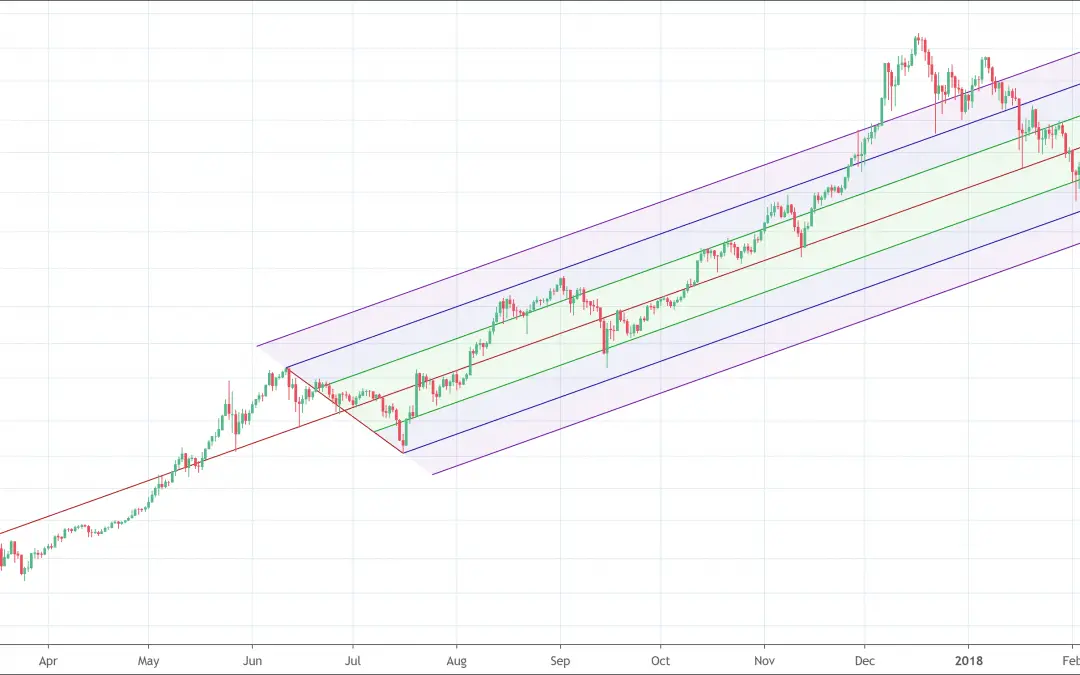
Andrew's pitchfork uses three points to create a channel.Pitchfork lines act a resistance and support for the price.Pitchfork's drawing is subject to personnal taste and can be controversial among traders Andrew's Pitchfork, also known as the International Line Study,...
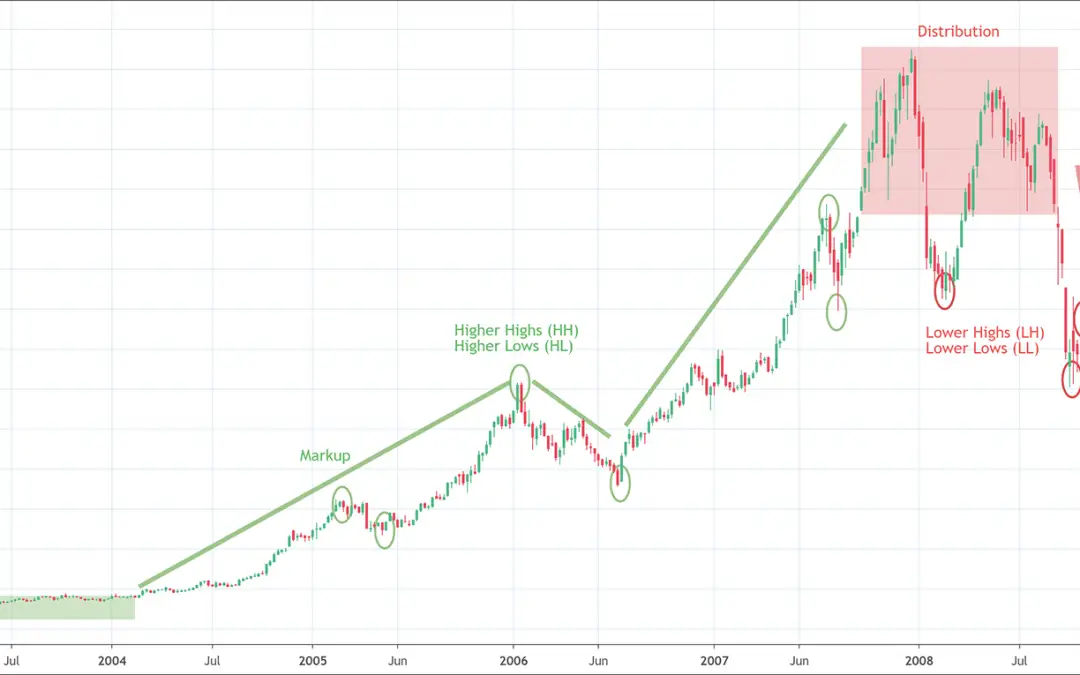
Wyckoff's method or Wyckoff's theory is one of the most complete and valuable trading theory. Wyckoff's theory helps trader understand major market swings (accumulation, distribution phases).Despite all the limitations of the Wyckoff's method, no one can deny the fact...
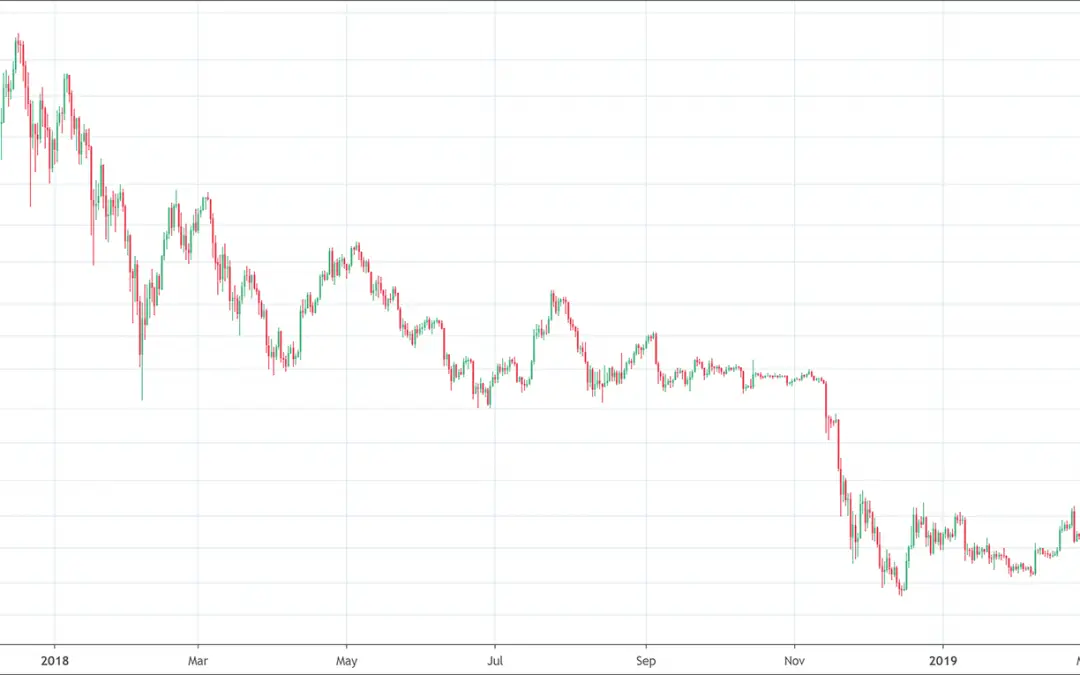
When talking about Price Action, traders often refer to the up and down movements of a security's price.Price action is what creates technical analysis formation and chart patterns.Most indicators also are calculated out of price action. The price of a financial asset...
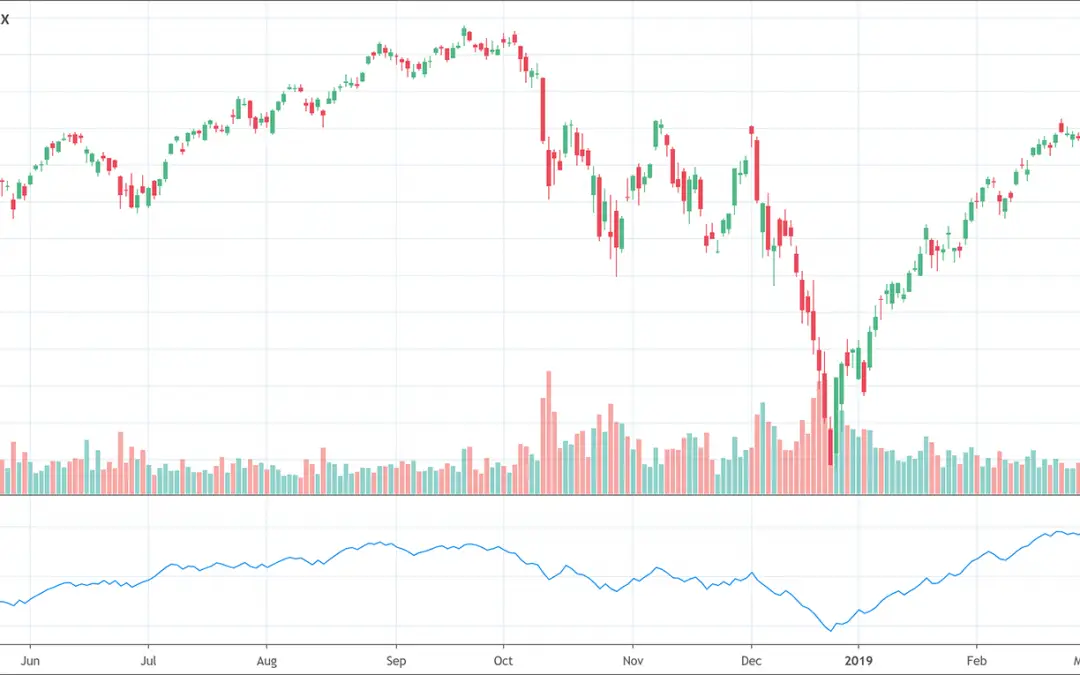
The advance/decline (A/D) line is a breadth indicator that plots the difference between advancing stocks and declining stocks.A/D line should move in the same direction as major indexes to confirm the move.If it doesn't, it's a sign the rally or decline is nearing its...
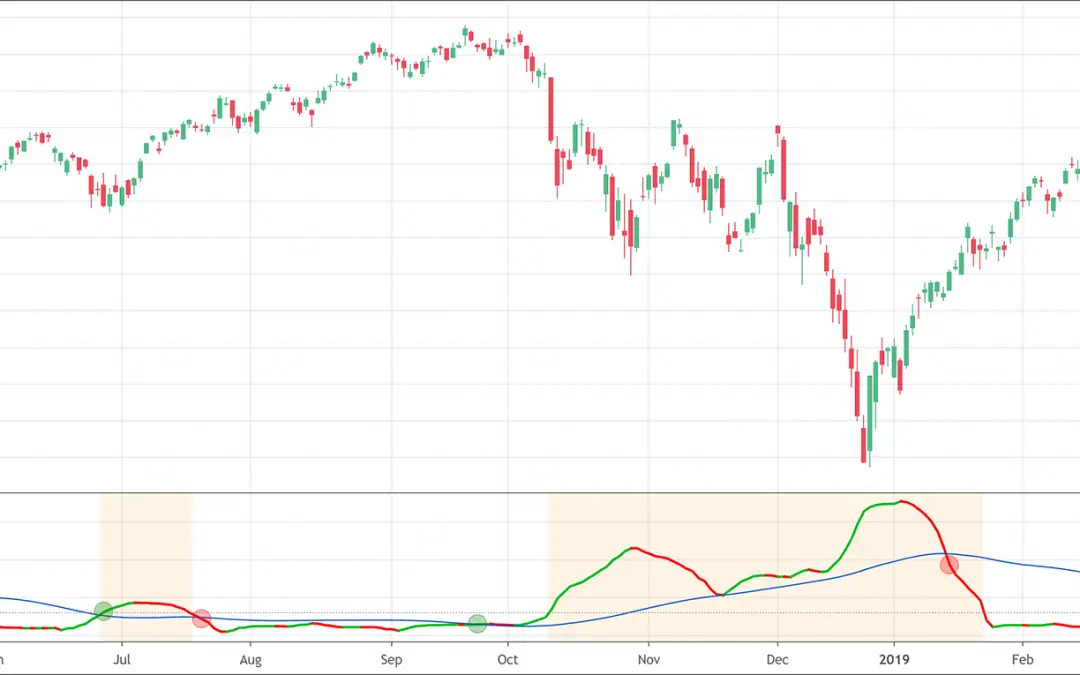
The Ulcer Index indicator is a technical analysis tool that measures the downside risk considering both main factors, the depth and the duration of price fall.It is a 3-step calculation. The Ulcer Index (UI) indicator bases on the idea of Ulcer disease. An ulcer is...
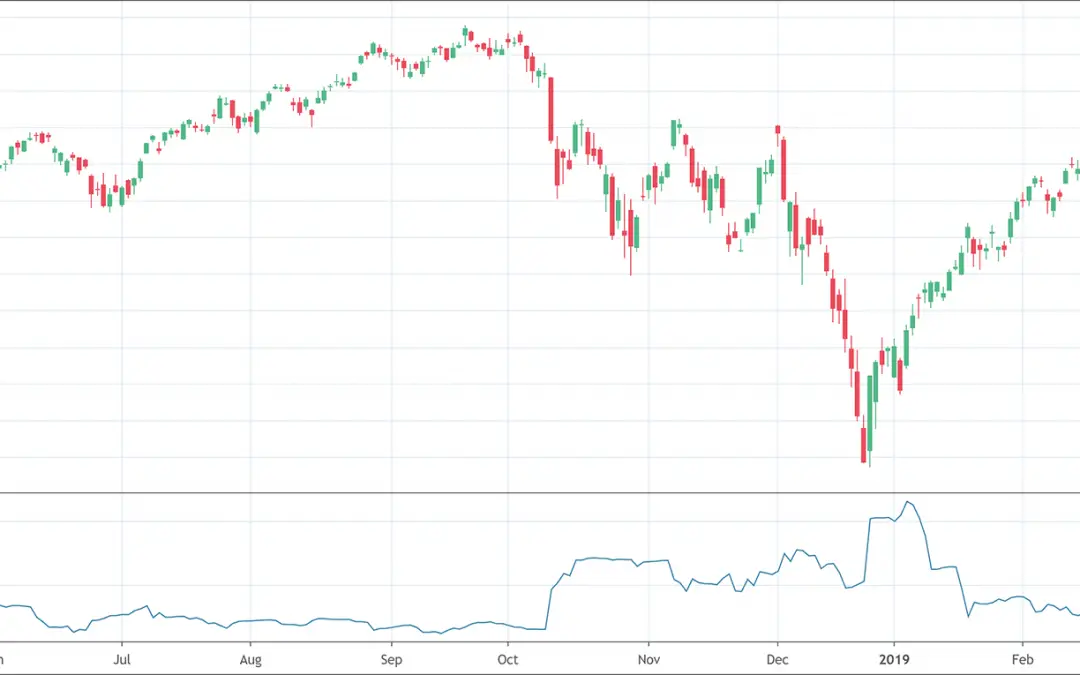
Historical Volatility is a measure of movements of prices over a specified period of time.It deals with measuring the level of price fluctuations of stock prices from its average price over a specified period of time.It helps trader quantify how volatile a stock is...
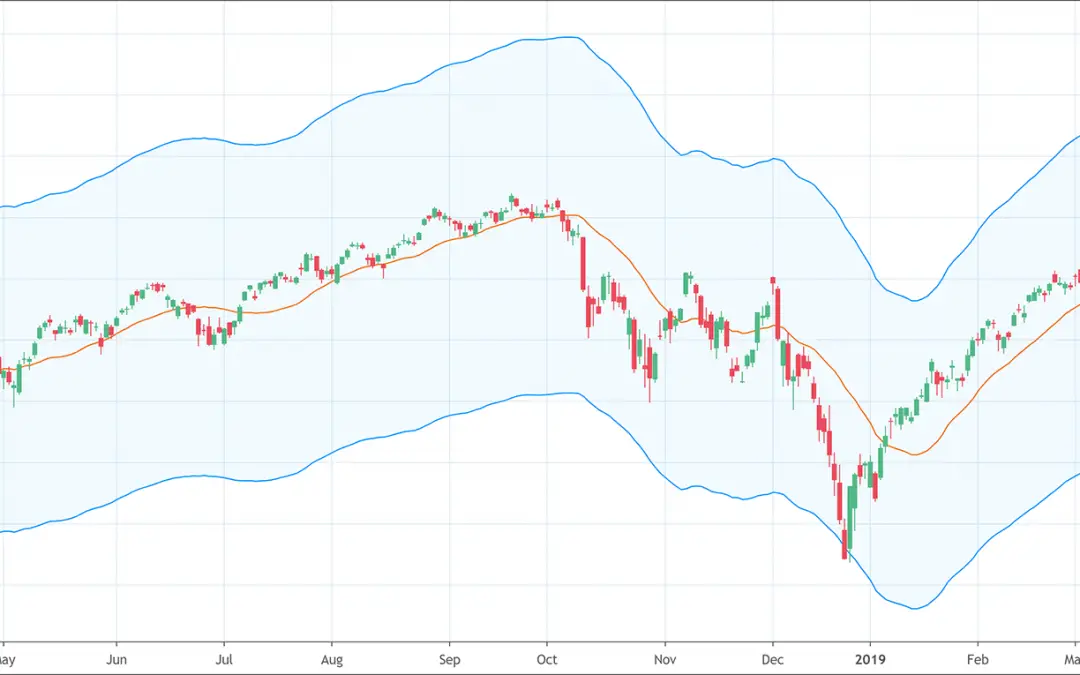
An envelope refers to two lines plotted above and below a security's price.It is drawn by drawing a Simple Moving Average and 2 SMA around it at a fixed distance. The Envelope or envelope channel indicator is a technical analysis tool. It helps to spot the upper and...
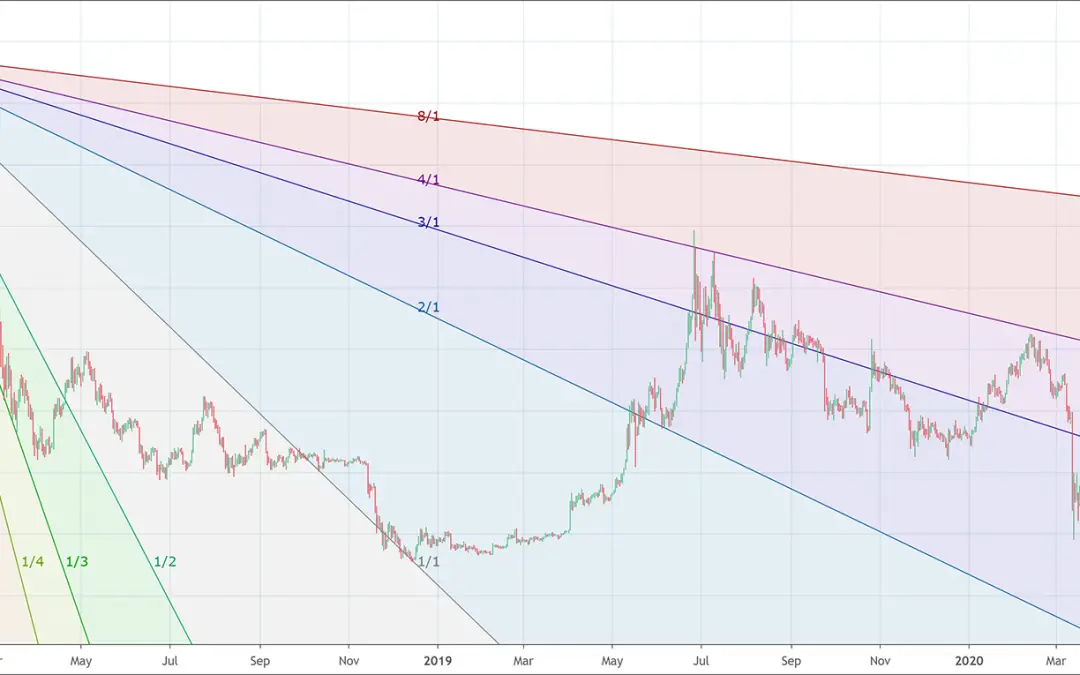
As its name suggests, W.D. Gann developped the Gann FanThe Gann Fan is composed of a serie of lines following specific angles.Traders draw the Fan from a low or high points and line are seen as future potential support and resistance lines. Have you ever wondered...
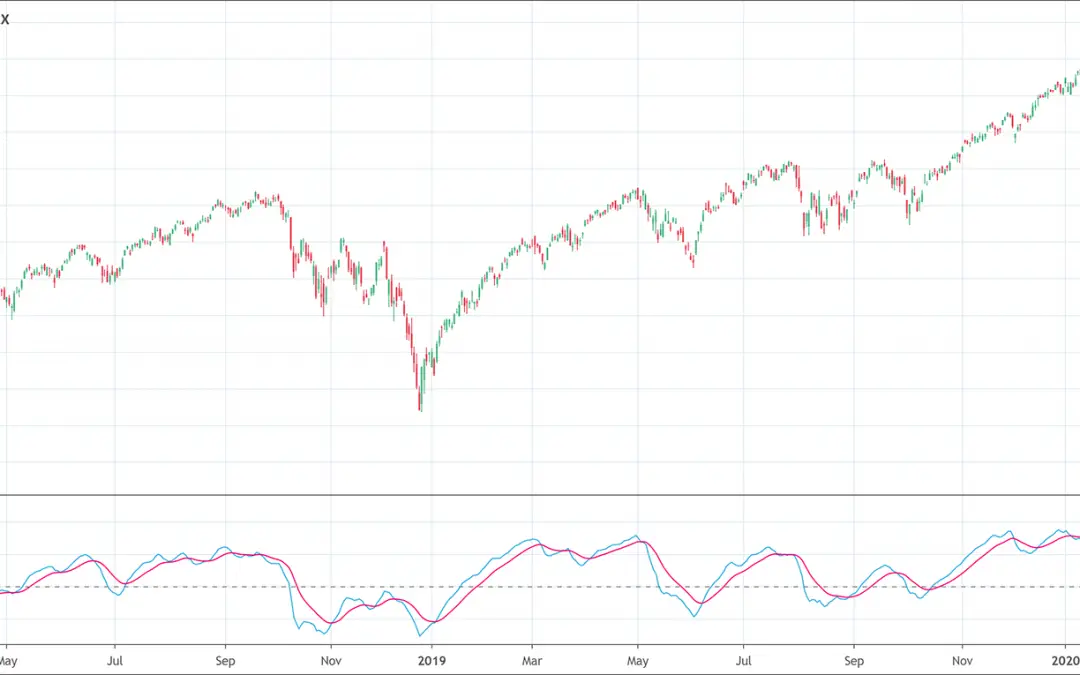
The True Strength Index (TSI) is a very popular and widely used momentum oscillator.It helps traders determine the trend and overbought/oversold market conditions. True Strength Index (TSI) is a very popular and widely used momentum oscillator that helps to determine...
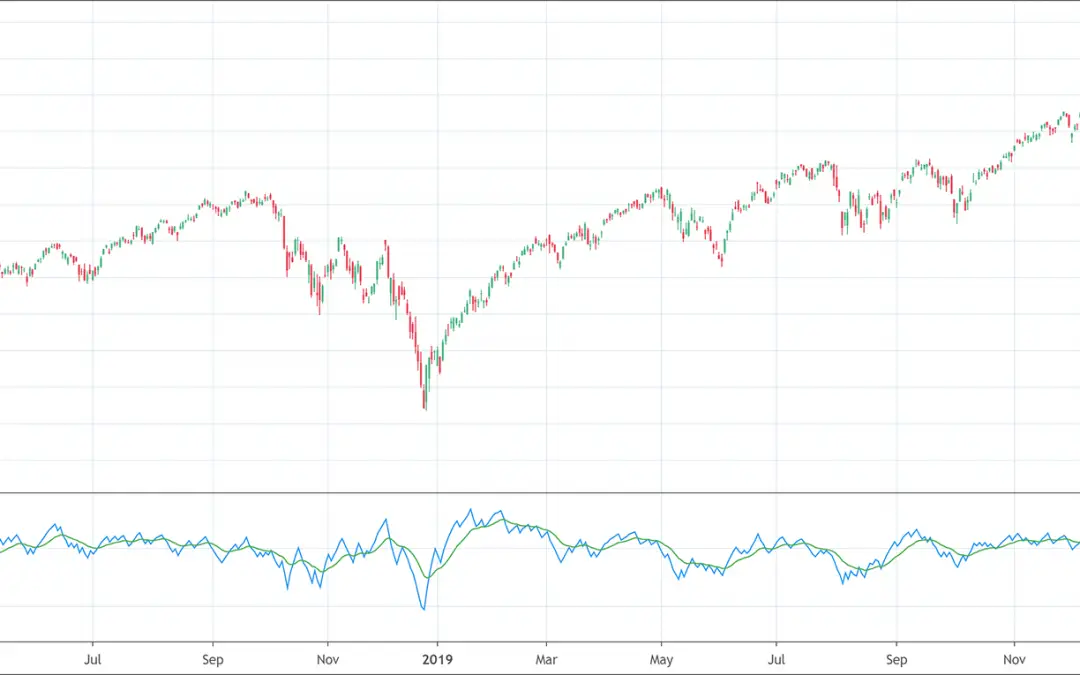
The Klinger volume oscillator is a volume-based indicator.It identifies long-term trends of money flow of a particular security. The Klinger volume oscillator is a volume-based indicator that functions to identify long-term trends of money flow of a particular...
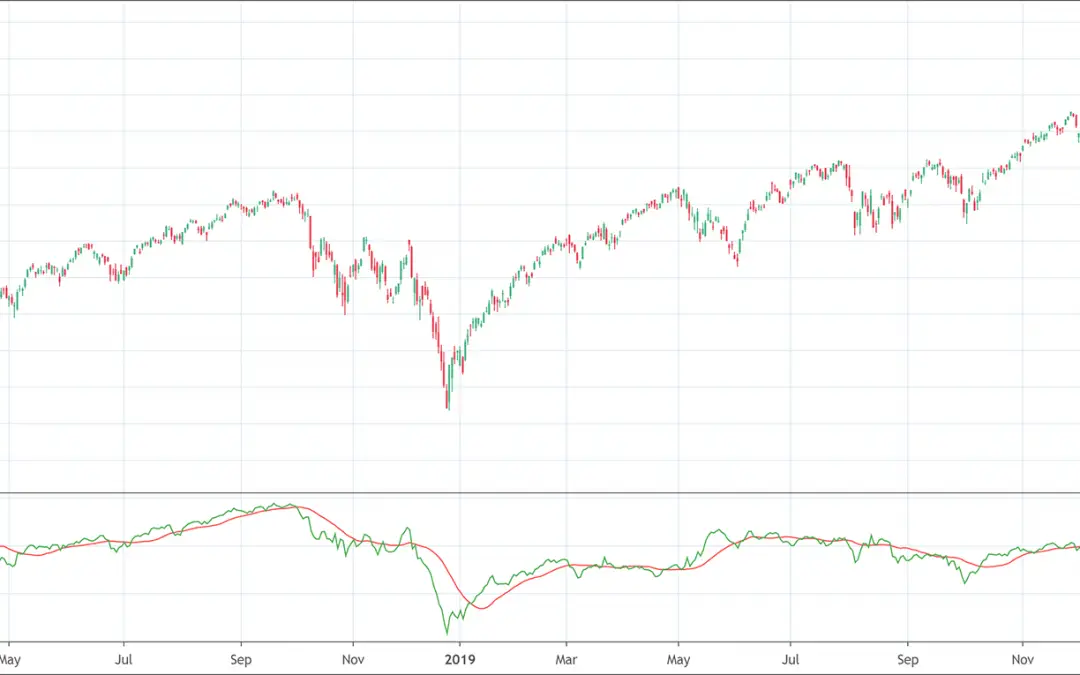
The smart money flow index or smart money index is an indicator. It measures the sentiment of the investors in the market. The smart money flow index or smart money index is an indicator. It measures the sentiment of the investors in the market. Don Hays, a money...
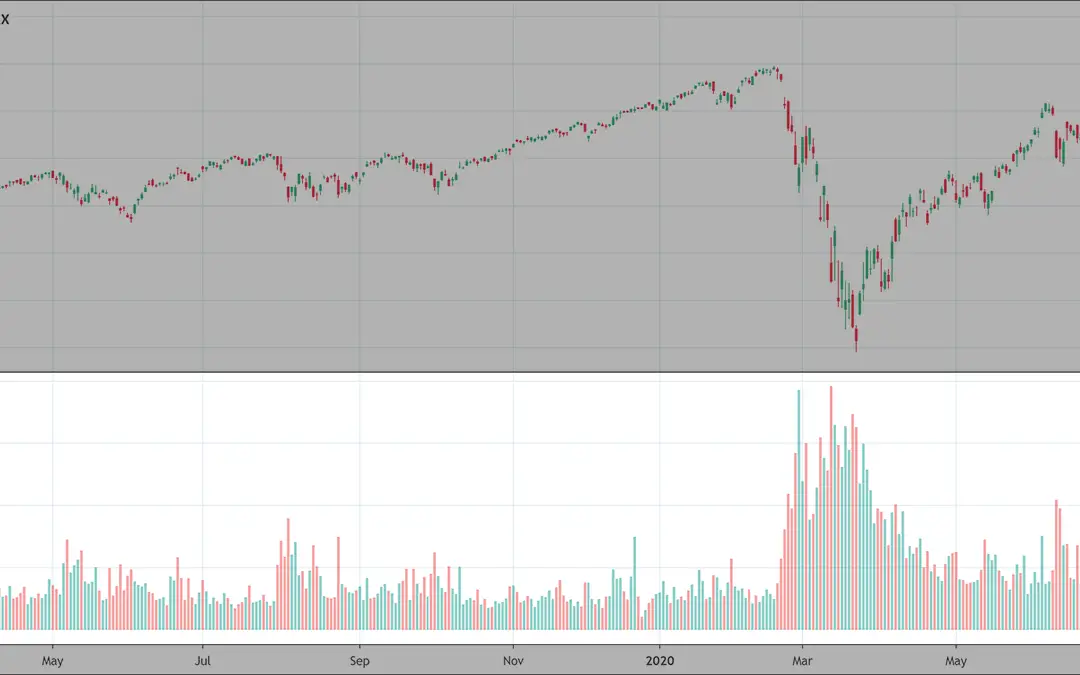
Trading volume or volume of trade is a measure of completed trades in a particular security in a given period of time.It is a measure of two very important factors: market activity and liquidity.The higher the trading volume during a price move, the more significant...
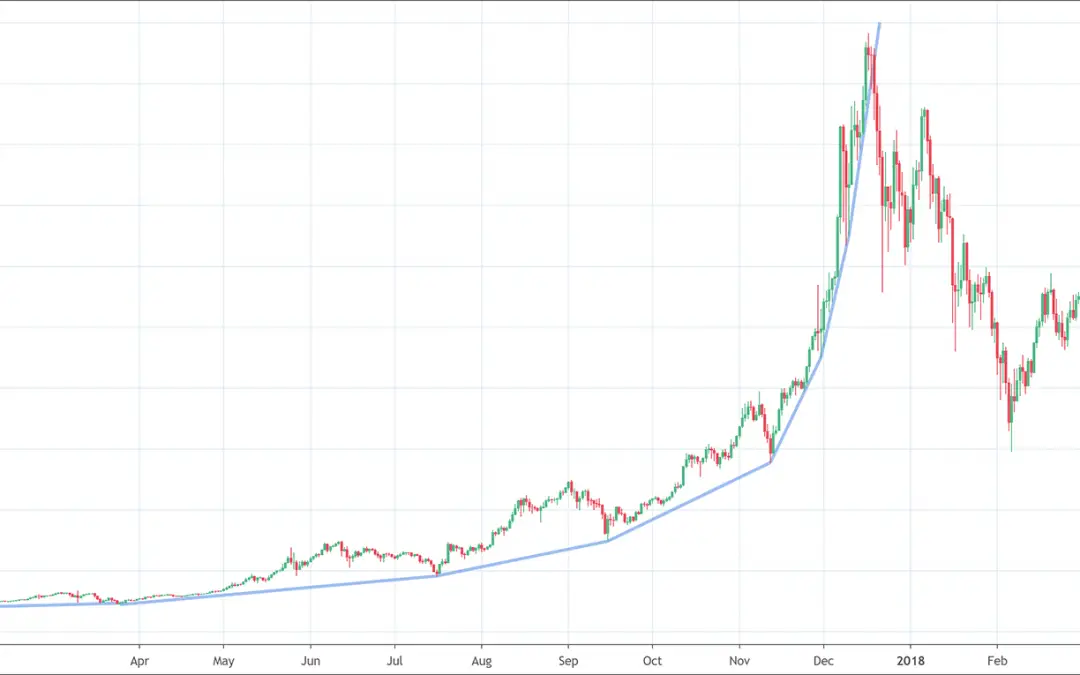
The Parabolic curve pattern is a curved trend line looking like an arc, or an elliptical shape.It appears when price accelerate its rise. The more it rises, the quicker it rises.This growth is often not sustainable so price often dumps when it breaks the parabolic...
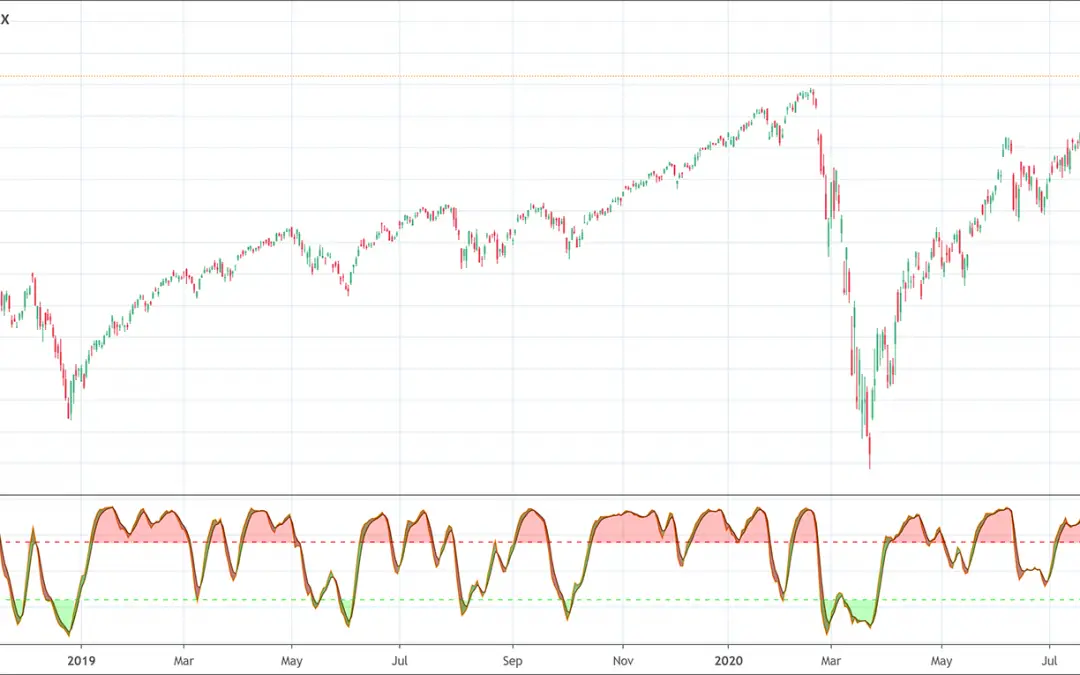
The Stochastic Momentum Index (SMI) is based in the Stochastic Oscillator.The SMI show the distance between the closing price and the center of each candles high/low range.It ranges between -100 and 100. William Blau developed the stochastic momentum index (SMI)...
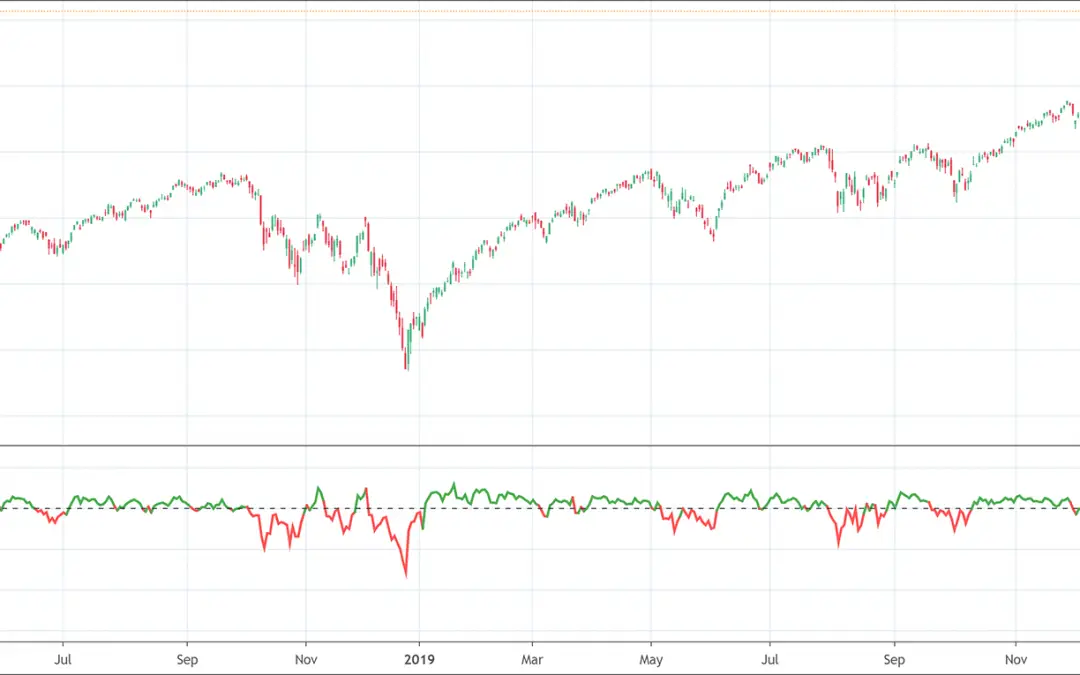
The Disparity Index is a momentum indicator.It shows which direction a security is heading compared to a moving average.Big moves can hint for a price correction (it acts like a overbought/oversold situation). Disparity index (DI) indicator is a technical momentum...
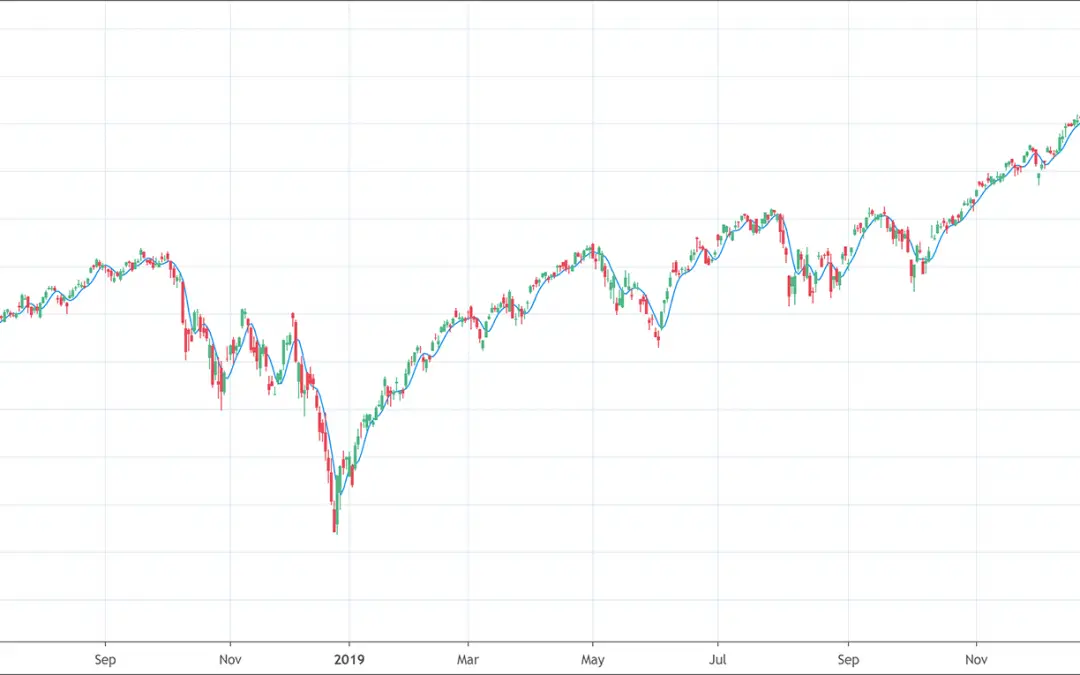
The Arnaud Legoux moving average (ALMA) indicator filters out noise from the market to help the trend stand out.It uses Moving Averages to filter minor variations from the price. Arnaud Legoux moving average (ALMA) indicator is a technical analysis tool that...
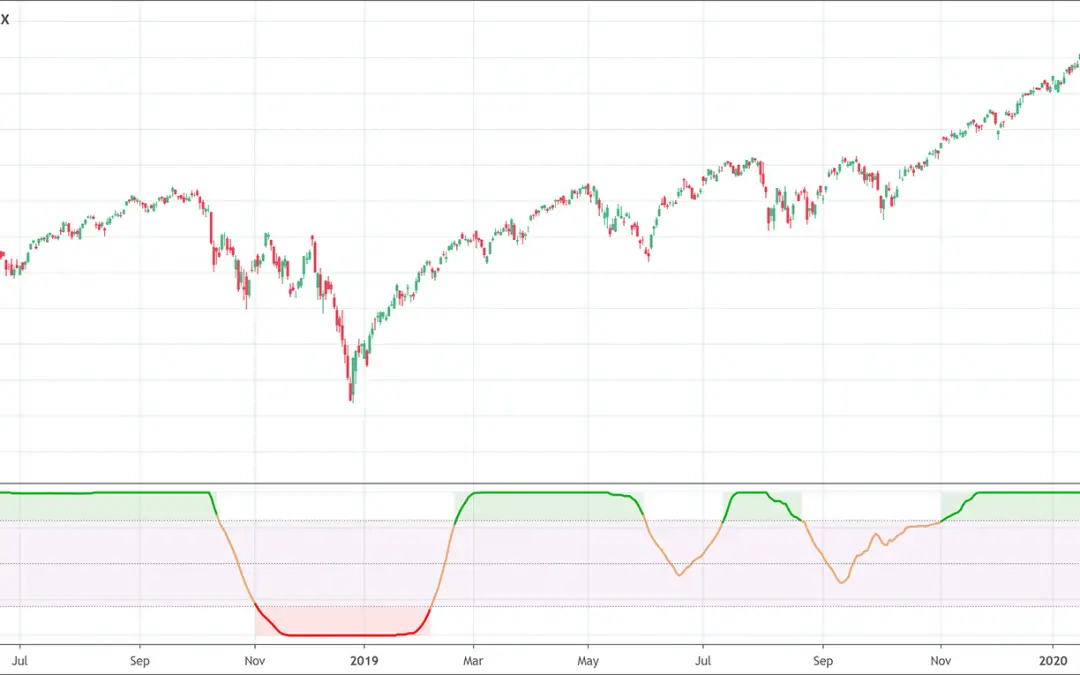
The Trend intensity index (TII) indicator measures the strength of a trend in the market.It compares the price of the last 30 days to the 60-day moving average. M.H. Pee developed the Trend intensity index (TII) indicator to measure the strength of a trend in the...
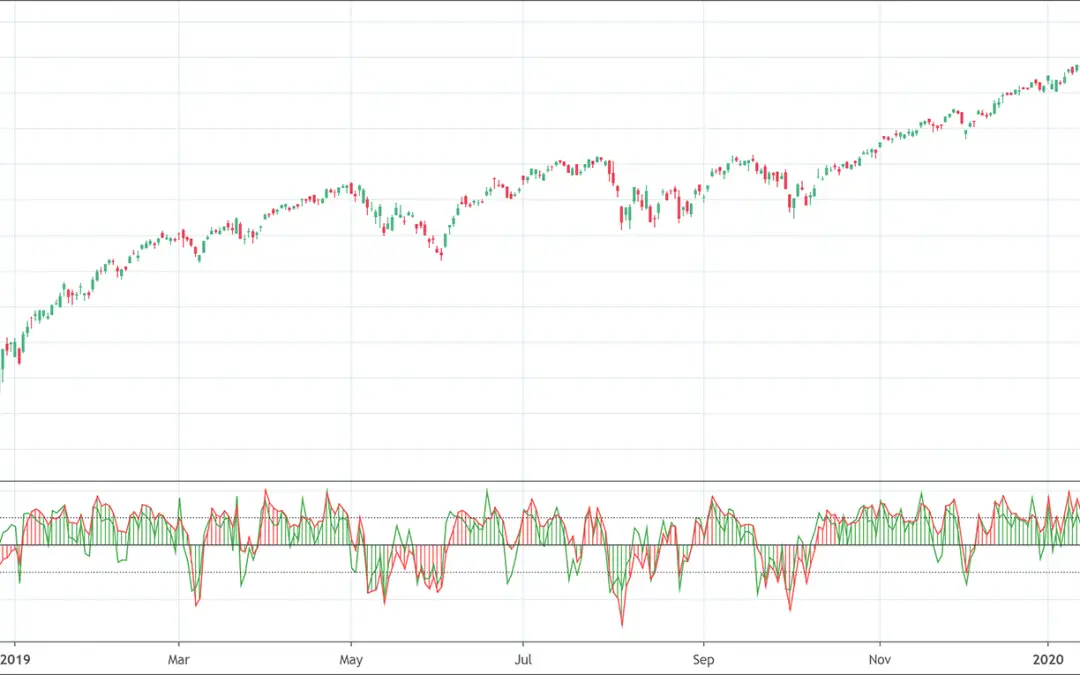
The Woodies CCI indicator is designed to help traders identify turning points.It is a complete system with predefined rules. The Woodies CCI indicator is a technical analysis tools popular for generating strong signals for trading binary or digital options and CFDs....
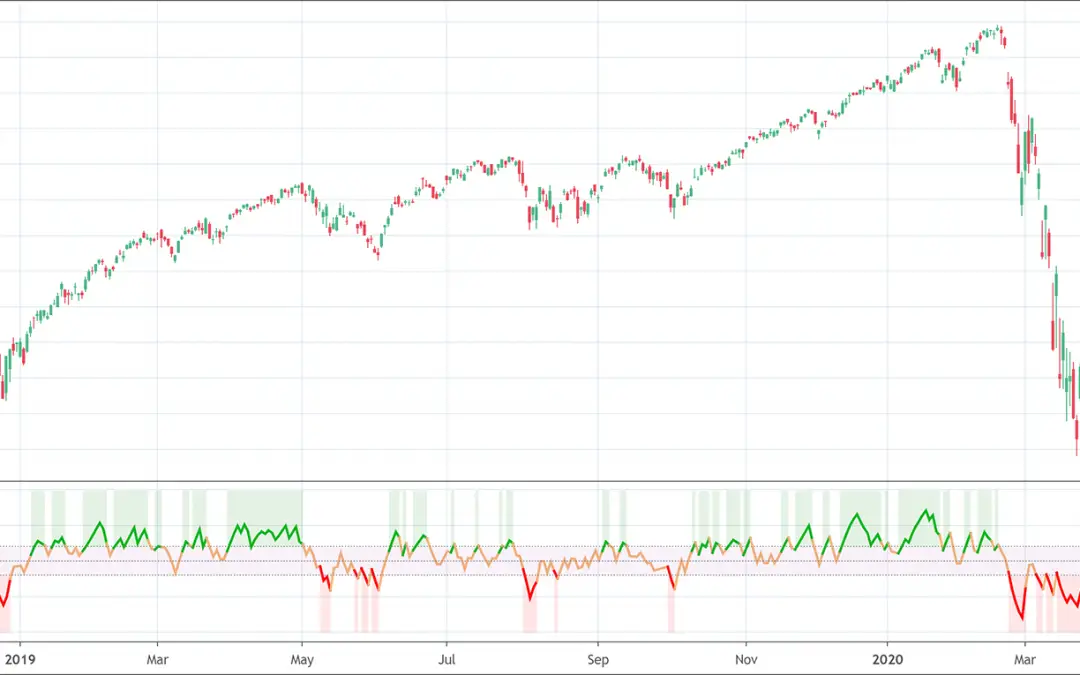
The Relative Volatility Index (RVI) is a volatility indicator.It is best to use it in conjunction with other momentum or trend following indicators to confirm trends. The Relative Volatility Index (RVI) is a volatility indicator that helps to identify the direction of...
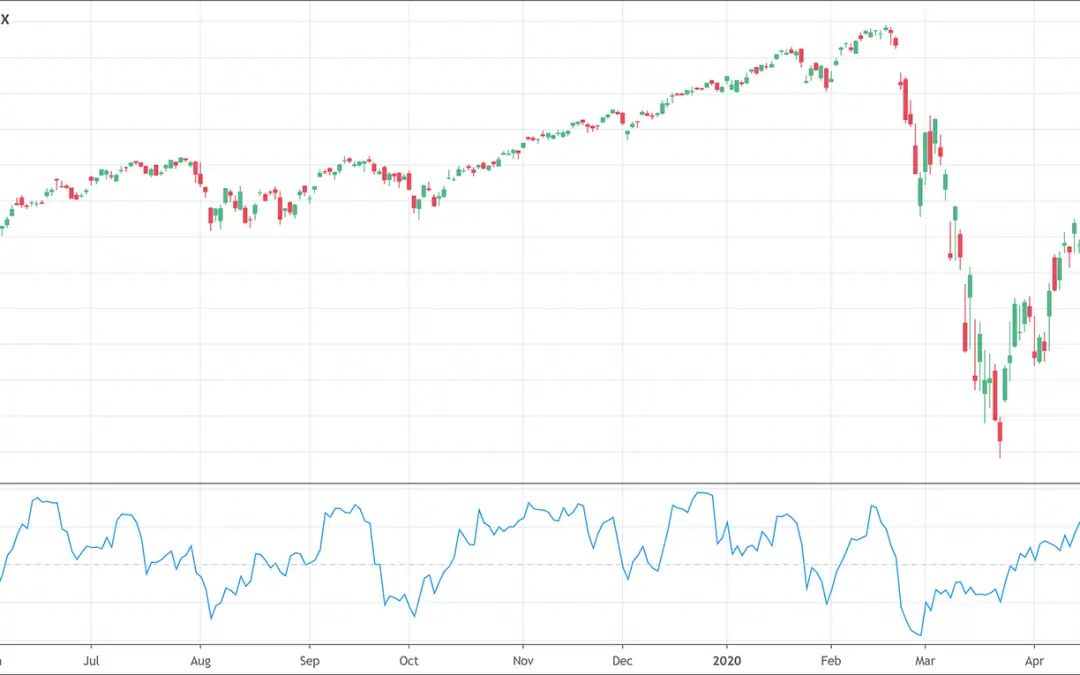
The Chande Momentum Oscillator (CMO) is a momentum indicator.It is calculated as the difference between the sum of all recent ups and the sum of all recent downs and then divided by the sum of all price movements during a predefined period. The Chande Momentum...
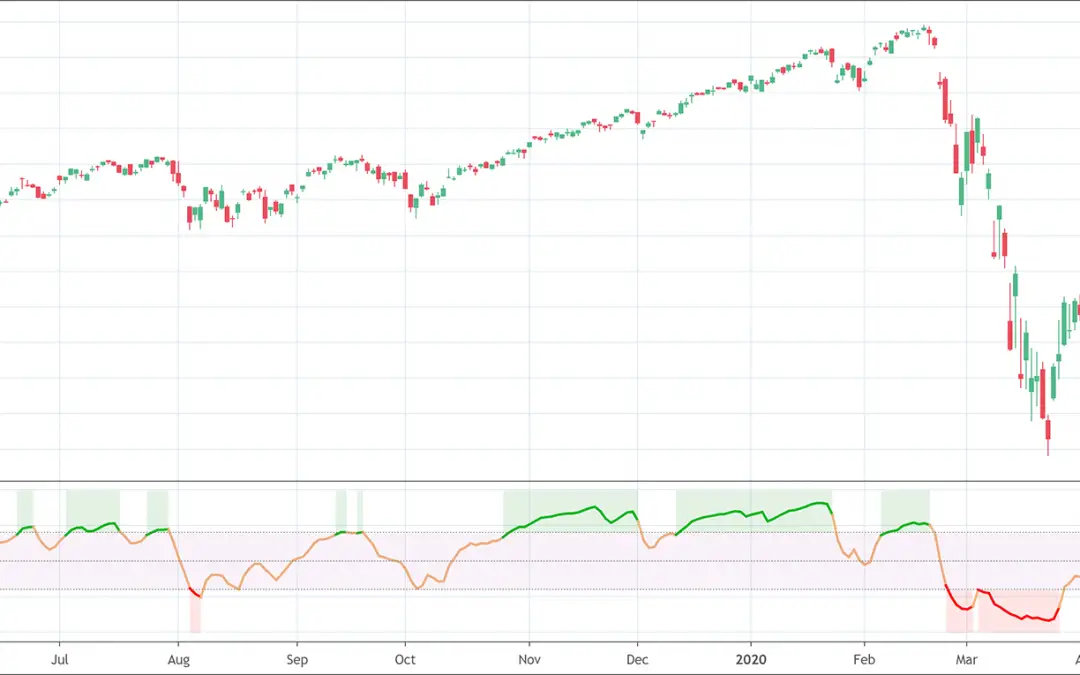
Relative Momentum Index (RMI) indicator tries to improve the reading of the RSI indicator.It calculates a ratio of upwards changes to downwards changes in prices over N-period bars.It helps to determine the overall trend in the market. Roger Altman developed the...
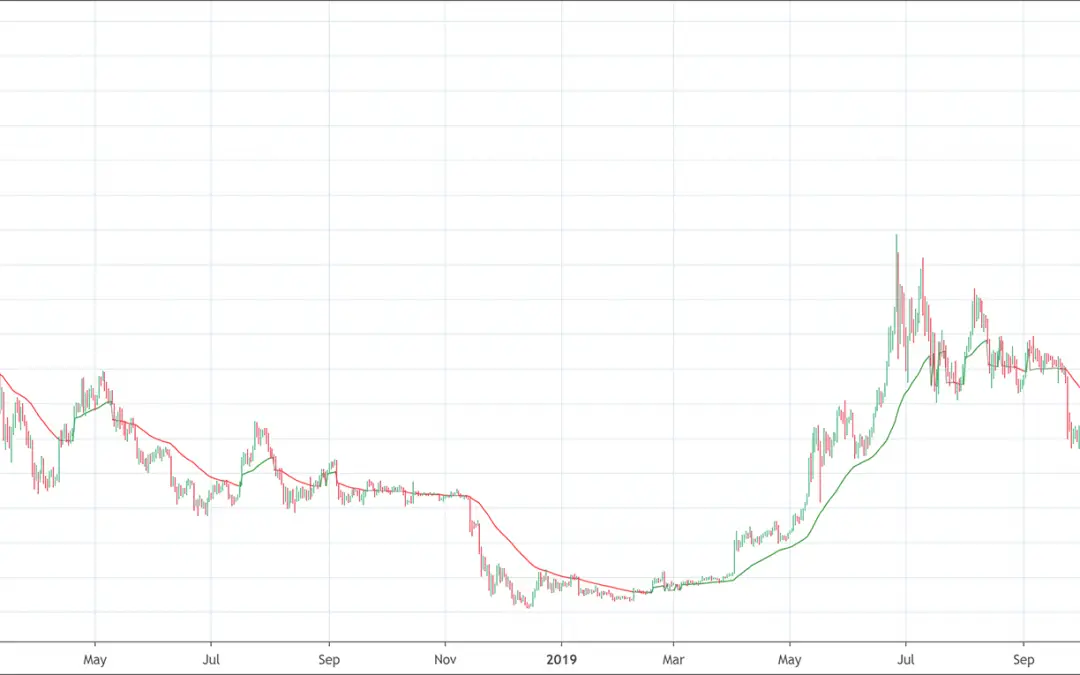
The Gann HiLo indicator helps traders determine the direction of the trends.It is built of a moving average. The Gann HiLo Activator is a technical analysis tool that follows trends in the market. Robert Krausz developed the Gann HiLo indicator to help traders to...
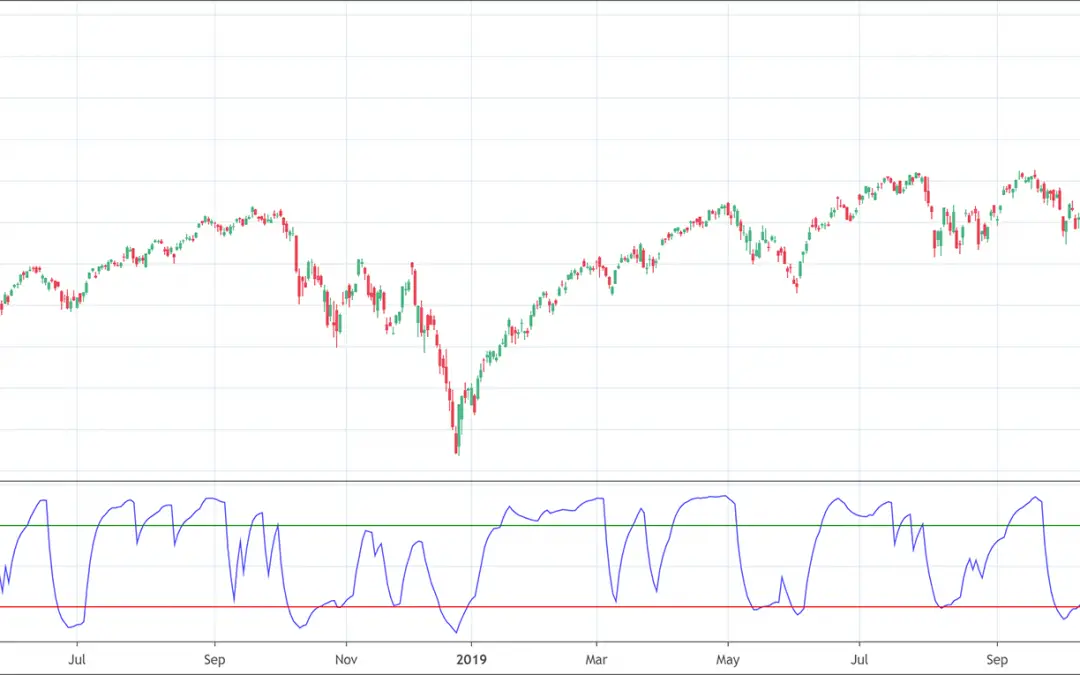
The Polarized Fractal Efficiency (PFE) indicator helps determine the price efficiency.It determines the strength and direction of the trend. What is the Polarized Fractal Efficiency indicator? The Polarized Fractal Efficiency (PFE) indicator is a technical...
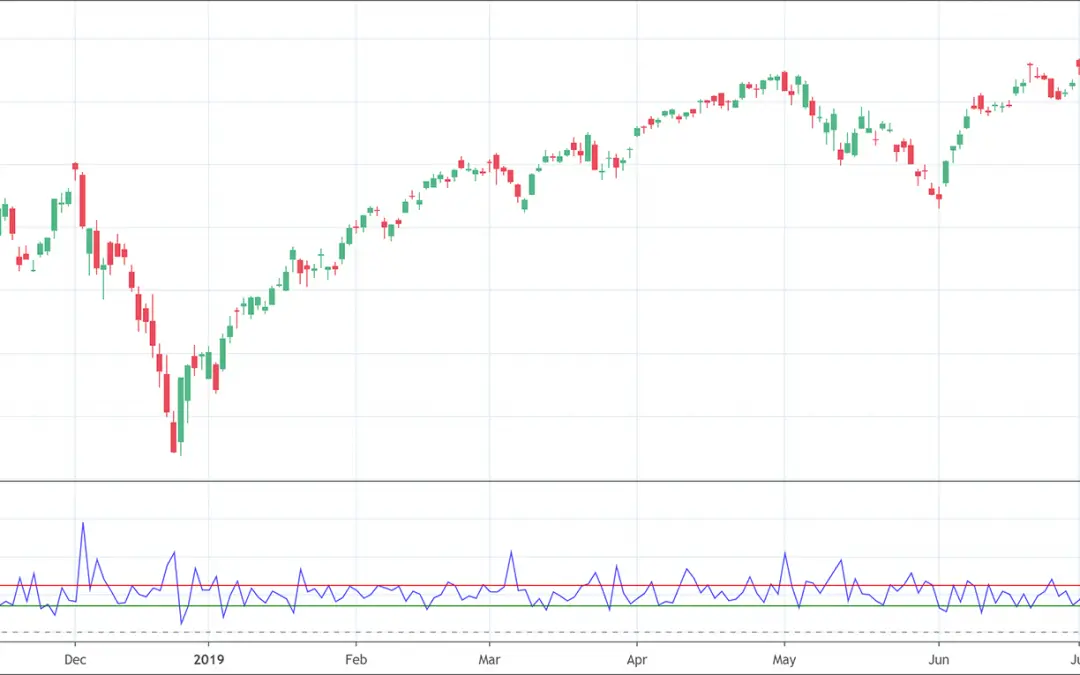
Arms Index and TRIN indicators are two names for the same indicator.The Arms Index is an oscillator which measures market volatility.It helps to gauge the overall sentiment in the market. The Arms Index is an oscillator and a leading indicator that helps to measure...
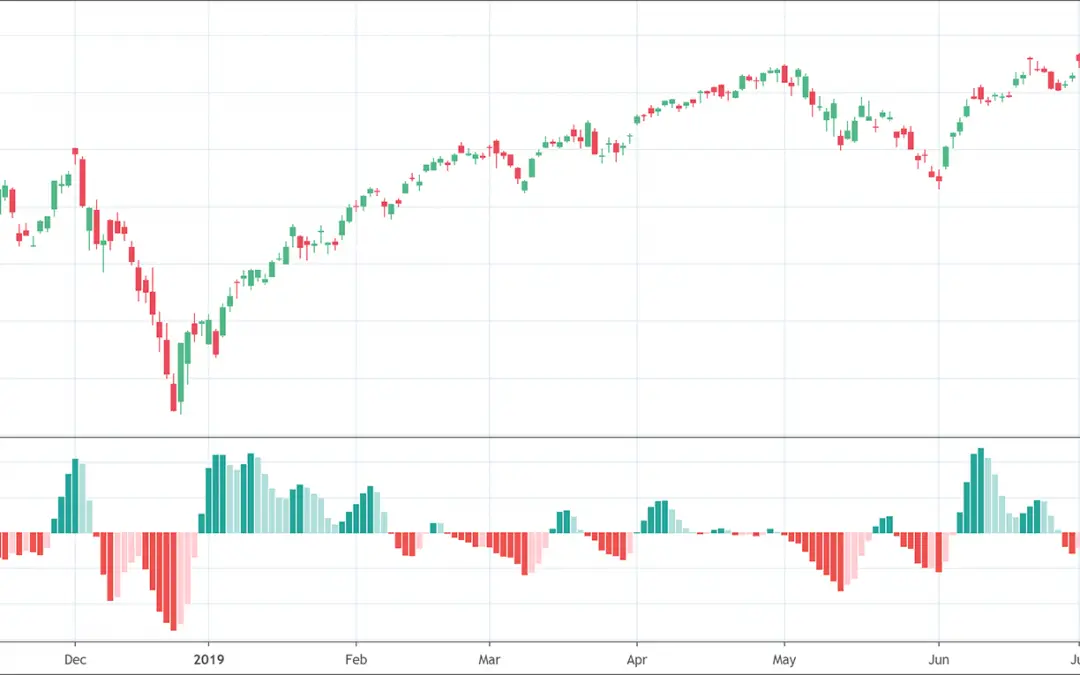
The Accelerator Oscillator helps gauge the momentum in the market.It helps predict when the momentum will change.The Accelerator Oscillator measures the acceleration or deceleration of the current driving force in the market. The Accelerator Oscillator (AC indicator)...
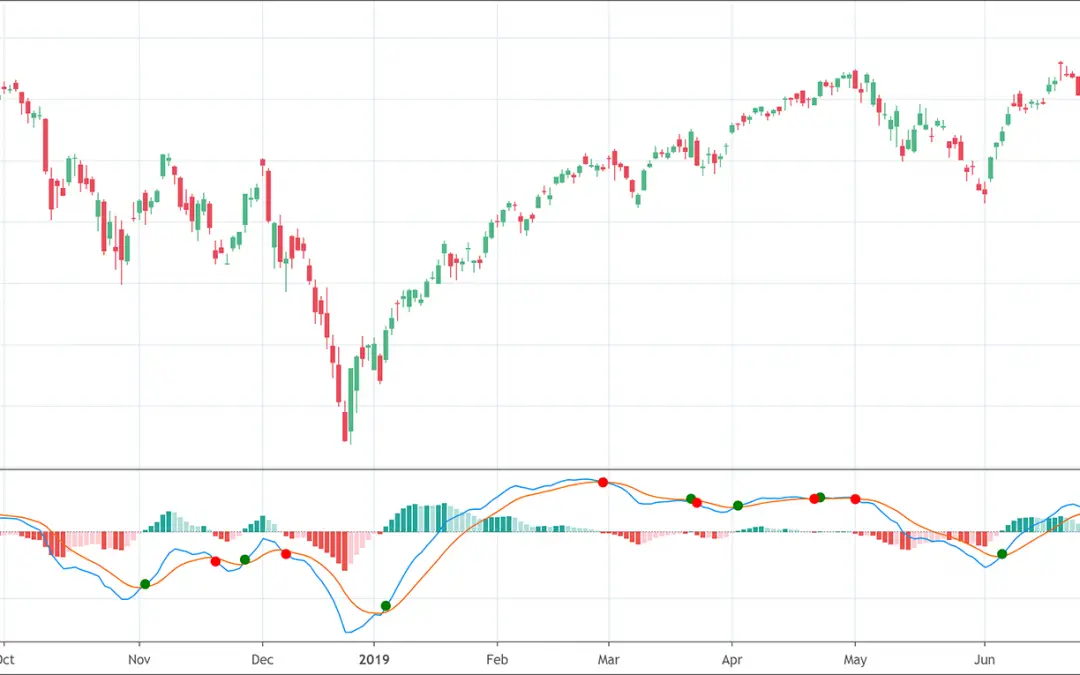
The Percentage Price Oscillator is based off 2 moving averages.It is very similar to the MACD indicator. The Percentage Price Oscillator (PPO) is a technical analysis tool that measures the relationship between the two moving averages in terms of percentage. These two...
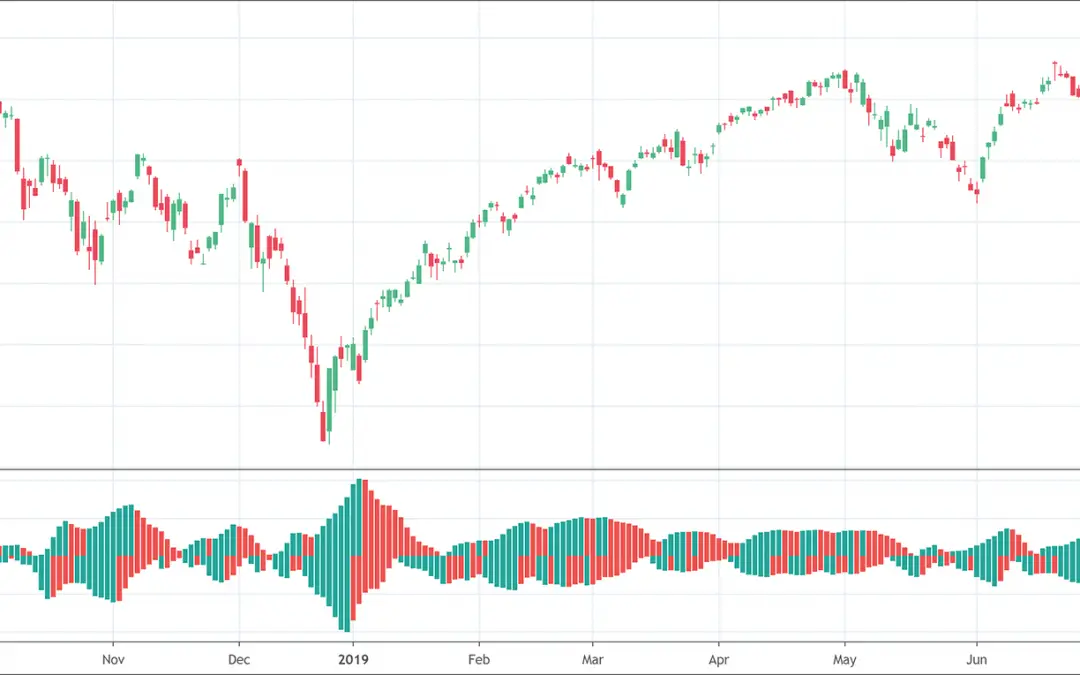
The Gator Oscillator helps to observe the degree of convergence/divergence of the balance lines.It's supplementary tool of the Alligator Oscillator. The Gator Oscillator (GO) is a technical analysis tool that helps to observe the degree of convergence/divergence of...
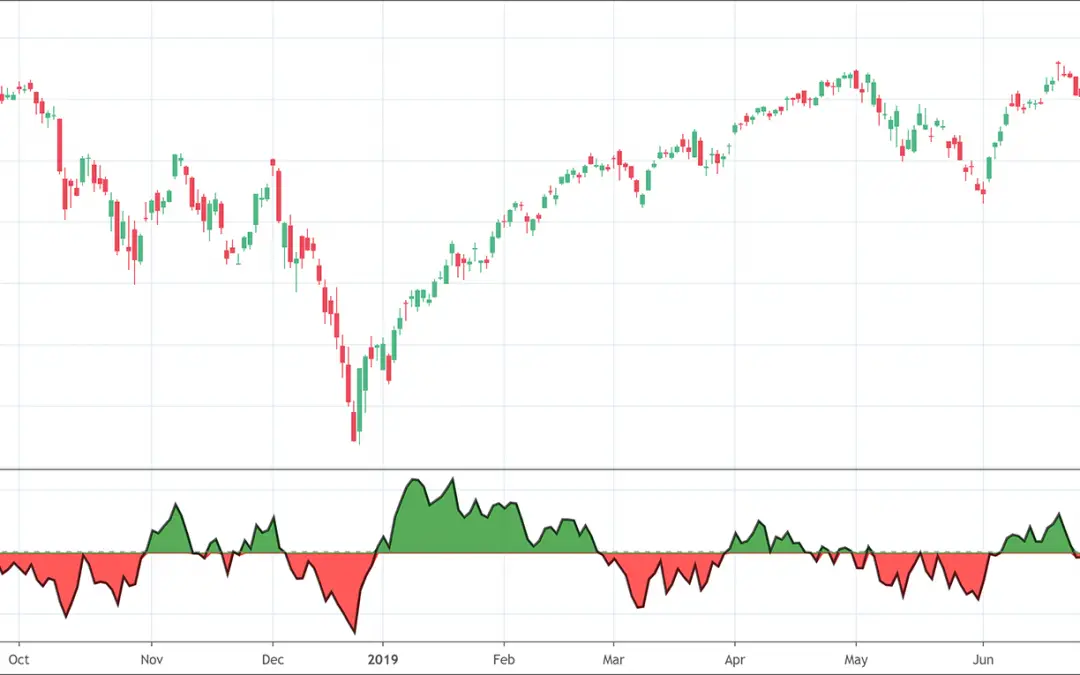
The McClellan Oscillator is a market breadth indicator.The interpretation is similar to the MACD indicator. What is the McClellan Oscillator? The McClellan Oscillator is a technical analysis indicator. It quantifies the difference between the advancing and declining...
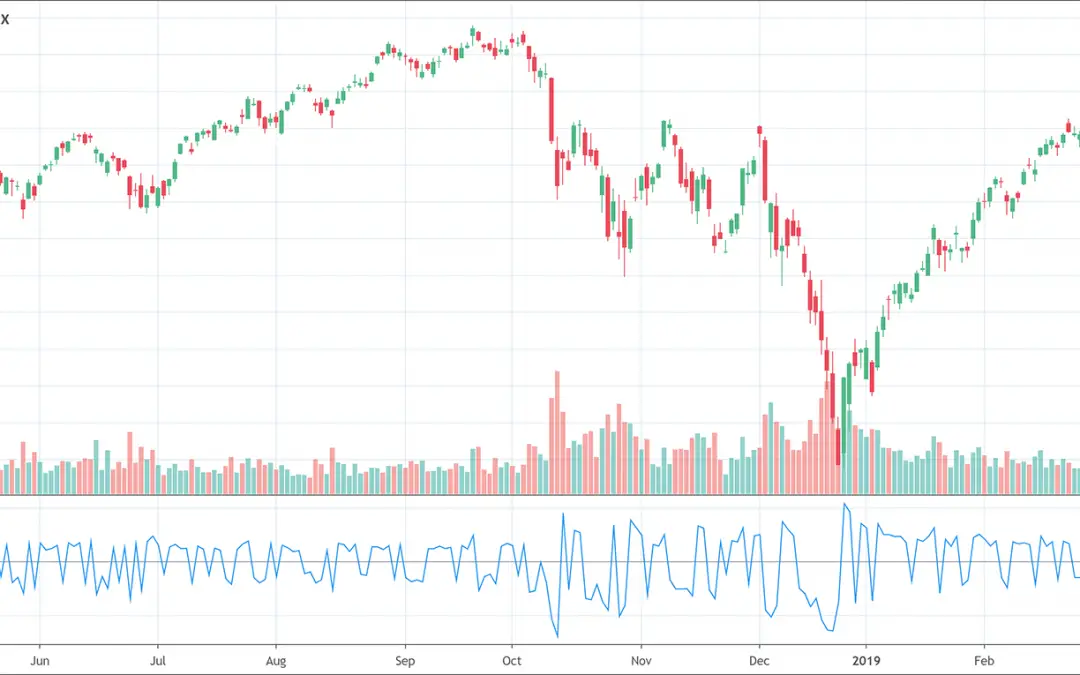
Net volume indicator is a simple technical analysis tool that works on a simple calculation.It is the difference between a security's uptick volume and its downtick volume.A positive value indicates that volume uptick and buying pressure is greater than the volume...
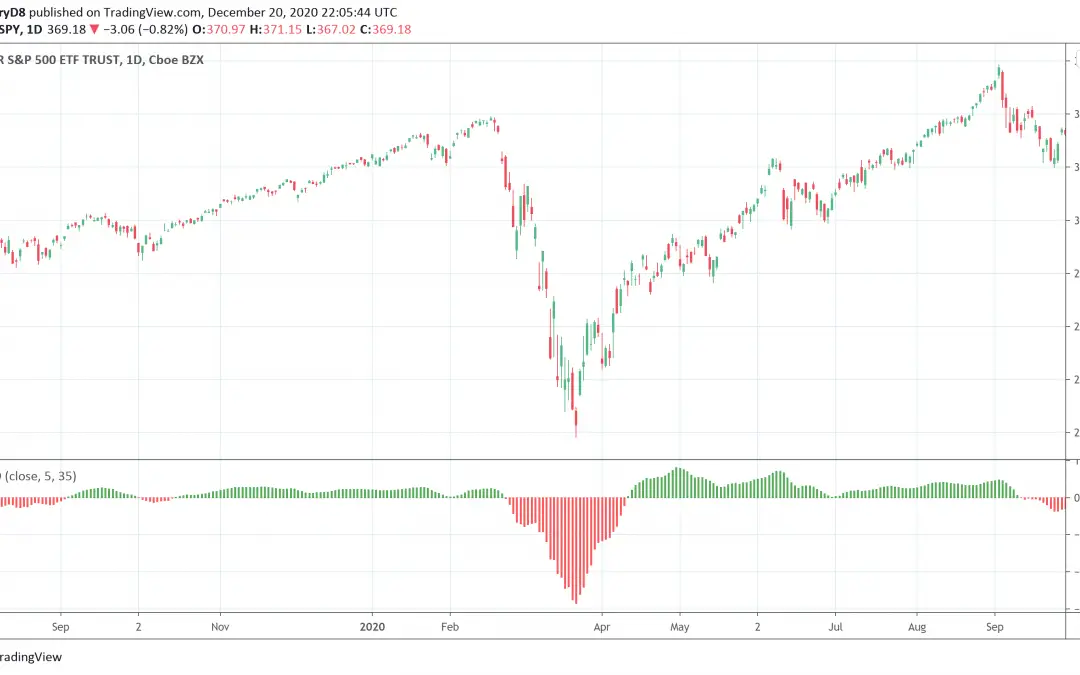
The Elliott Wave Oscillator (EWO) oscillates with the price.It helps traders observe when an existing wave ends and when a new one begins.It is the difference between 2 different moving averages (with different period). The Elliott Wave Oscillator (EWO) is based on...
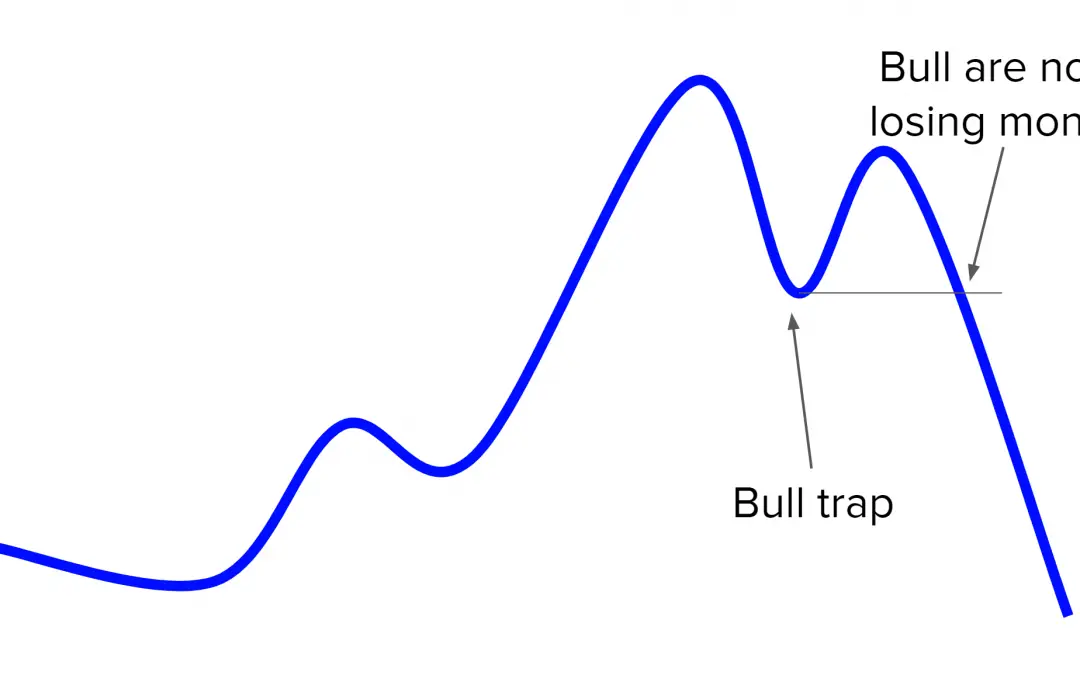
A bull trap occurs in financial markets when prices begin to move high and then suddenly reverse and decline.A trap deceives traders acting on the buy signal and entering long positions. Hence, it causes significant losses for investors. Financial trading is not a...
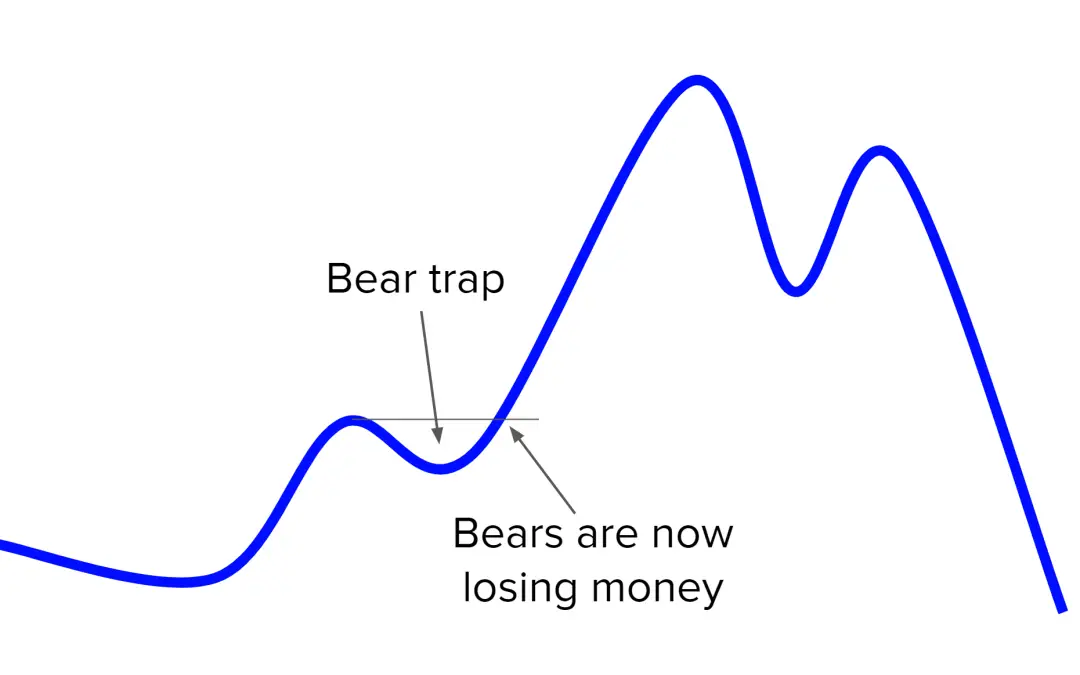
A bear trap occurs when stocks, indexes, or other financial assets issue false signals of reversal of an uptrend in the financial market. Market participants expect a decline in prices but prices either remain unchanged or increase.Bear traps cause substantial losses...
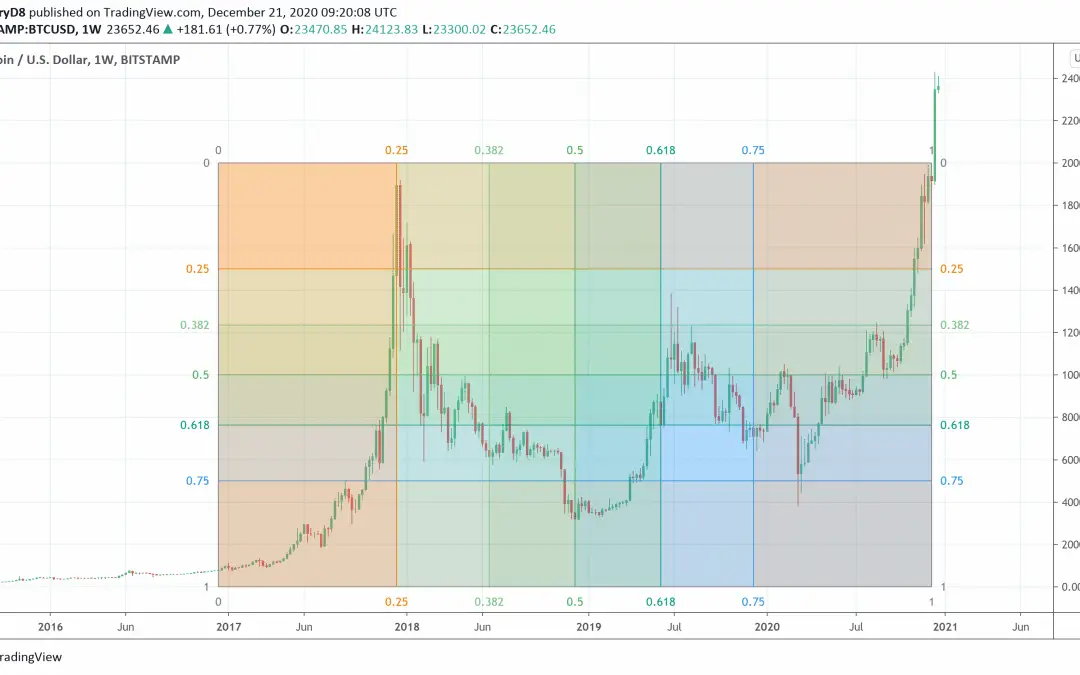
The Gann Box also uses innovative geometrical and mathematical relations to help traders measure and identify the recurring price cycles.Price and time levels are the partitions equally divided by the Gann Box. William Delbert Gann or WD Gann was an expert trader of...
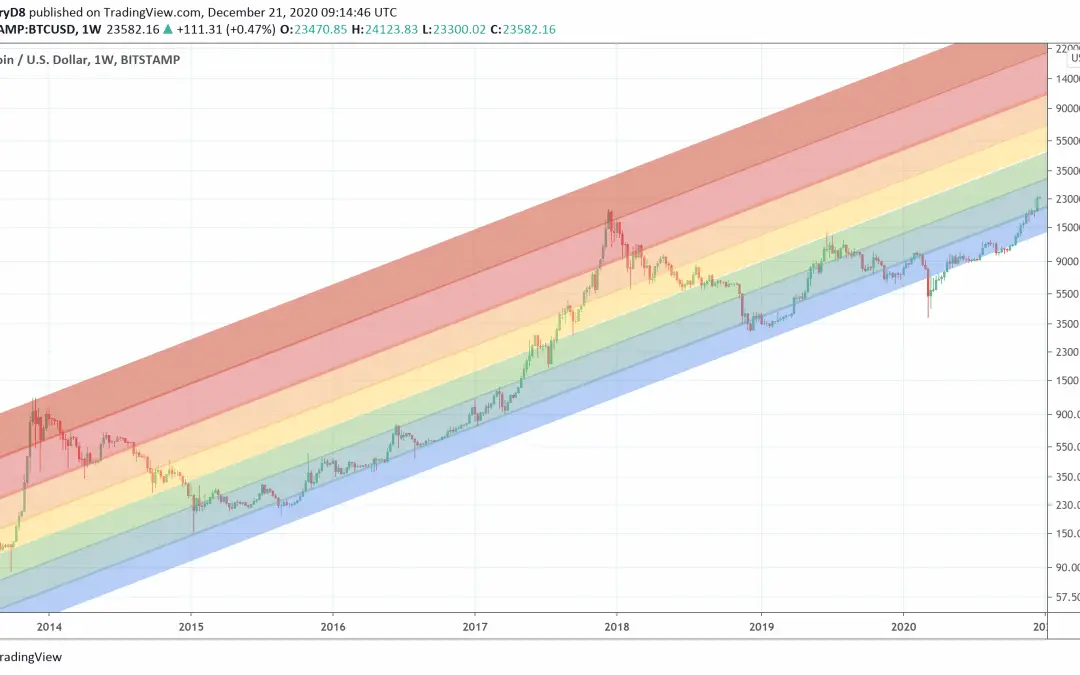
The Rainbow Charts indicator is a technical analysis tool that follows trend.It helps traders buy when the price is low and sell when the price is high. The Rainbow Charts indicator is a technical analysis tool that follows trend. It helps traders to visualize a full...
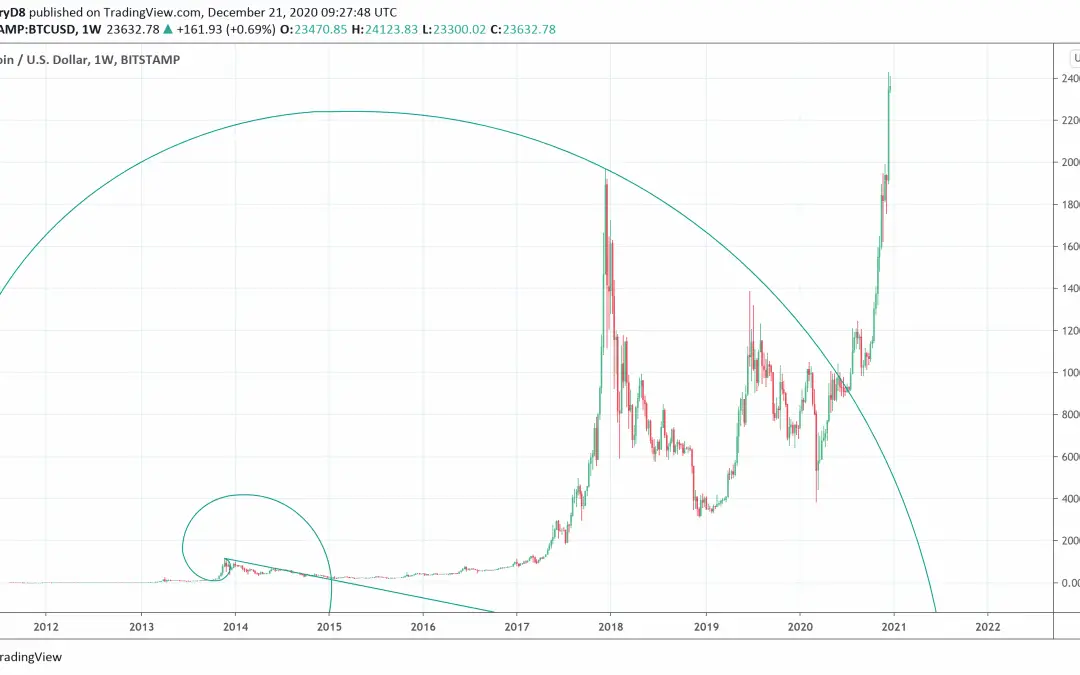
Fibonacci spiral or Fib spiral is a technical analysis tool that helps to identify important price and time targets.Fib spiral is a tool that is based on the Fibonacci ratios. Fibonacci spiral or Fib spiral is a technical analysis tool that helps to identify important...
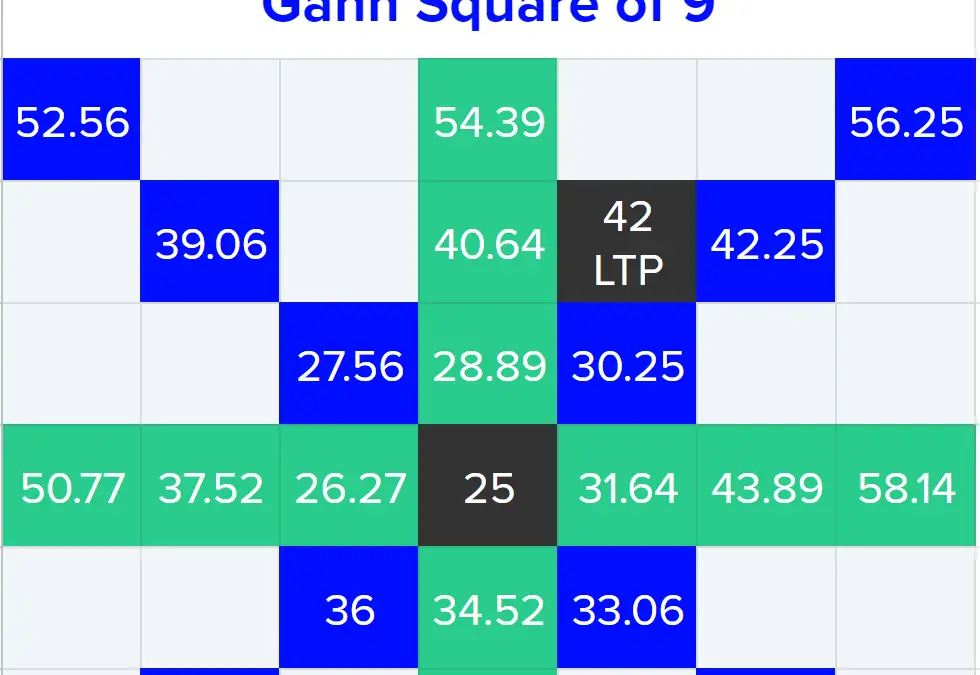
The Gann Square of Nine defines important levels where price might shoot and retrace.Numbers in the square are arranged in ascending order starting from 1 as we have already discussed.The most important numbers in the Gann Square of Nine occur every 45° on nine chart....
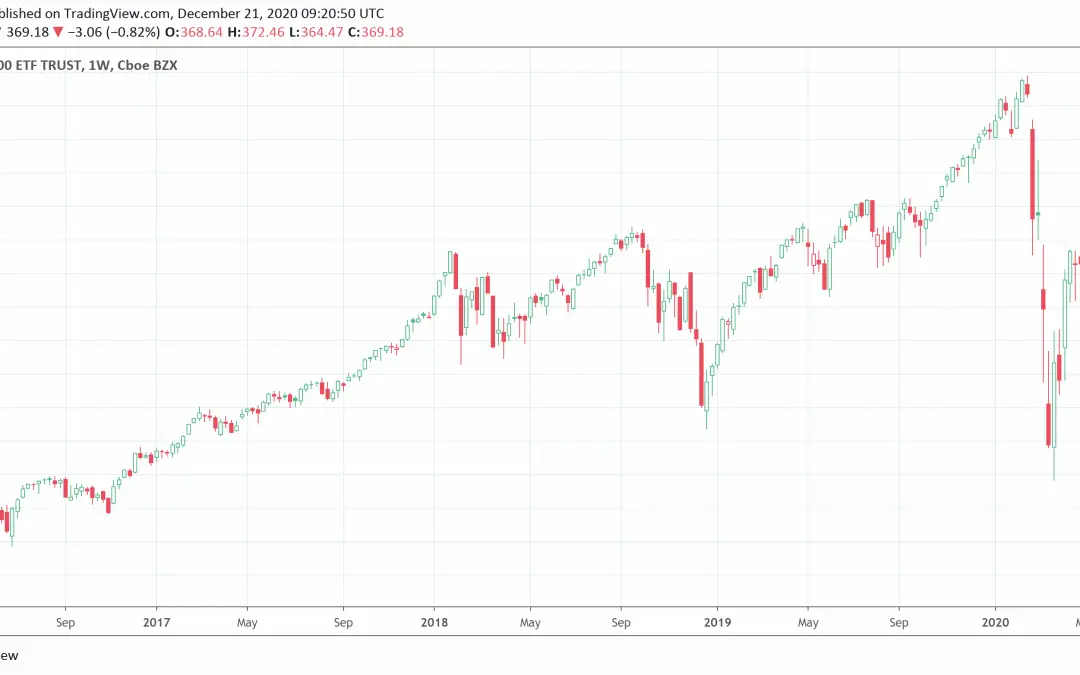
There are two types of candlesticks, hollow candlesticks and filled candlestick.Candlesticks also tell us about the strength of a trend in the market.The hollow candlesticks tell us that the trend is strengthening as prices move higher after the open. Different types...
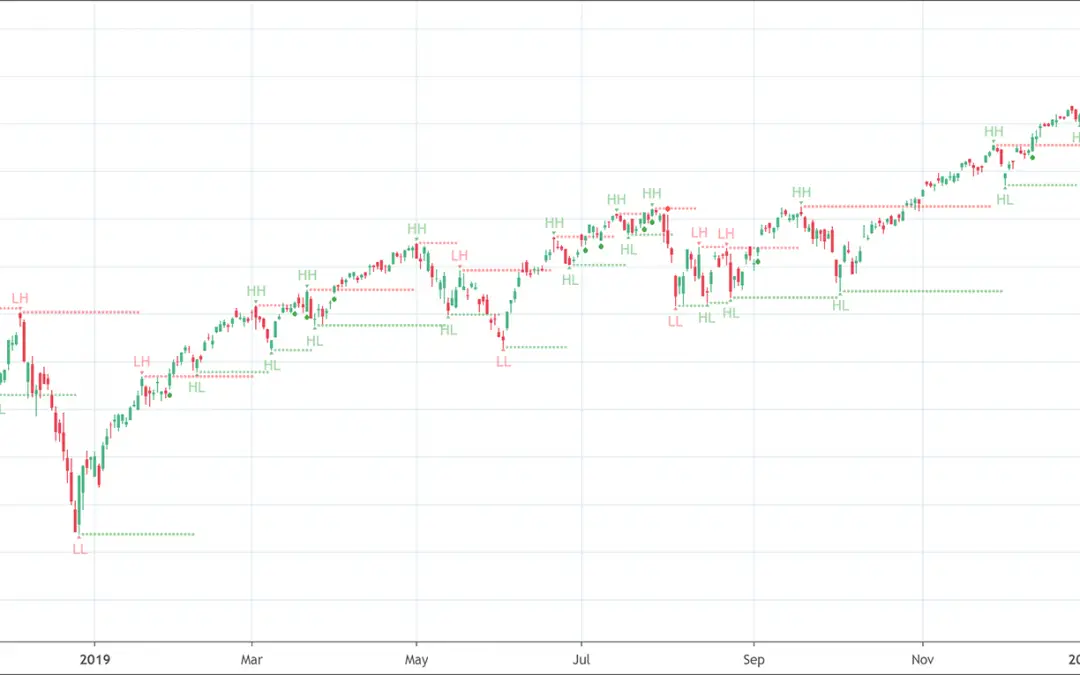
The Pivot Point (High/Low) indicator is a technical analysis tool that helps to anticipate potential reversals of prices in the market.It charts on the market extreme points (highs and lows). The Pivot Point (High/Low) indicator is a technical analysis tool that helps...
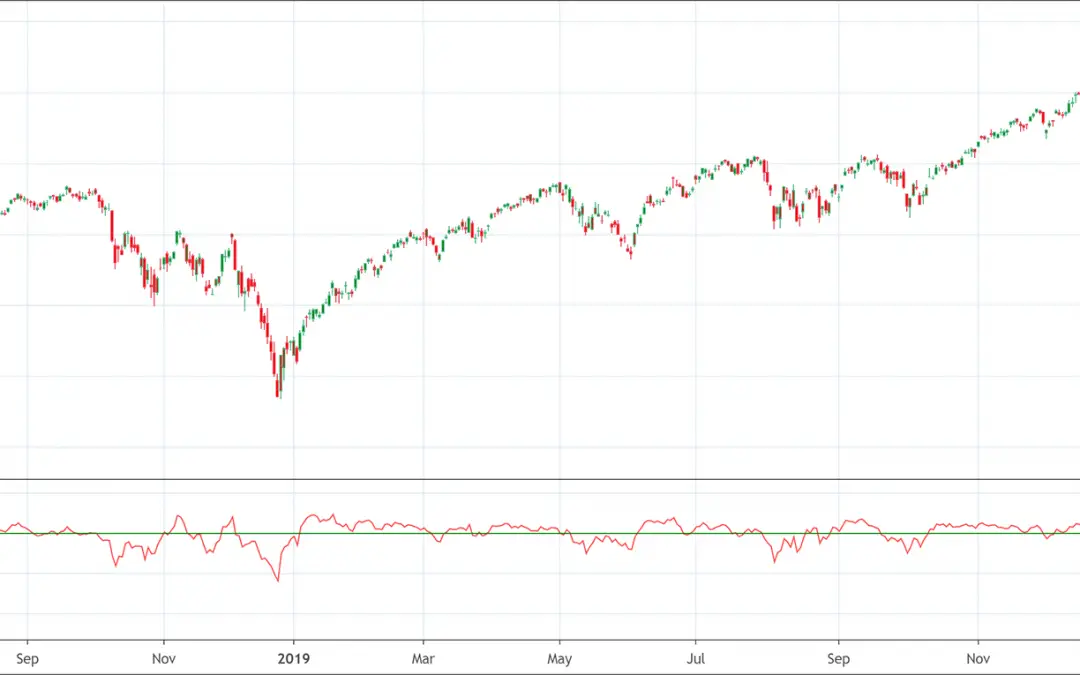
The Detrended Price Oscillator (DPO) helps to eliminate the long-term trends in prices.To do so, it measures distance between extreme highs and lows. Gerald Appel developed the Detrended Price Oscillator (DPO). It is a technical analysis tool that helps to eliminate...
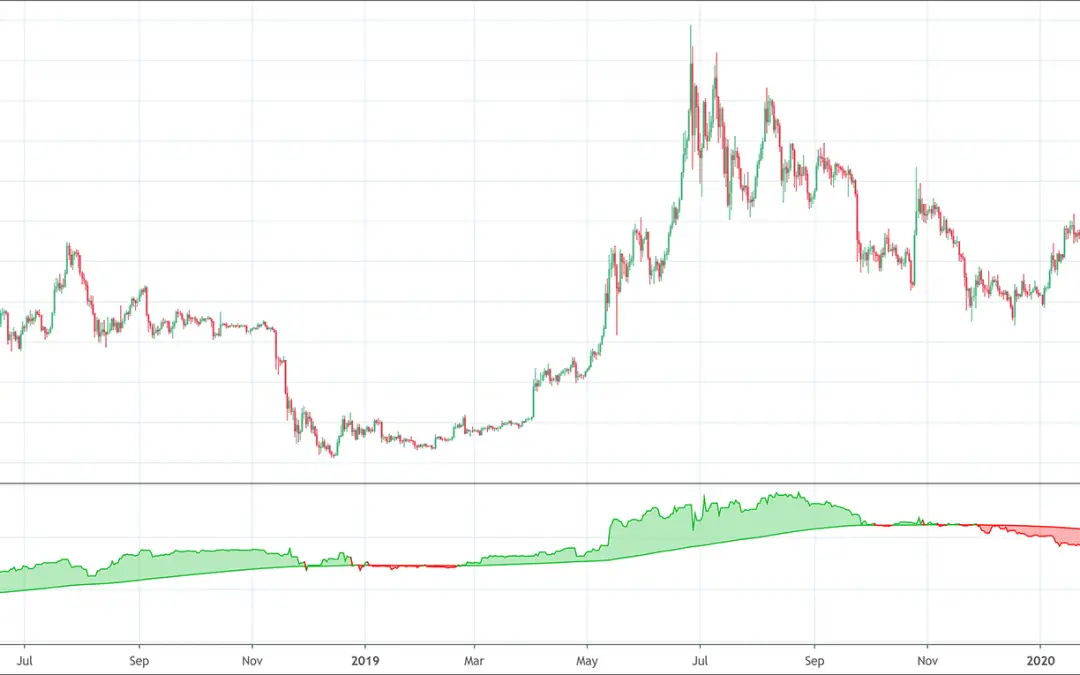
The Negative Volume Index (NVI) indicator shows how down volume days impact price.It aims at reflecting the mindset of the smart money professionals. Paul Dysart invented the Negative Volume Index (NVI) indicator. It watches the trade volume and Paul considered trade...
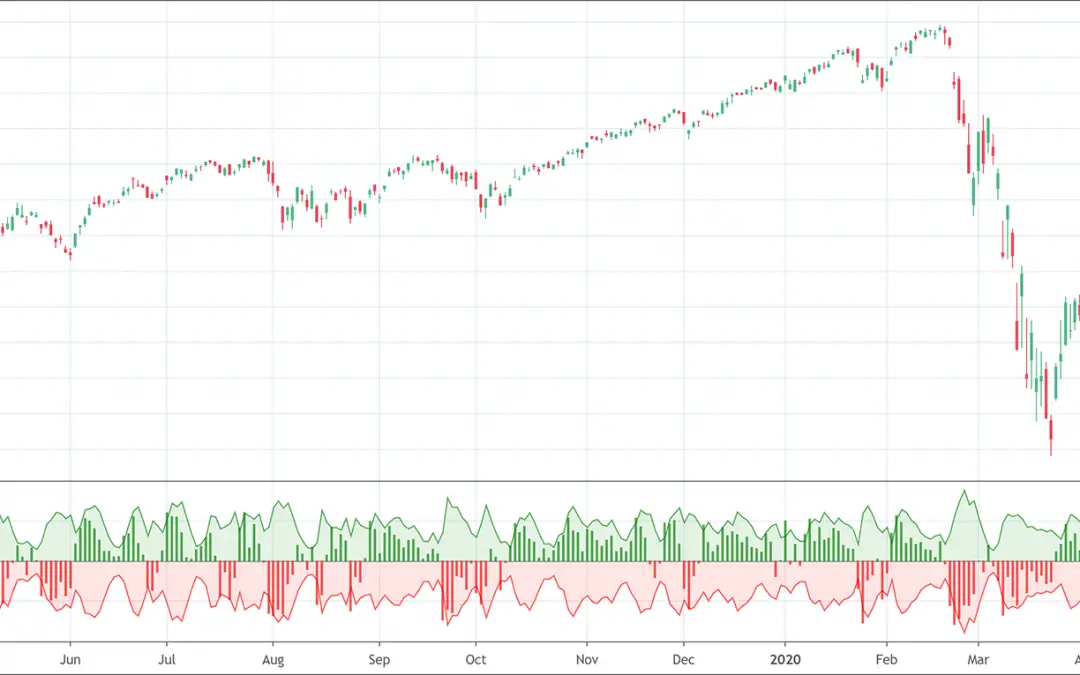
The Rainbow Oscillator is a trend following indicator.It uses multiple moving averages to hint for trend reversal. The Rainbow Oscillator indicator helps to predict the changes in the market trend and to follow trends. It offers only two possible states, the upward...
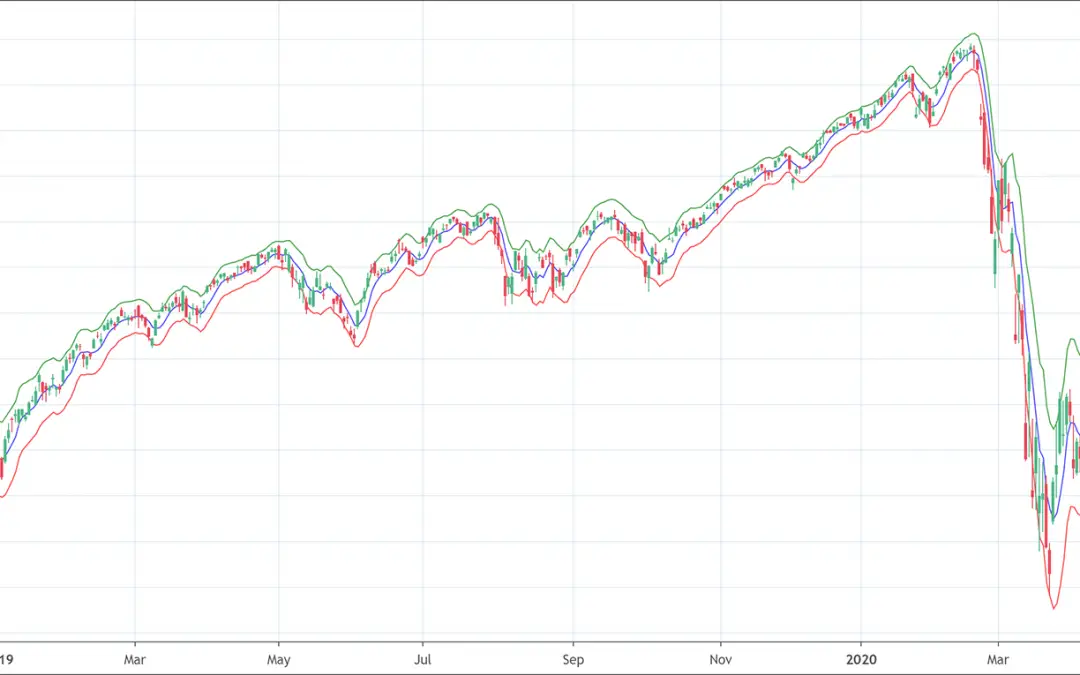
The Stoller Average Range Channels (STARC) Bands helps traders know when to buy and sell.When market is in uptrend, the STARC bands suggest to buy near the lower band and selling near the upper band.When market is in downtrend, the STARC bands suggest the opposite....

Charts depict price evolution over a specific period of time.It can be drawn in many ways (line, candlestick, ...)It can show different timeframe (price every 1 hour, 1 day, 1 week, ...) To succeed in today's financial world, the right knowledge and right skills are...
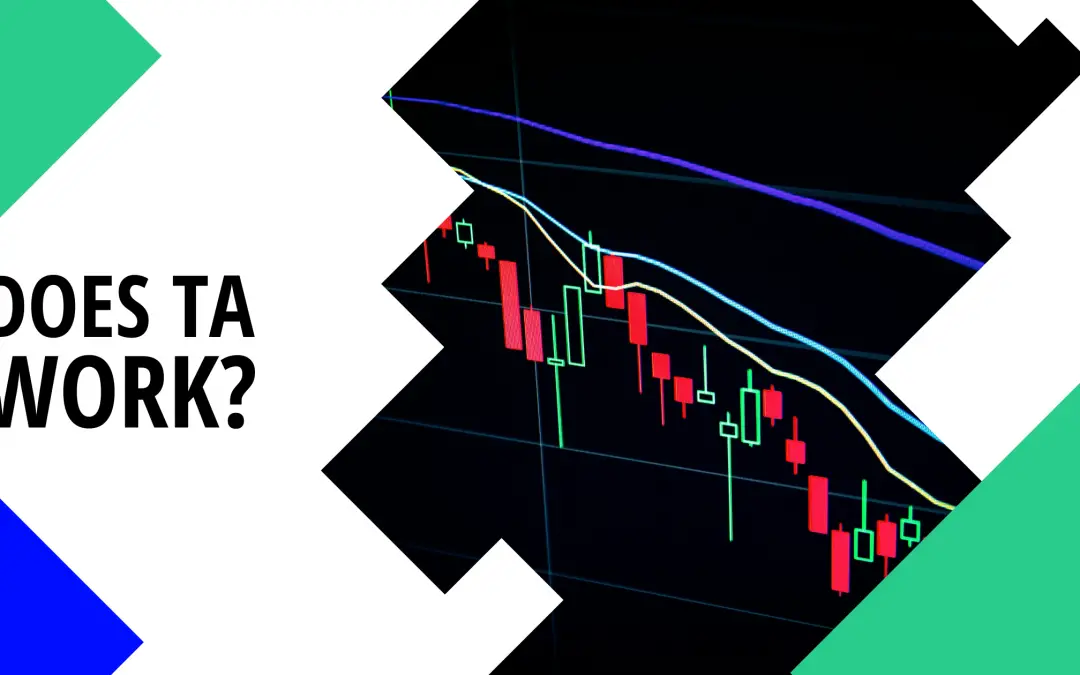
People offer wonder, is technical analysis useful or is technical analysis useless. They also brood over another question that, “can technical analysis beat the market?”. Does technical analysis work? Can we answer those questions as “yes” or “no?” Let us not make...

Technical analysis is one of the two major analytical techniques to analyze financial markets. The second one is fundamental analysis. Fundamental analysis focuses on figuring out the true value of stocks. On the other hand, technical analysis focuses on identifying...
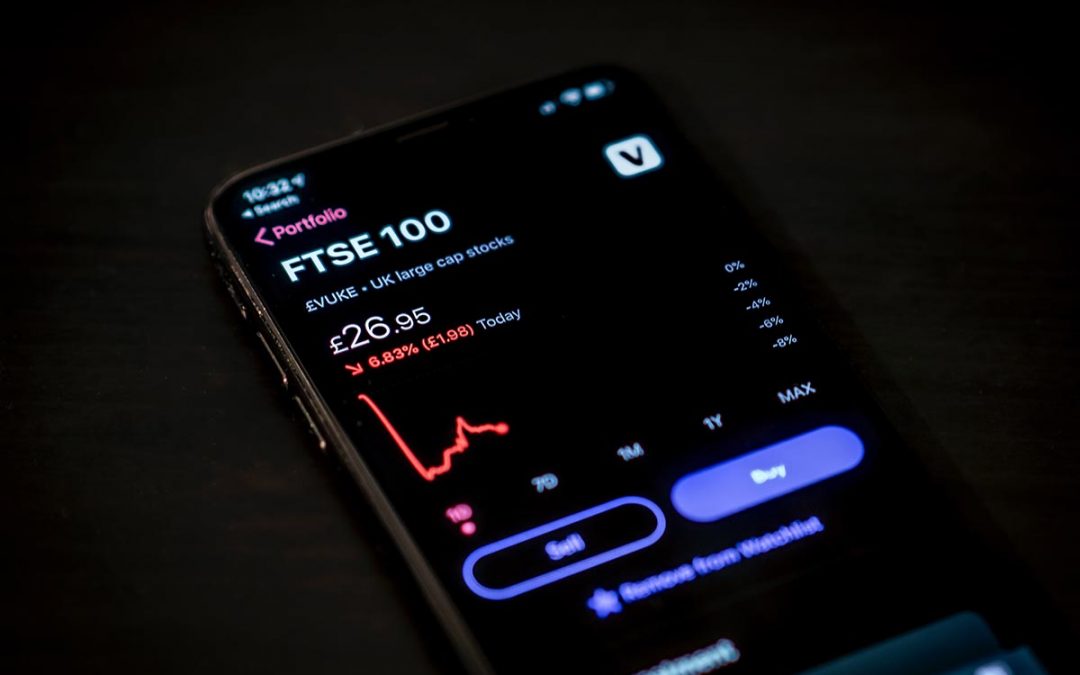
In October 1987, stock markets were booming and enjoying a bull run of five years.The stock market crash of 1987 was so much catastrophic that it caused Dow Jones's 1987 chart to fell all of a sudden.The Dow chart 1987 faced the worst fall of history by 22.6%. The...

Trading trends and developing a viable trend trading strategy are integral elements of trading. Most of the successful traders often emphasize “trade the trend.” Why, because trading trends alone is enough to make sufficient money. Trend trading is one of the...
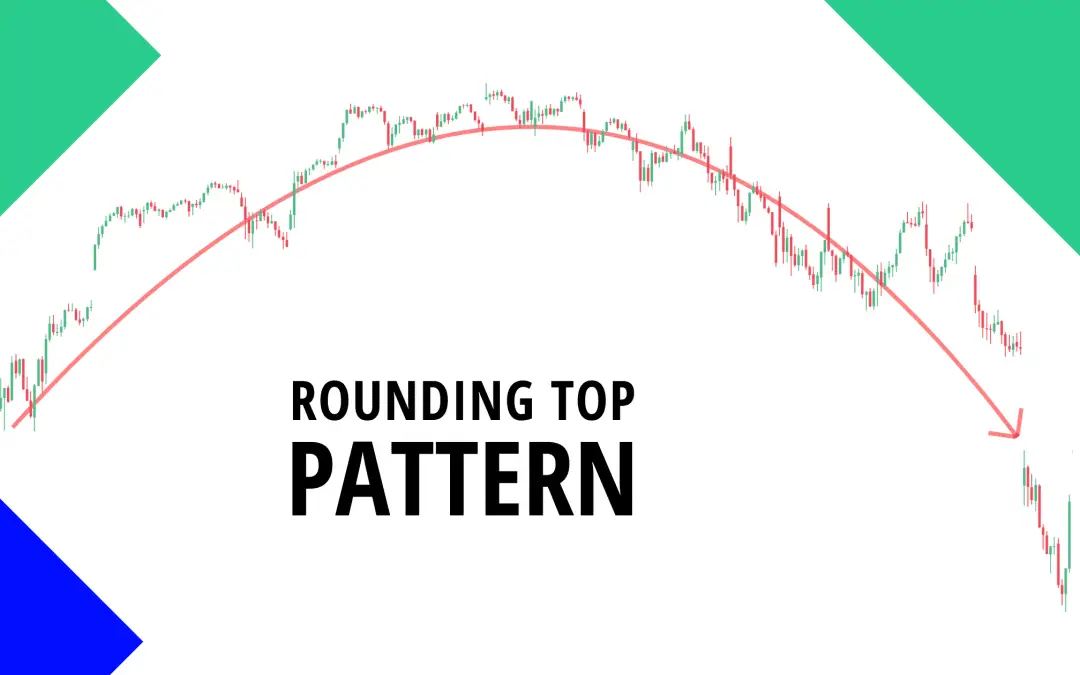
What are Rounded Top Pattern? The rounded top are reversal patterns used to signal the end of a trend. It notifies traders a likely reversal point on a price chart. Rounded top pattern is represented in form of an inverted ‘u’ shape and is also known as an ‘inverse...
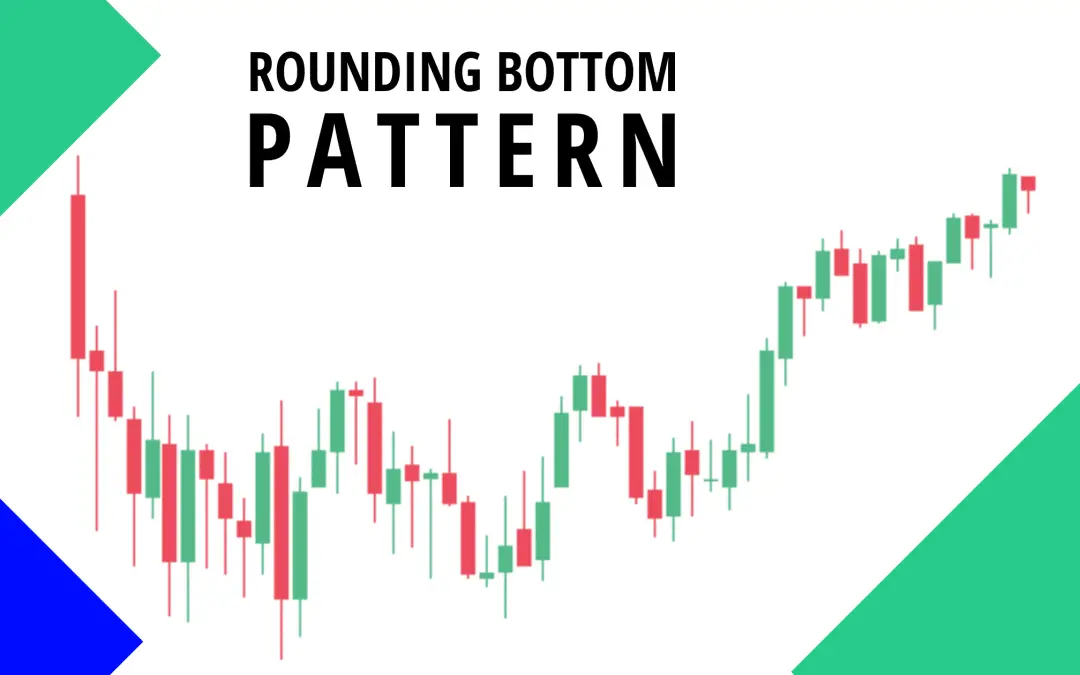
What is Rounding Bottom? A rounding bottom is a chart pattern used in technical analysis. It can be recognized by various price movements that graphically makes up a U-shape. Rounding bottoms are situated at the close of an elongated downward trend. They signify a...
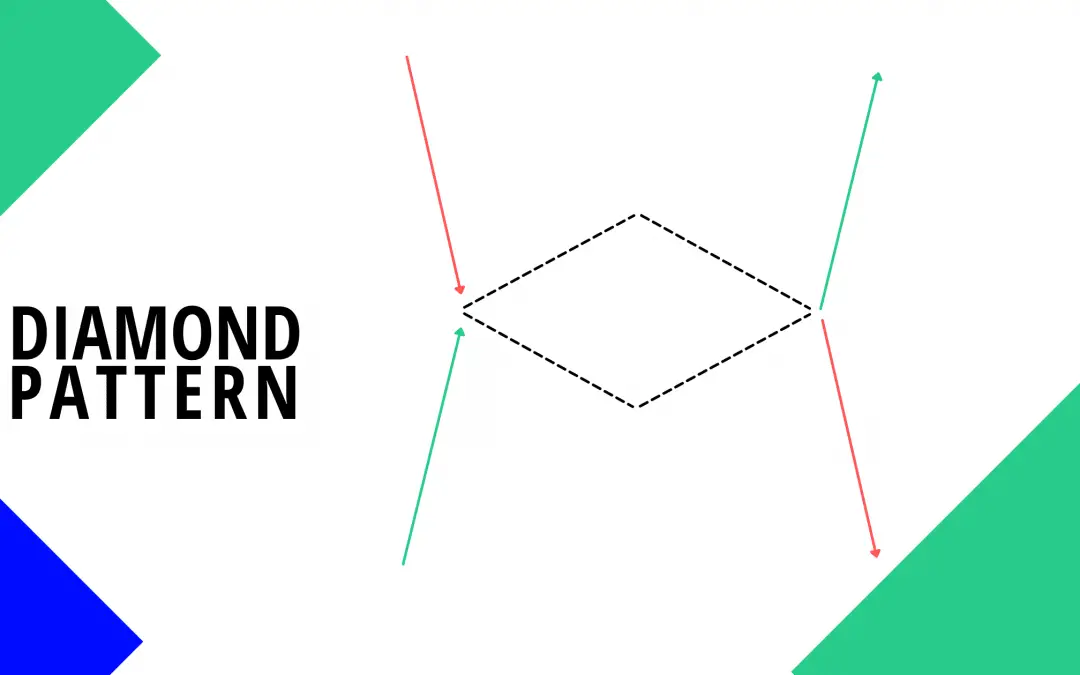
What is Diamond Chart Pattern? The diamond chart pattern is an advanced chart development that takes place in the financial market. It is not very popular among investors and technical traders. Only very few traders are knowledgeable about its structure and trading...
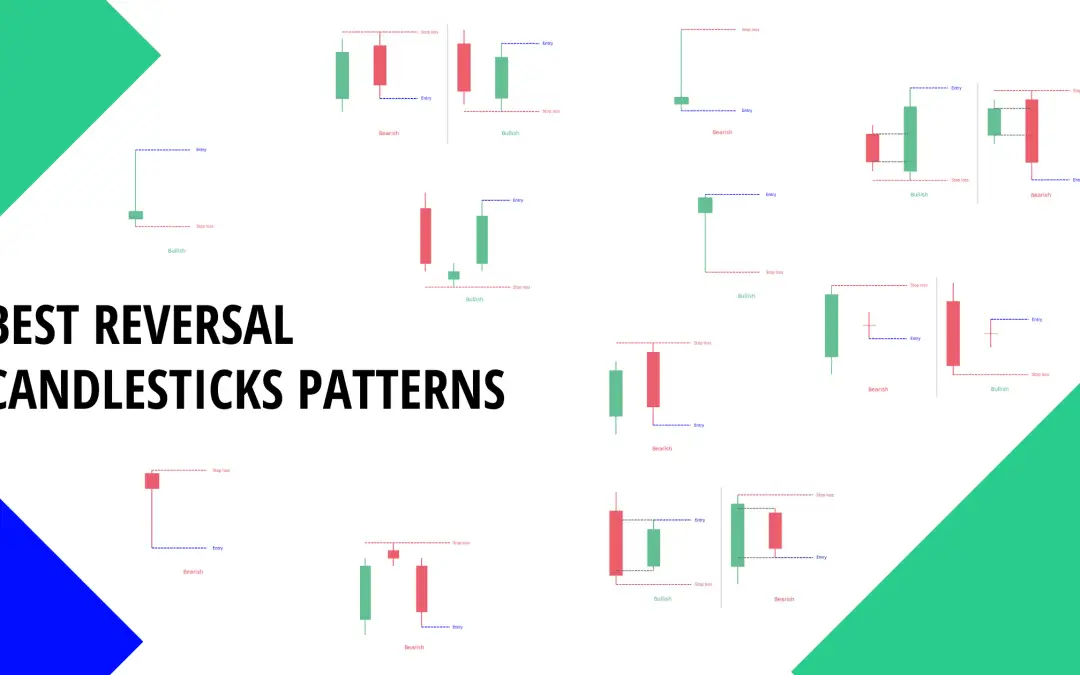
Introduction It took close to two centuries before candlestick charts made it to the Western Hemisphere from Japan. But just a quarter century for it to become the preferred charting technique among traders from Wall Street to Main Street. History made us believe that...
![TTM Squeeze Indicator Explained [Full Trading Guide]](https://patternswizard.com/wp-content/uploads/2021/10/TTM-Squeeze-1080x590.png)
Introduction The squeeze strategy has been adopted for trading and has been in use for many years. Carter developed the TTM Squeeze indicator. It is currently in use by many top and well-known charting software platforms, such as Thinkorswim and TradeStation. TTM...
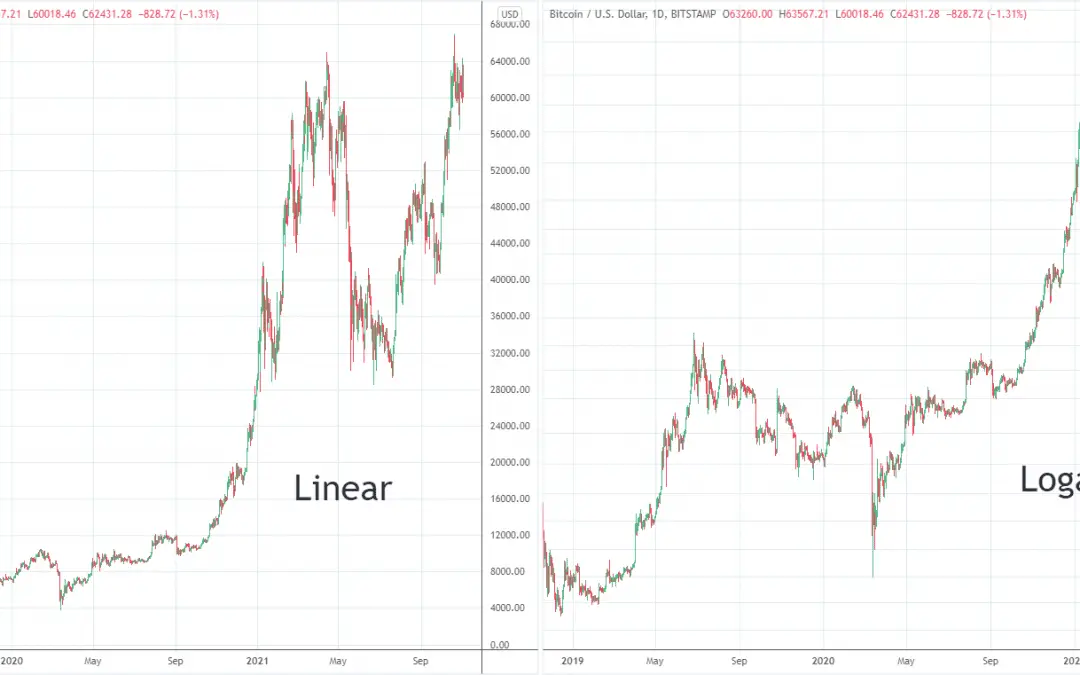
Logarithmic and linear scales are two important chart formats among various different charts formats. The interpretation of charts significantly varies among traders because of the use of the type of price scale when reading the charts. Both types of scales are...
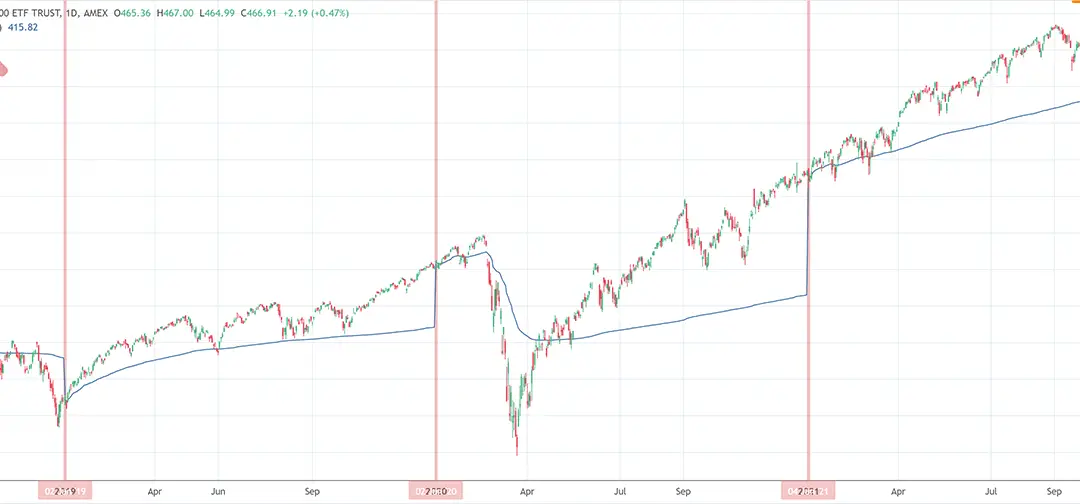
What is Anchored VWAP? Anchored volume weighted average price or simply AVWAP is a previous meaningful benchmark price on a chart selected by traders. It quantifies the average price a market has traded at, through a time frame, on the basis of both volume and price....
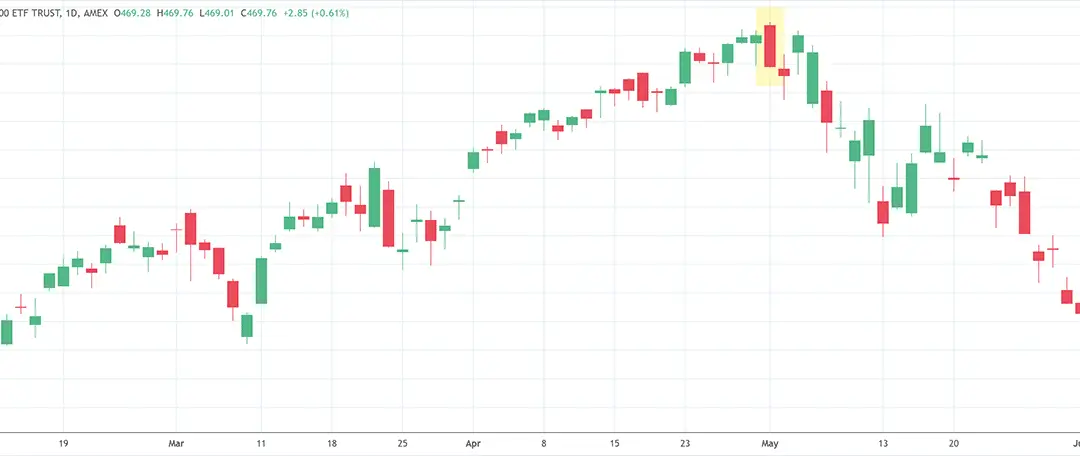
Introduction Candlestick charts are technical tool that put together data for numerous time periods into single price bars. This enables them to become more important than traditional open-high, low-close bars or simple lines...
![RSI Divergence: How to interpret & trade it? [Complete Strategy]](https://patternswizard.com/wp-content/uploads/2021/11/rsi-divergence-1080x504.png)
What is RSI Divergence? This is when the Relative Strength Index indicator begins to reverse right before the price does. Another way to look at RSI divergence is that RSI can display a change in price momentum, before you observe a change in price action. You can...
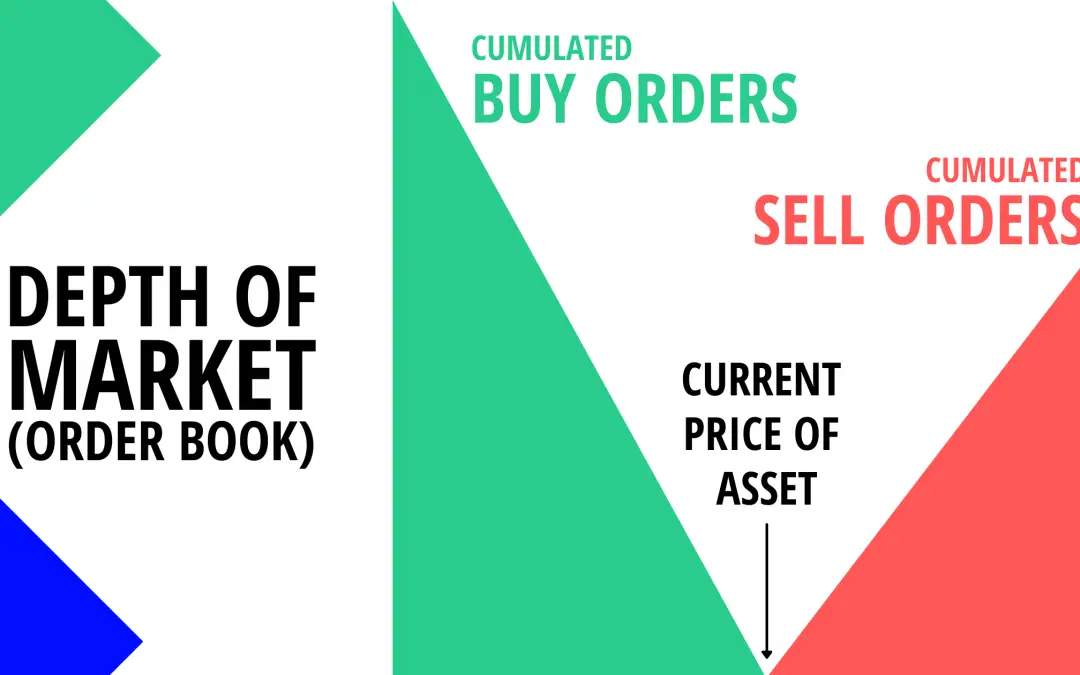
Depth of Market (DOM) is an electronic list of pending orders for a particular stock or any other financial instrument. In the simplest terms, DOM is a visual display of open buying and selling orders, organized by price level, for a specific instrument. Depth of...
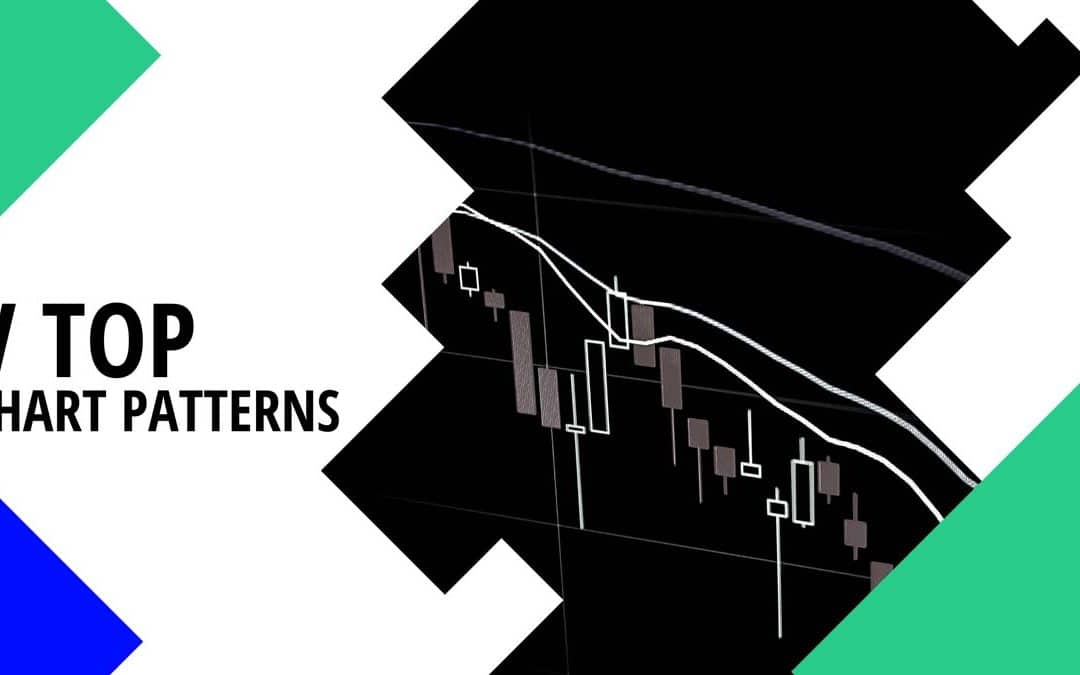
What is V Top Chart Pattern? The V-top derives its name from the inverted V-shaped pattern. It comes up when price momentum changes from an aggressive purchase to an aggressive selling state. This formation is a powerful bearish reversal chart pattern and shows up in...
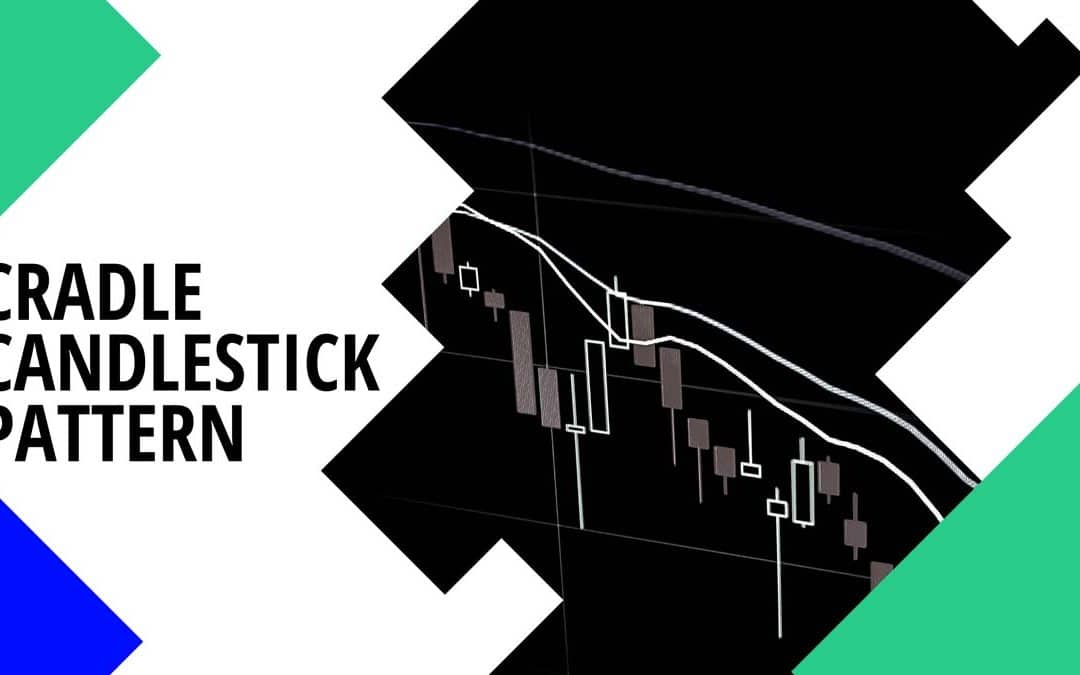
What is the Cradle Pattern? To adequately understand candlestick patterns, you must have had a good understanding of Japanese candlesticks and all their attributes. Ideally, cradle patterns should be an indication of reversal of the recent trend. It usually takes...
What is Guppy Multiple Moving Average (GMMA)? GMMA is an acronym for Guppy Multiple Moving Average and it is one of the momentum indicators and technical trading tools. Let's deep dive into the GMMA indicator! The Guppy Multiple Moving Average attempts to predict a...
What is a V-bottom Chart Pattern? The v-bottom pattern got its name from the v-shaped pattern. This pattern comes up when price momentum moves from an aggressive selling to an aggressive buying condition. Quick signal that a v-bottom is appearing would be the...
What is Raindrop Candle? Raindrop candle charts are a recent form of a financial chart. They enable you to see how the market is doing from a unique angle. Raindrops form by using similar market data as Japanese candlesticks but add volume into the final image,...
The lines that we draw at an angle above or below the price are trend lines. These lines are used for giving indications if any trend is immediate. Moreover, they also indicate whether the trend has changed or not. These lines are used as resistance and support and...
The world of trading presents very difficult as well as tricky puzzles that traders are required to solve. Now, traders who don't know how to solve those puzzles far more than often end up losing their money. Conversely, the gurus and master puzzle solvers can...
We are here to make your investment more predictable. What is the j hook pattern? We are going to tell you over here. A vast benefit to the investors is by Candlestick signals. It helps the investors when they pinpoint the finest trades in the marketplace. The...
Understanding candlesticks is crucial for trading and long wick candles or rejection candles are even more crucial. Why so? Because long wick candles indicate a reversal of the current market trend. And understanding when the current market trend is going to end and...
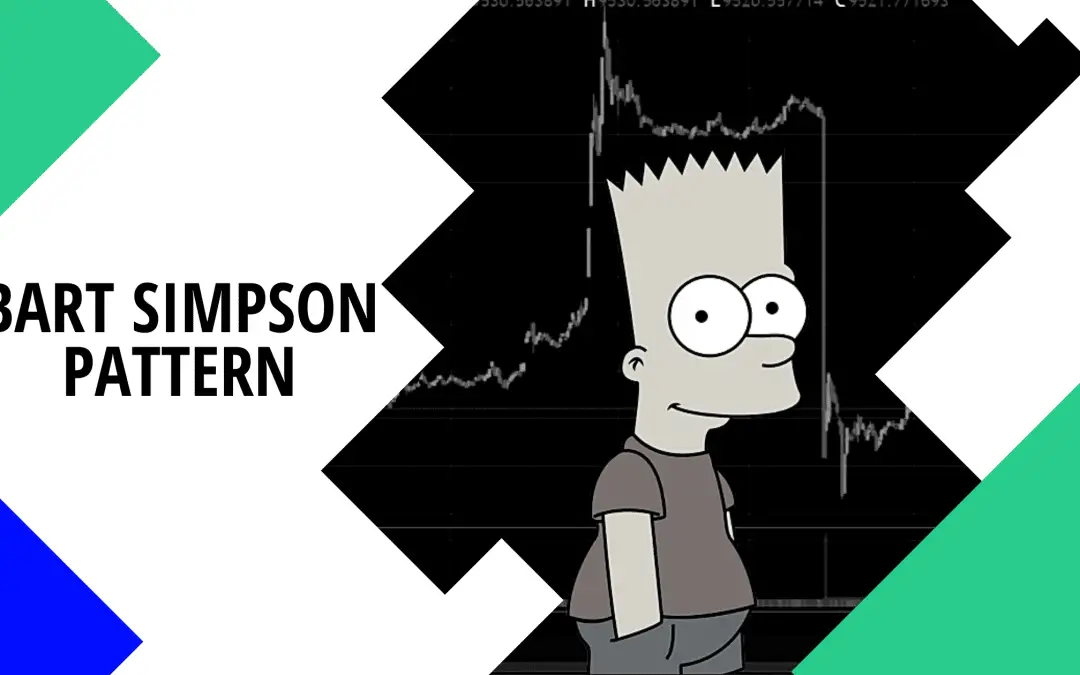
Bart Simpson Pattern has emerged as a very unpleasant but important pattern in cryptocurrency trading. In fact, any discussion regarding Bitcoin price doesn't conclude without this mystic pattern. But what is this Bart Simpson Pattern? Why do we observe this Bart...
There are different types of candlestick patterns. But when we talk about above the stomach evolves over a period of almost two sessions. In this pattern, the existing downtrend is there. And it appears at the bottom of any downtrend. Brief Review about Above the...
What is Failed Head and Shoulders Pattern? This article has answers to all your questions over here. A piece of exchanging productively is to work out the gamble and likely prize of each exchange that you make. A few exchanges simply don't offer sufficient potential...
Are you a trader with a small capital and looking to capitalize on the first green day pattern? Or, are you just enticed by the first green day pattern and want to know all about it? Whatever it is, you are on the right platform. We are going to share with you what...
Do you want to know about flat top breakout? We will tell you about it over here. Active investors use Breakout trading for taking place within a trend's early stages. The strategy is of starting point for foremost moves in prices. Moreover, it adds the growths...
Cat’s Ears Pattern is a double top pattern and also considers as one of the rarest patterns. The traders often confuses about the trades and make the most accurate predictions. They try to focus on making the possible scenarios for trading. At the beginning of...
Measured move trading is one of the best techniques to deal with the challenging task of determining a suitable profit target. Determining a realistic and suitable profit is crucial for profitable trading. However, most traders find it difficult. They often set...
The outside day is a simple two-bar pattern that traders must need to know. It is a useful pattern to spot the reversal of the current trend in the market. In fact, this is a very reliable reversal pattern, especially when they form after a very clear uptrend or...
Knowing more about trendline and trendline breakout is the key to successful and profitable trading. Trendline analysis is one of the most basic technical analysis techniques. Therefore, it is important to learn about it. Additionally, trendlines also offer the...
Financial luminaries and market wizards like Warren Buffet and Ben Graham have made millions by using deep value investing. This remarkable strategy has become quite popular these days but why? What is this strategy and how to buy bargains with insane potential using...
In this article, we are going to discuss all about the Wolfe Wave trading pattern. Keep reading to learn this pattern’s definition, its formation, and ultimate trading strategy. Wolfe Wave trading pattern is among the most effective chart patterns. Therefore,...
Trading Volatility Contraction Pattern is one of the most popular trading strategies. This pattern is among the most reliable patterns for trading and it has proved itself timeless. Given the importance of the Volatility Contraction Pattern in trading, we...
Strategy tester tools are software that helps traders to test their strategies. Such tools use historical data to help traders test their strategies. These are important tools because they empower you to check the effectiveness of your strategies before application....
A spike chart is a very unique phenomenon in trading that refers to huge upward or downward movements of prices on charts in a very short period. In other words, a large and sudden upward or downward movement of price. Experienced traders use spike charts to make...
The Relative Strength Index (RSI) and Stochastic are both useful indicators but what if we look at RSI vs Stochastic debate? In fact, everything has disadvantages or weaknesses despite having advantages and strengths. That's why this RSI vs Stochastic comparison must...
Day trading indicators are tools that help day traders make informed trading decisions. As you know, day trading is a difficult type of trading. Therefore, you need the latest and most helpful tools to make your endeavor a bit easy. However, it is important to choose...
Forex trading indicators are tools used by traders to analyze market trends. They also help traders in making informed decisions on when to buy or sell a currency pair. If you want to know about the best forex trading indicators, then you are on the right...
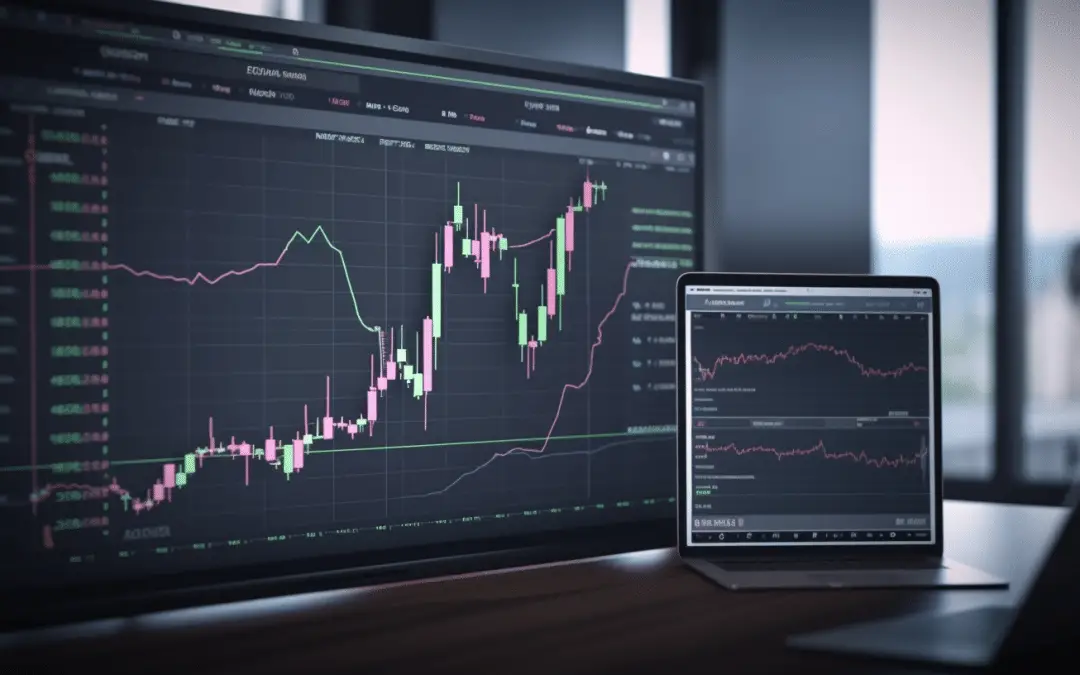
The power of confluence in technical analysis is remarkable – it brings success. Yes, it brings because it empowers you to make informed trading decisions. How so? It does so by providing multiple trading signals in the same direction. So, what is confluence in...
Time-Weighted Average Price (TWAP) is a powerful and highly useful algorithmic trading strategy. It seeks to reduce market impact and trading costs by executing trading orders evenly over a specified period of time. If you wanted to discover the benefits of trading...
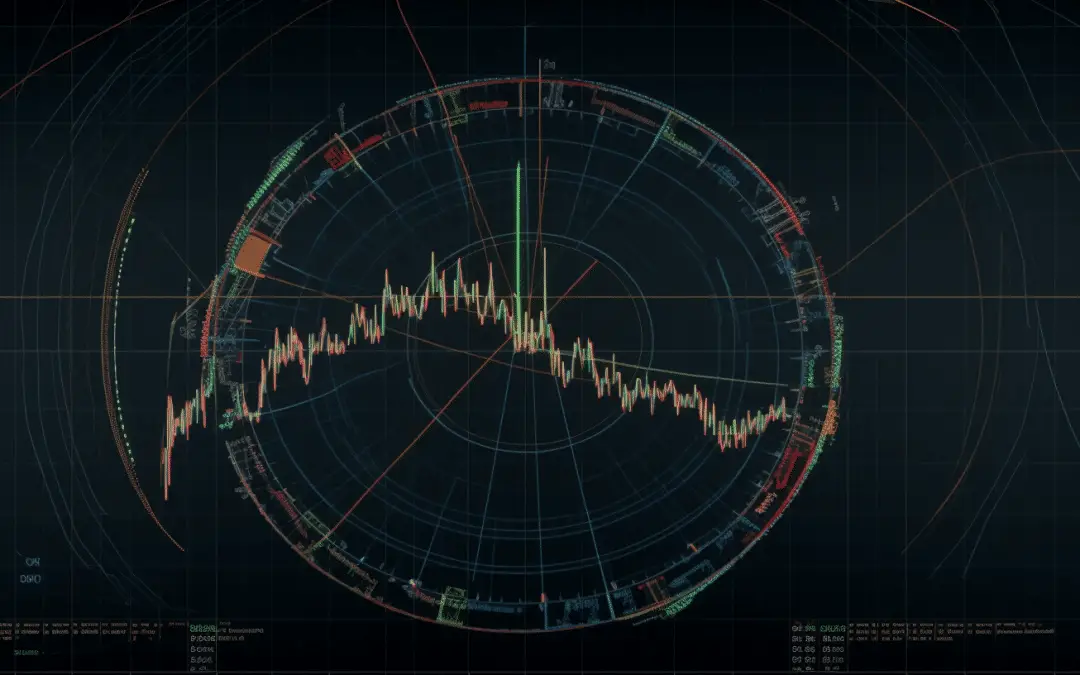
Gann Angles is among the most powerful and useful technical analysis tools. Traders use it to forecast future price movements of financial instruments like stocks, currencies, commodities, etc. According to the Gann Angles idea, price and time are interrelated....
The Golden Cross and Death Cross are among the top technical analysis tools. In fact, these two powerful tools have it all to help you capitalize on market trends and improve your trading performance. Therefore, it is worthwhile to master the art of trading with these...

PS: Get 20% off with the code SAVE20
Get “Every Candlestick Patterns Statistics”, The Last Trading Book You’ll Ever Need! 📖

Pre-register now and receive the candlestick patterns statistics ultimate ebook for free before anyone else!
"All you need is one pattern to make a living."
- Linda Raschke