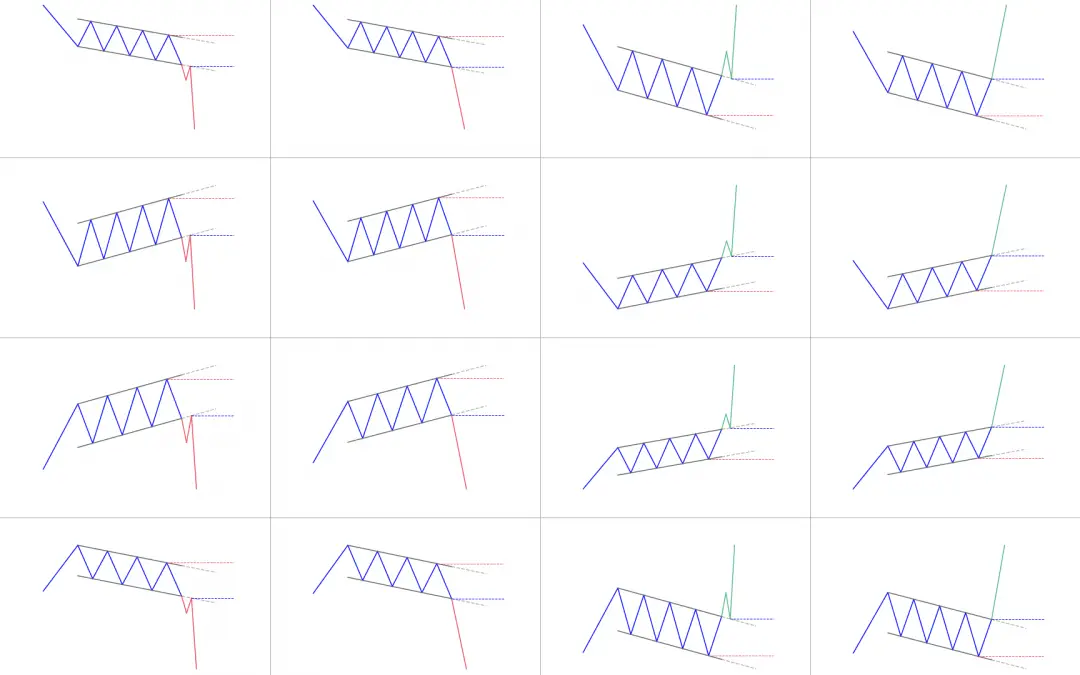
Did you know there are about 100 different types of chart patterns?
They come in different shapes and sizes but they all share something in common : they are a key part of technical analysis and to be able to use them you first need to recognize them.
Every chart pattern detailed with their performance and reliability stats
Below you’ll find the ultimate database with every single chart pattern. You’ll find detailed articles for each going into detailed explanation, giving you examples and data for each pattern. No more doubt about what makes a specific pattern and how well it works.
Moreover, this extensive cheat sheet will definitely give you an edge and let you understand and recognize every pattern. Plus at PatternsWizard, our absolute focus is to bring you data-driven performance statistics. So for most patterns (articles below) you’ll find data about each pattern’s performance statistics and reliability (how often they confirm, reach the target or stop, how often they appear, …) to adjust your trading strategy of financial markets.
What are chart patterns?
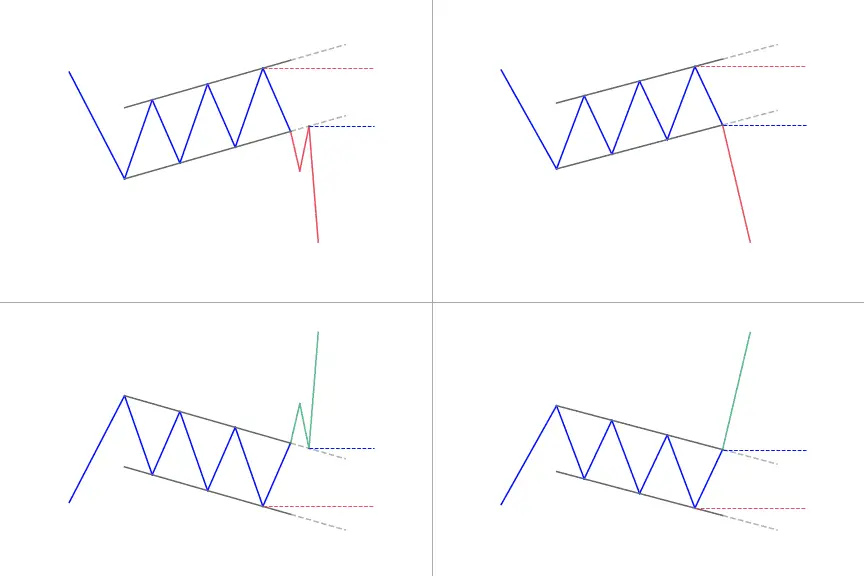
Chart patterns are unique formations formed by changes in the price of securities on the price chart. They are the basis of technical analysis.
There are several types of patterns: classic patterns, candlestick patterns and harmonic patterns. As a result, each type has its own specificities. Identify patterns by lines that connect common price points (such as closing prices or high or low points) within a specific time period.
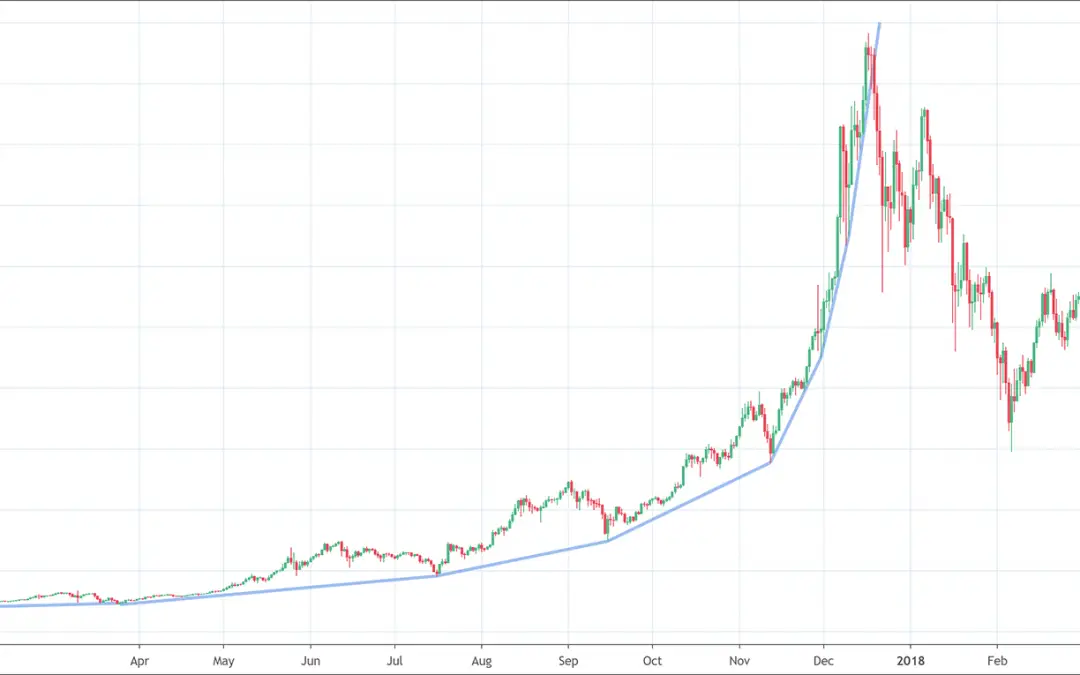
Technical analysts and chart experts seek to identify patterns to predict the future direction of security prices. These patterns can be as simple as a trend line or as complex as a double head and shoulders pattern.
What are the three big categories of chart patterns?
There are three main categories that classify the chart patterns:
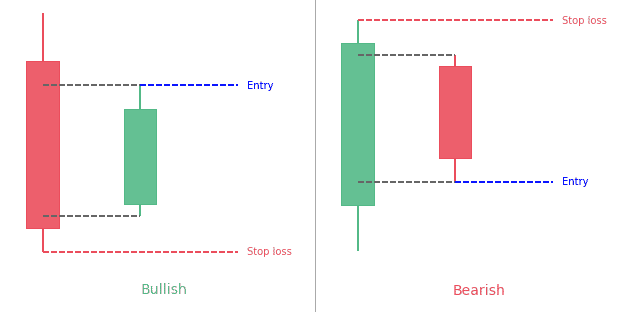
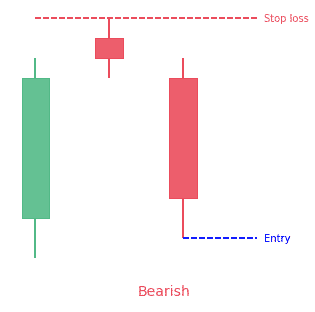
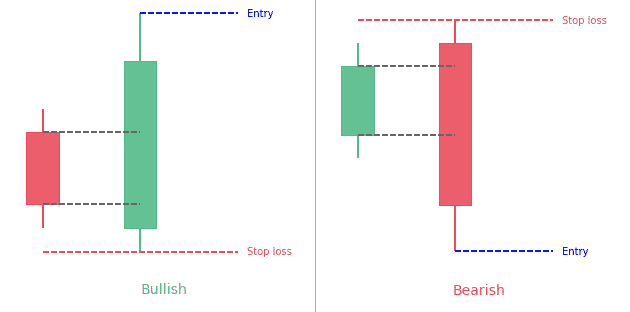
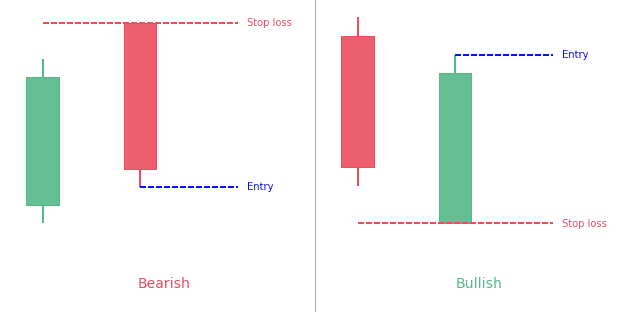
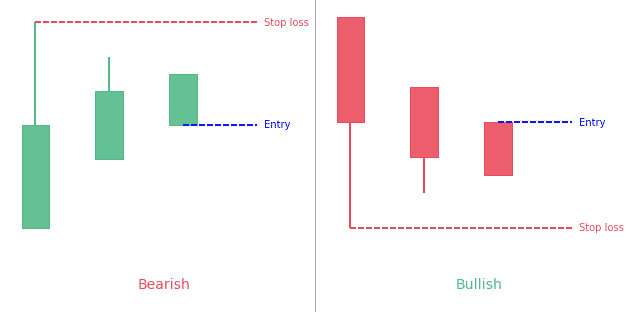
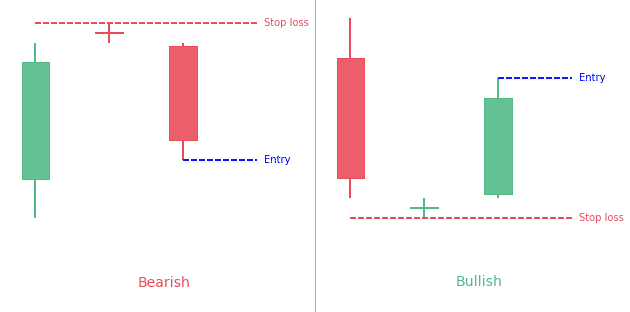
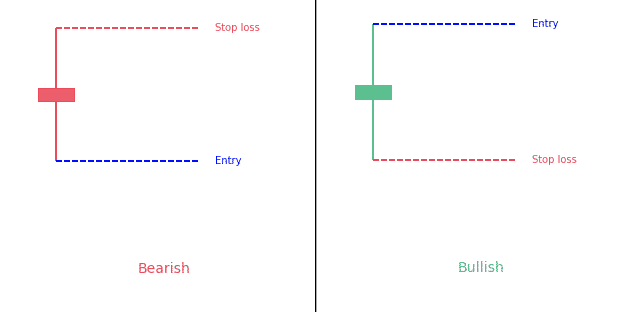
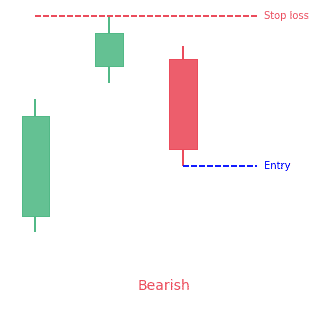
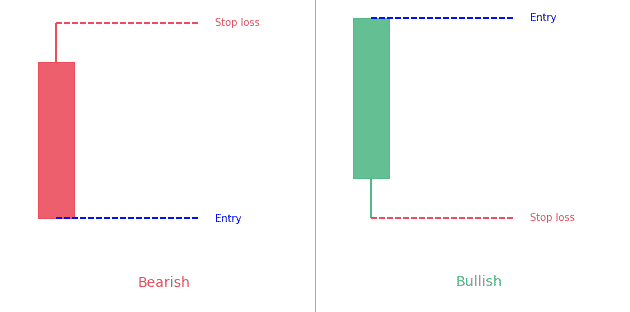
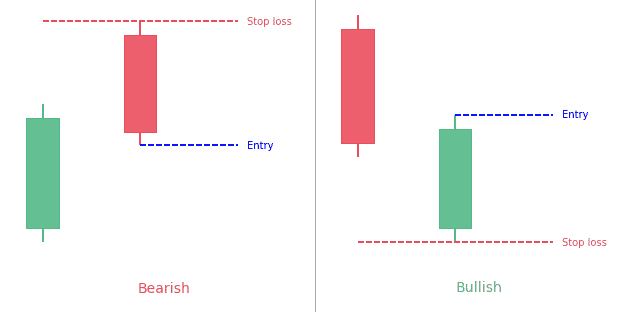
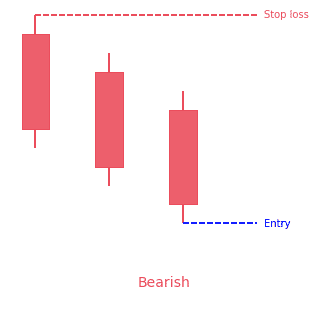
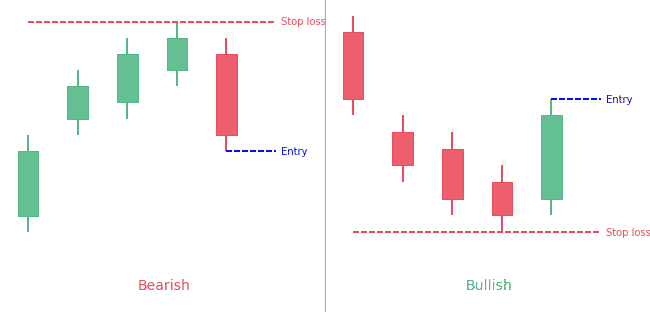
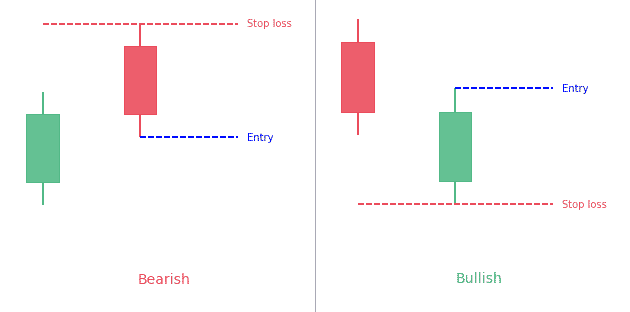
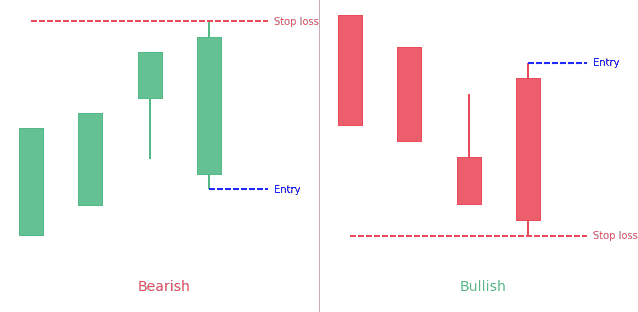
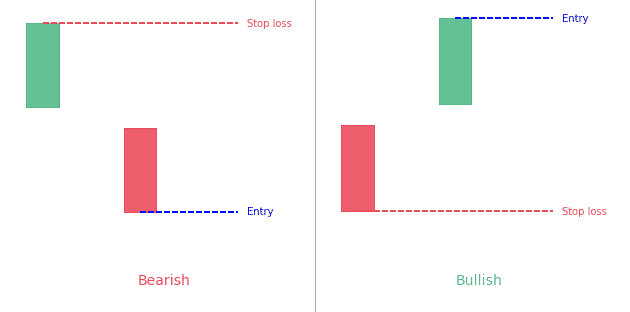
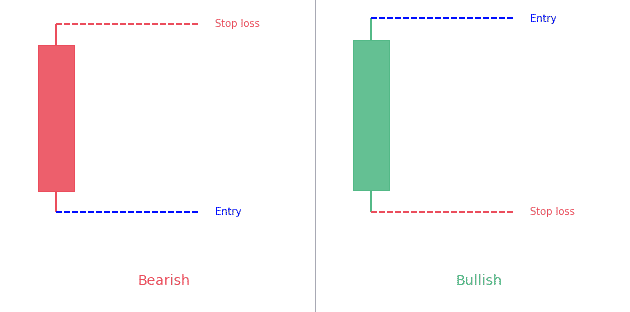
- Candlestick chart patterns : they are aggregates of candlesticks (usually 1 to 5). Some famous ones are the harami, stick sandwich, advance block.
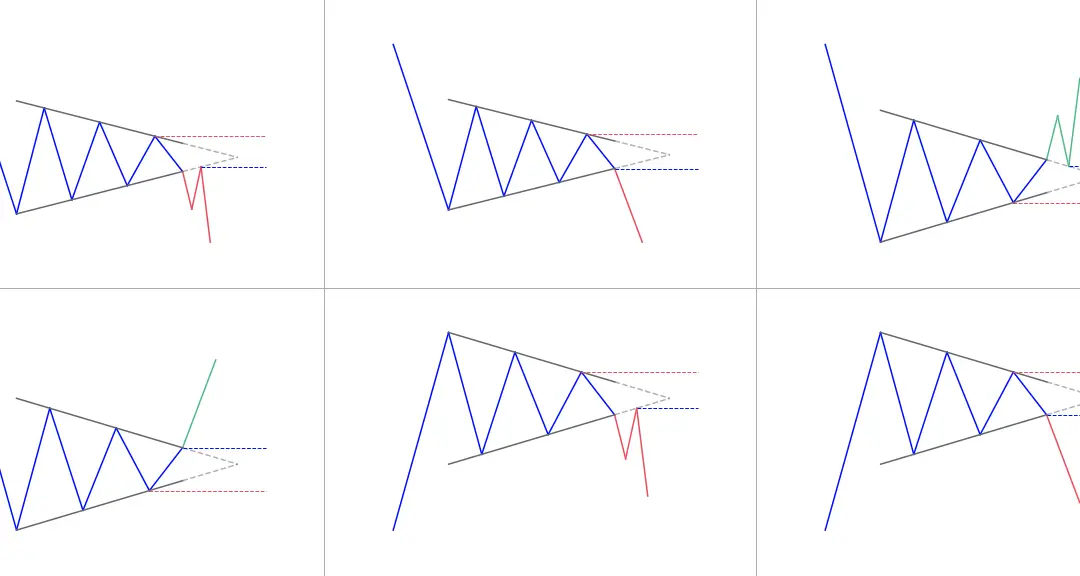
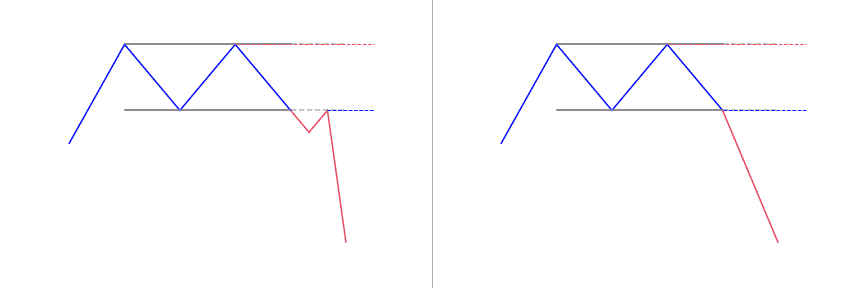
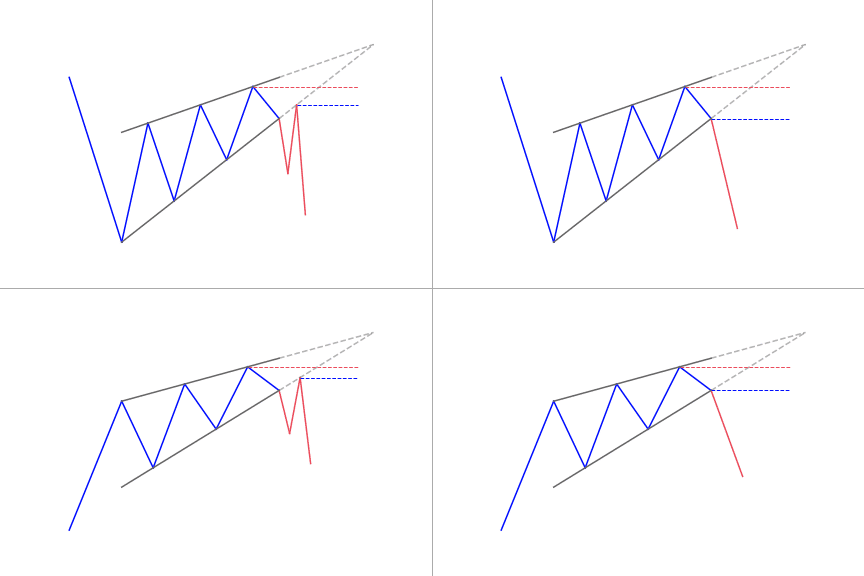
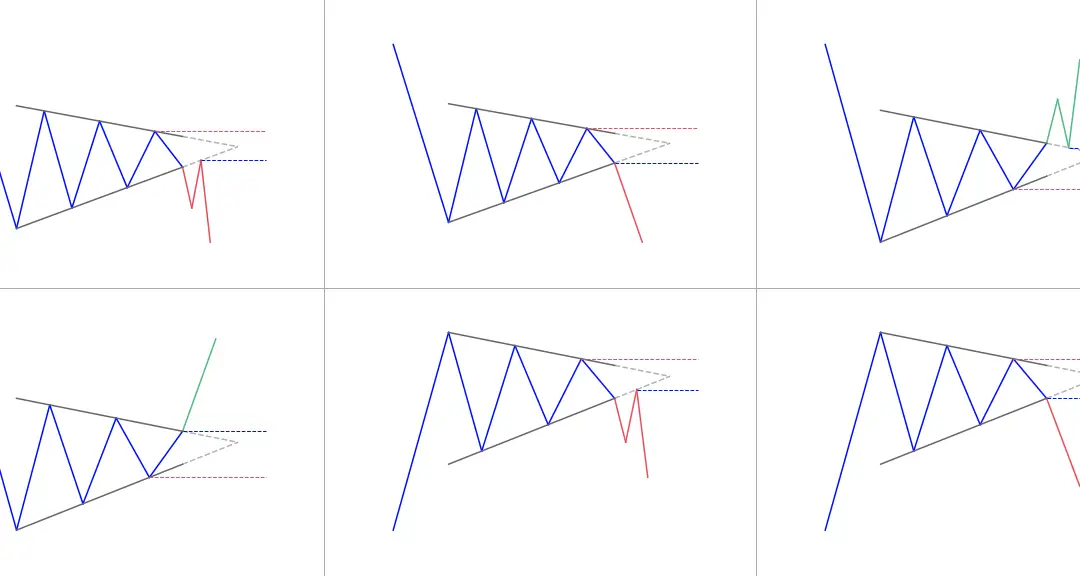
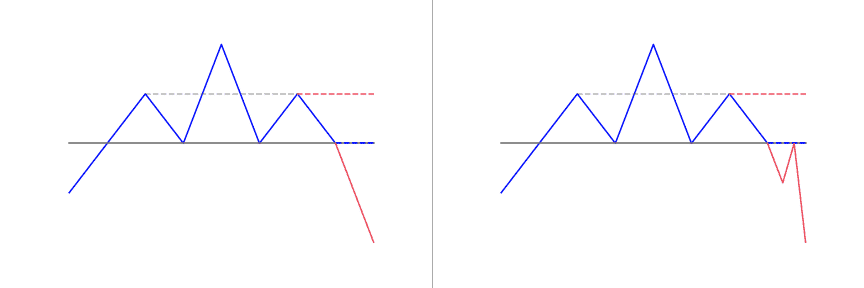
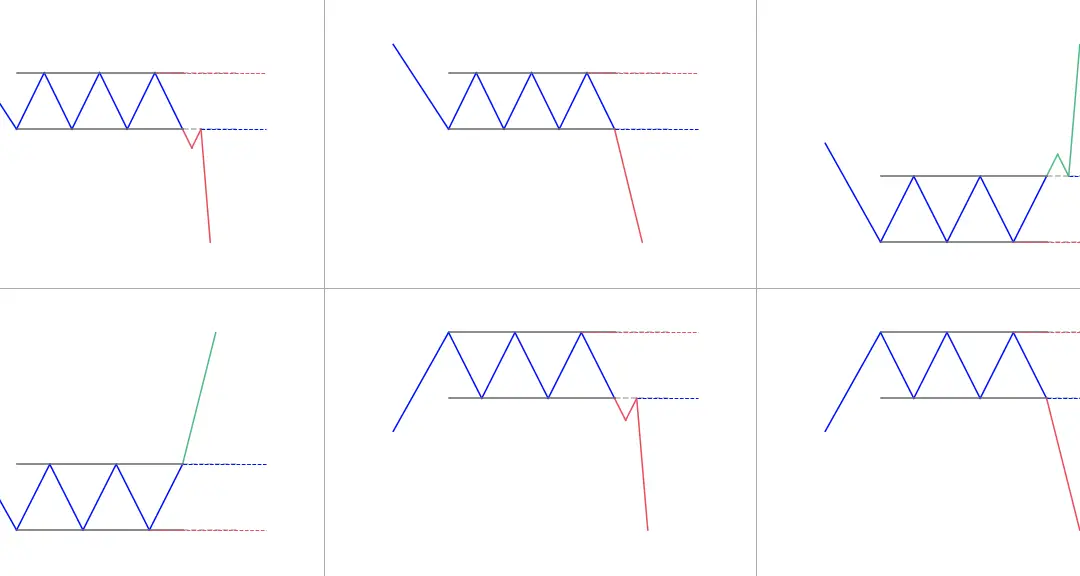
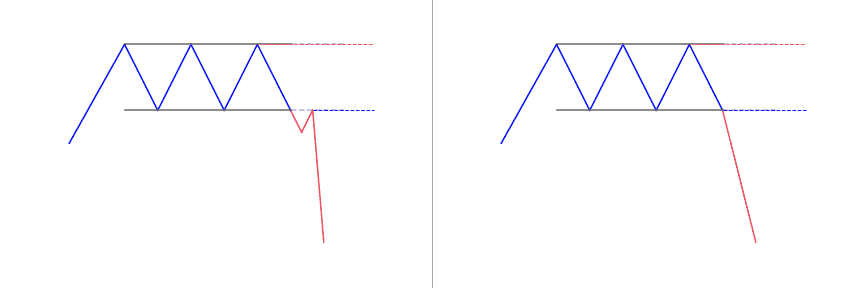
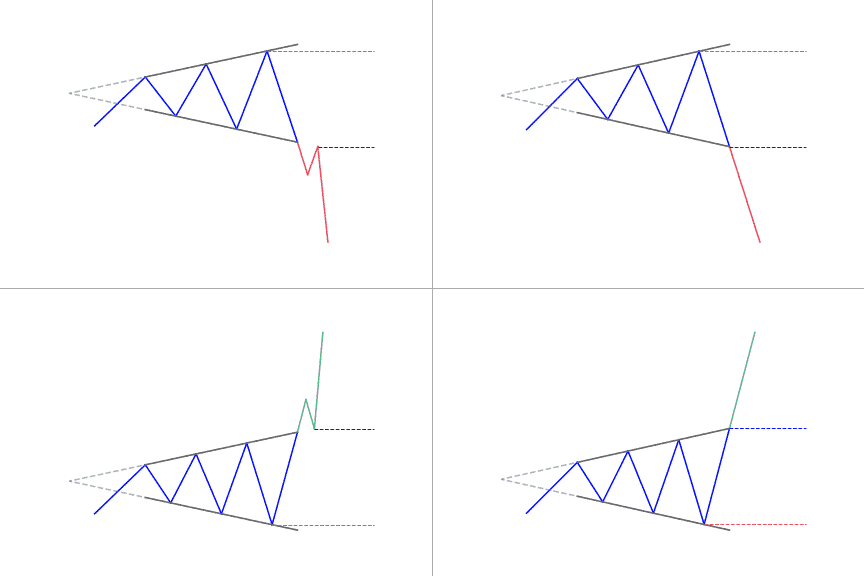
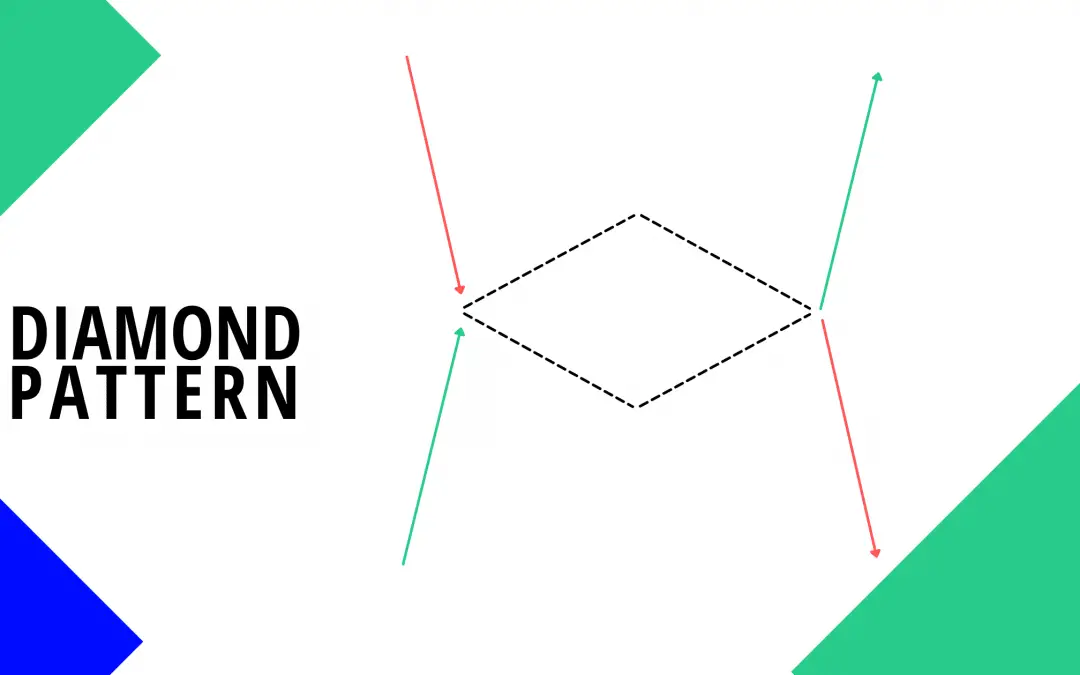
- Classic / traditional / common patterns : they often represent some mathematical shapes like symmetrical triangles, bullish flag patterns, head and shoulders or the wedge pattern.
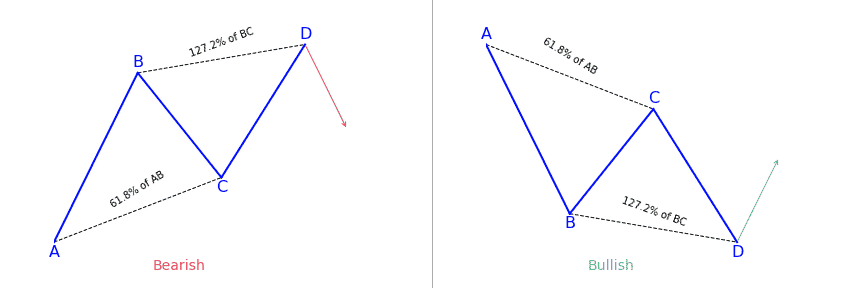
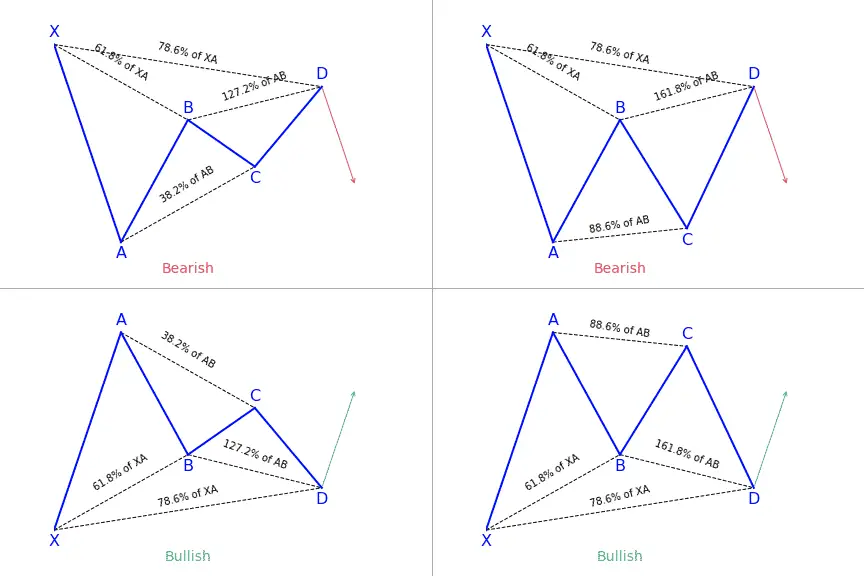
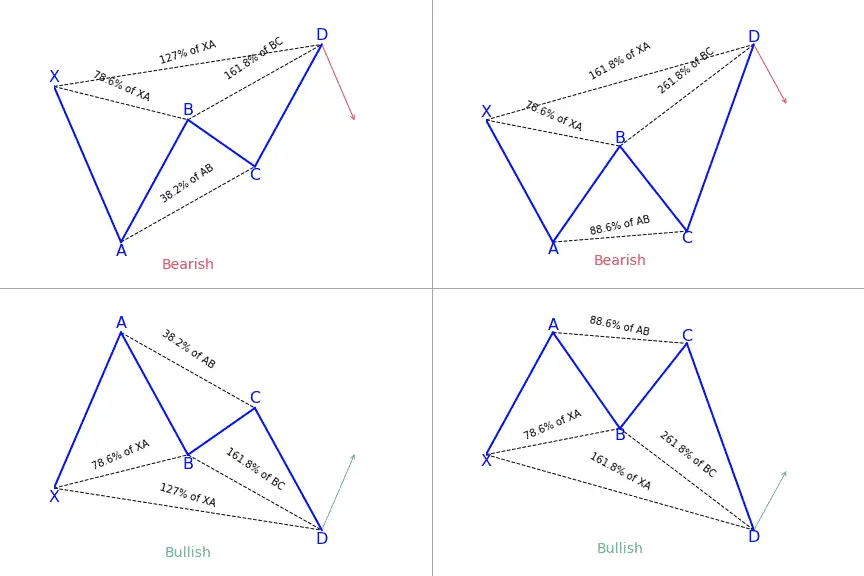
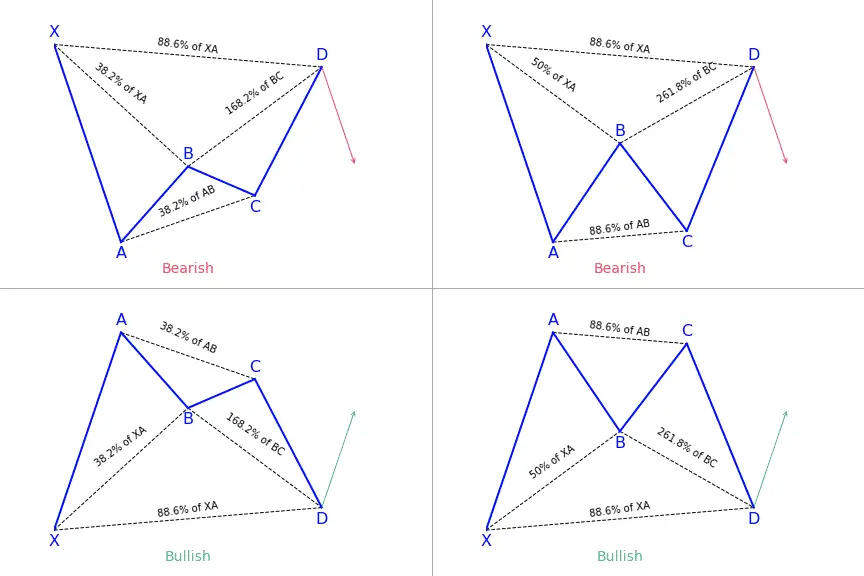
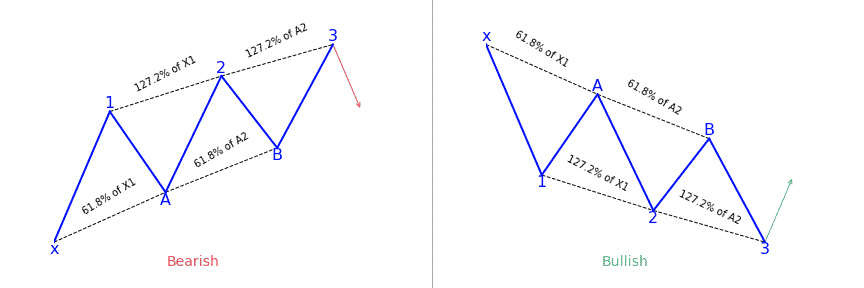
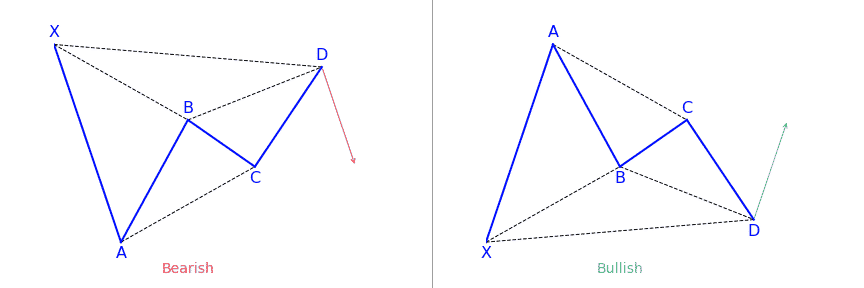
- Harmonic patterns : they are created with several legs linked together with mathematical ratios (Fibonacci levels) for price levels.
Each of these patterns have very strict requirements. To help you easily get your hands on each pattern we detailed them in their own article with everything you should know.
Of course, you can use these patterns in conjunction together, with other indicators or locations (resistance levels or resistance lines) to enhance your hints about future price movements before you take a trade.
How can they help you enhance your trading strategy?
Depending on the pattern (each pattern can tell a different story), they can be a hint for :
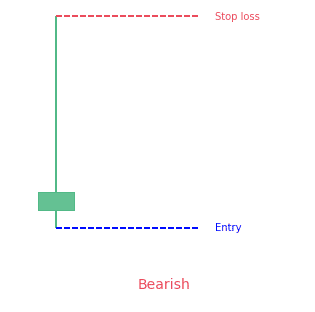
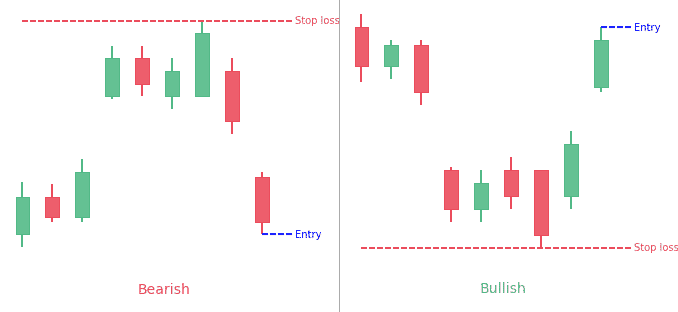
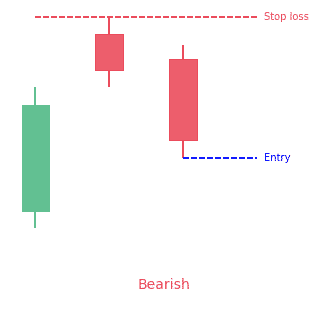
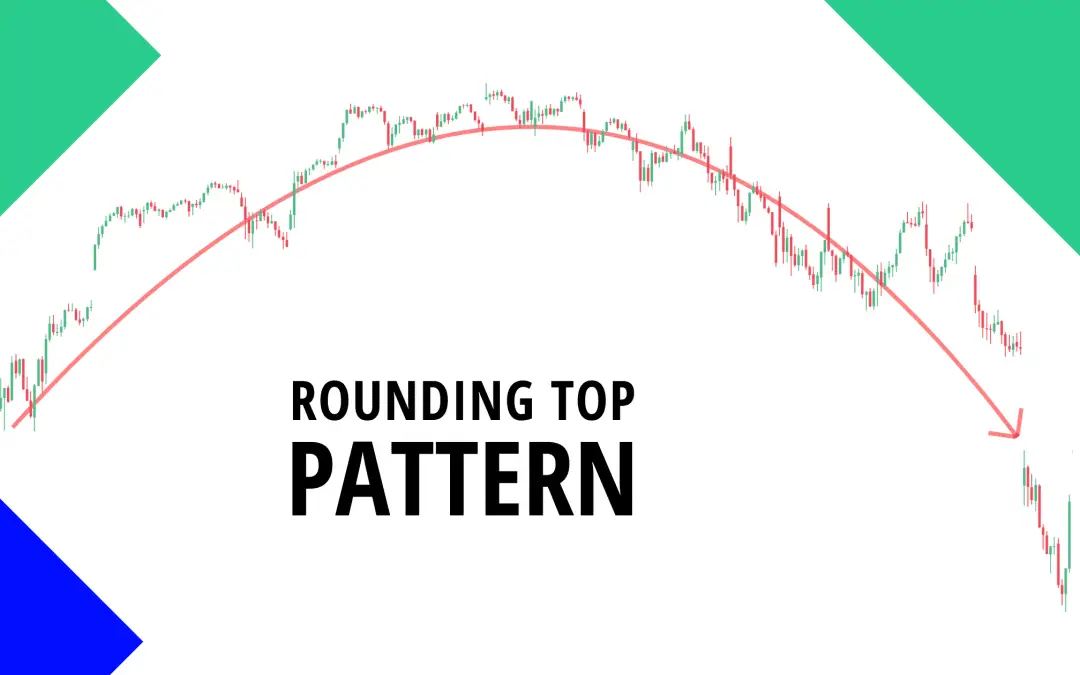
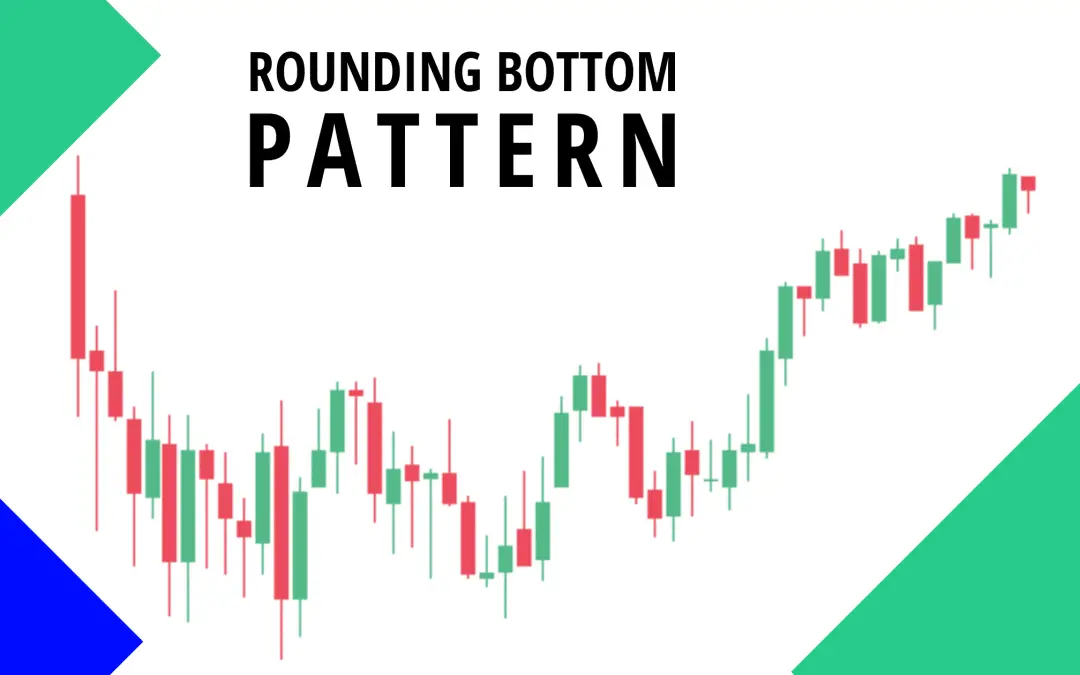
- Reversal patterns : it predicts price will reverse and move in the opposite direction. These reversal chart patterns help spot trend reversals.
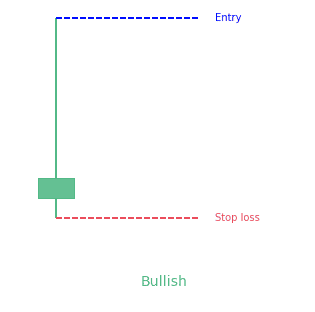
- Continuation patterns : it predicts price will continue its move in the same direction.
Regardless of the pattern(s) you’d like to hunt and trade, you’ll need a reliable source to chart your markets. TradingView is the best solution for you! As you may have noticed, most of our charts on the site are taken from charts created on TradingView. Click here to check TradingView for free now!
Want to go into the details of a specific pattern? You’re at the right place!
These patterns often have very imaginative names. Feel free to discover the detailed article for each chart pattern right below :
 Good Trading requires the Best Charting Tool!
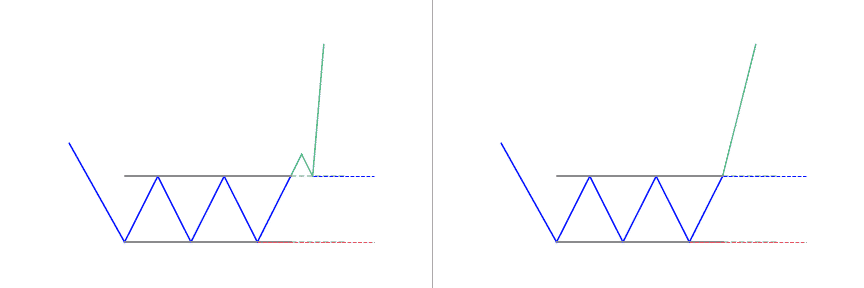
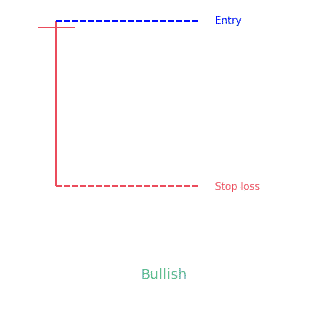
![Ascending Triangle Pattern: Full Guide [2022]](https://patternswizard.com/wp-content/uploads/2020/05/ascendingtriangle.png)
![Dark Cloud Cover Candlestick Pattern: The Ultimate Guide [2022]](https://patternswizard.com/wp-content/uploads/2020/05/darkcloudcover-bearish.png)
![Falling Wedge Pattern: Ultimate Guide [2022]](https://patternswizard.com/wp-content/uploads/2020/05/fallingwedge.png)
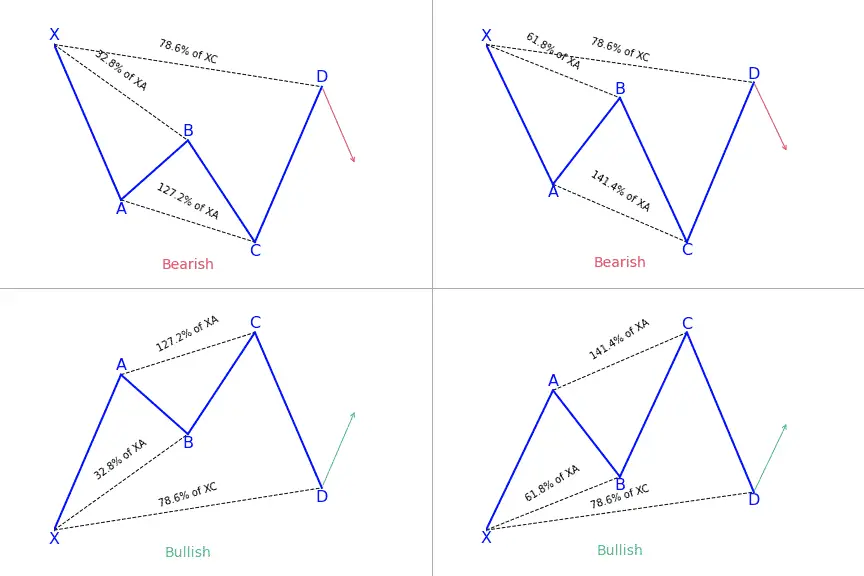
![Crab & Deep Crab Harmonic Pattern: The ultimate guide [2022]](https://patternswizard.com/wp-content/uploads/2020/06/crab.png)
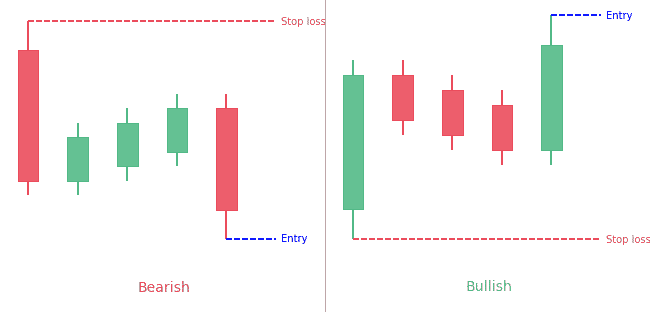
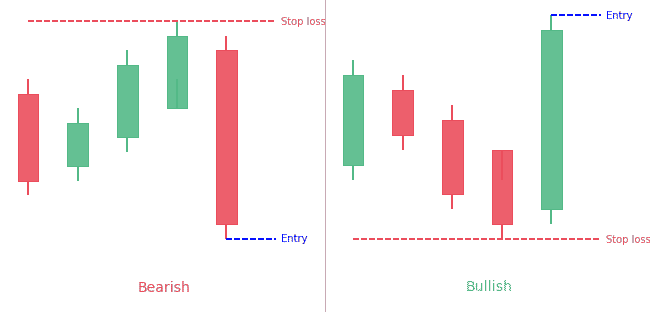
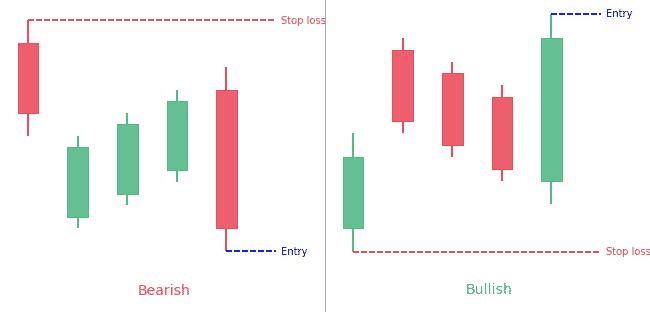
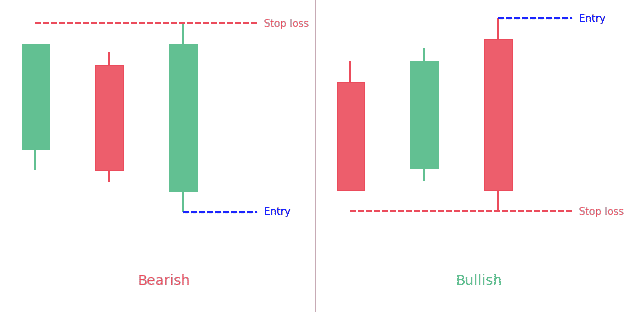
![Three-Line Strike Pattern: Complete Guide [2022]](https://patternswizard.com/wp-content/uploads/2020/06/threelinestike.png)
![Shark Harmonic Pattern: Full Guide [2022]](https://patternswizard.com/wp-content/uploads/2020/06/shark.png)
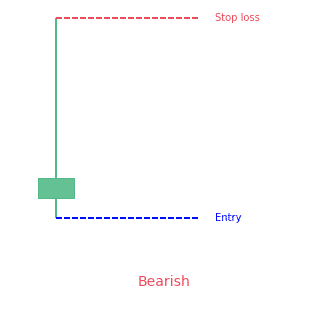
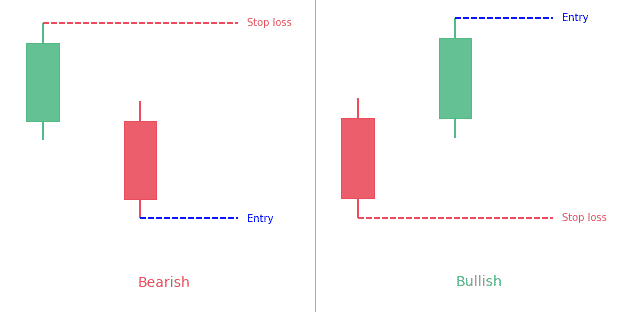
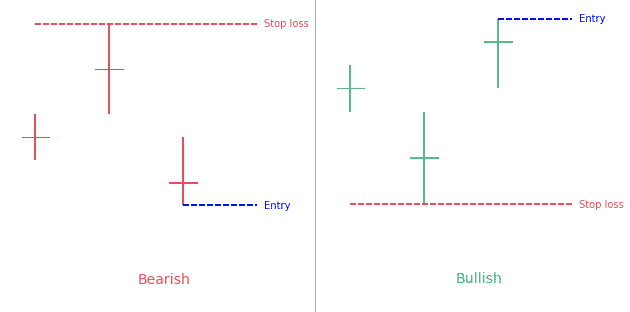
![Key Reversal Bar Pattern: Complete guide [2022]](https://patternswizard.com/wp-content/uploads/2020/06/keyreversalbar.png)
![5-0 Harmonic Pattern: Complete guide [2022]](https://patternswizard.com/wp-content/uploads/2020/06/5-0.png)


 We loved Marwood Research’s course “Candlestick Analysis For Professional Traders“. Do you want to follow a great video course and deep dive into 26 candlestick patterns (and compare their success rates)? Then make sure to check this course!
