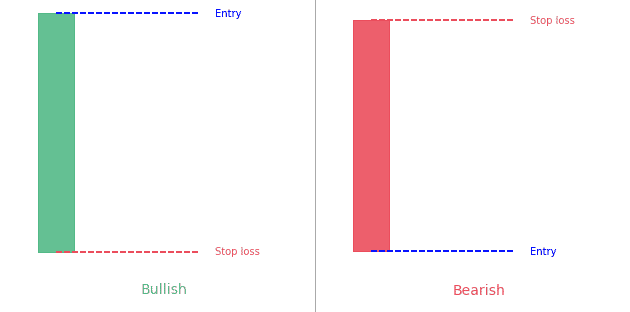
Key takeaways A marubozu candle only has a body. It doesn't have wick or tail.Bullish marubozu is a long green body candleBearish marubozu is a long red body candle Statistics to prove if the Marubozu pattern really works What is...
Did you know there are more than 60 candlestick patterns?
They come in different shapes and sizes but they all share something in common : they are made of 1 to 5 candlesticks (I know you surely guessed it from its name).
Below you’ll find the ultimate database with every single candlestick pattern (and all the other types of pattern if you are interested). Here there are detailed articles for each candlestick pattern. Each article goes into detailed explanation, gives you examples and data. No more doubt about what makes a specific pattern and how well it works.
This extensive cheat sheet will definitely give you an edge and let you understand and recognize every pattern. Plus at PatternsWizard, our absolute focus is to bring you data-driven performance statistics. So for most patterns (articles below) you’ll find data about their performance and reliability (how often they confirm, reach the target or stop, how often they appear, …) to adjust your trading strategy.
Candlestick patterns are part of a way to represent market prices : the candlestick charts.
The best way to chart candlestick is using the TradingView solution. It lets you chart candlestick and all other charting types and you can try it now for free.
A candlestick is a way to represent an aggregation of all the prices traded for a given time period. It can for example aggregate a full trading day of prices. During this time period (which can take any value, from 1 minute to a few months), instead of showing every single price traded, a candlestick will only show 4 price values :
The area inside the open and close is the body. It’s often represented as filled and is either green or red depending on whether the market was bullish (went up) or bearish (went down). Outside of the body are the wick and tail (or sometimes called upper shadow and lower shadow). The upper shadow is from the body top to the highest price, the lower shadow is the opposite. They can create bullish candles or bearish candles. Candles help traders understand how the buying and selling pressure is applied during the given time interval.
Depending on the pattern (each pattern can tell a different story), they can be a hint for :
To learn more check out our candlestick chart article or signup to Joe Marwood’s course “Candlestick Analysis For Professional Traders” (he has more than 40k followers on Twitter so he knows what he talks about). He’ll tour you around with videos about the backtesting of 26 candlestick patterns.
Want to go into the details of a specific pattern. You’re at the right place!
These patterns often have colorful names. Feel free to discover the detailed article for each candlestick pattern right below :

Key takeaways A marubozu candle only has a body. It doesn't have wick or tail.Bullish marubozu is a long green body candleBearish marubozu is a long red body candle Statistics to prove if the Marubozu pattern really works What is...
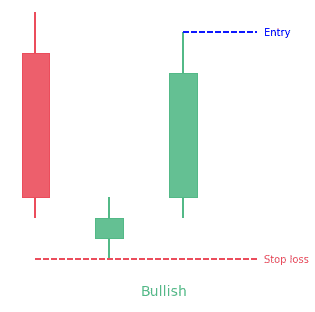
Key takeaways A morning star pattern is a bullish 3-bar reversal candlestick patternIt starts with a tall red candle, then a small candle and finishes with a tall green candleThe middle candle reports indecision in the marketThe opposite pattern is the evening star...
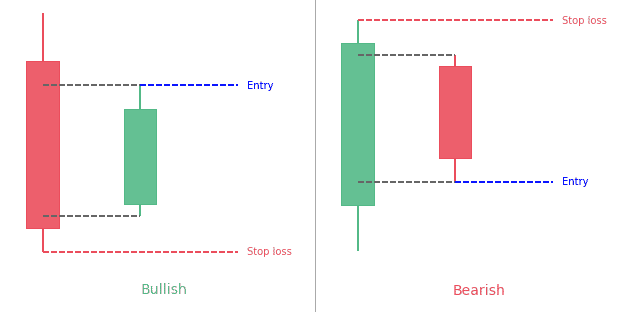
The Harami pattern is a 2-bar reversal candlestick patternThe 2nd bar is contained within the 1st one Statistics to prove if the Harami pattern really works What is the Harami candlestick pattern? Even though the word Harami appears...
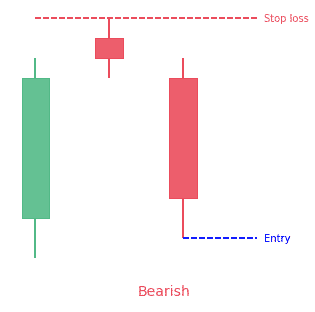
An evening star pattern is a bearish 3-bar reversal candlestick patternIt starts with a tall green candle, then a small candle and finishes with a tall red candleThe middle candle reports indecision in the marketThe opposite pattern is the morning star pattern...
![Dark Cloud Cover Candlestick Pattern: The Ultimate Guide [2022]](https://patternswizard.com/wp-content/uploads/2020/05/darkcloudcover-bearish.png)
The dark cloud cover is a 2-bar bearish reversal candlestick patternIt starts with a green candle The second candle opens above the first one (gap) but then closes below the midpoint of the prior bullish candleBoth candles show be quite large Statistics to prove if...
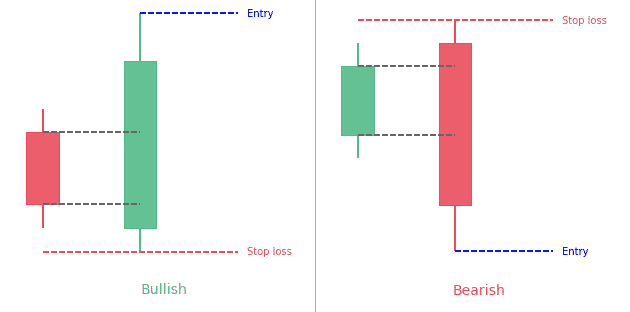
An engulfing pattern is a 2-bar reversal candlestick patternThe first candle is contained with the 2nd candleA bullish engulfing pattern has a red candle engulfed within a green candleA bearish engulfing pattern has a green candle engulfed within a red candle...
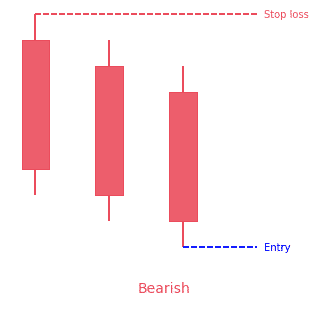
The three black crows is a 3-bar bearish reversal patternThe pattern consists of 3 bearish candles opening above the previous one and closing below the midpoint of the previous candleEach candle should be relatively large to show the strong participation Statistics to...
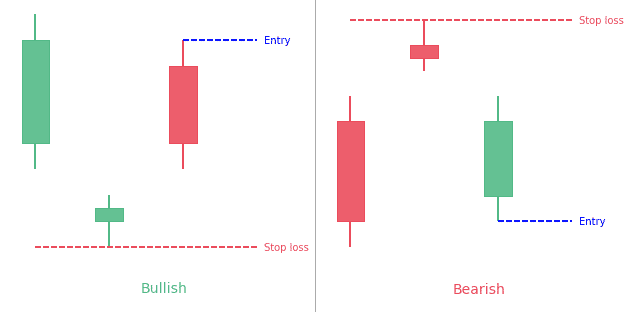
The abandoned baby pattern is a 3-bar reversal pattern.The bullish abandoned baby follows a downtrend. It has a big red candle, a gapped down doji and then a big green gapped up candle.The bearish abandoned baby follows an uptrend. It has a big green candle, a gapped...
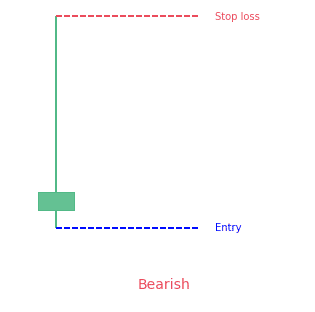
The shooting star is a 1-bar bearish reversal candlestick patternThis formation is bearish because the price tried to rise sharply throughout the day, but then the seller took over and pushed the price down to the opening price Statistics to prove if the Shooting Star...
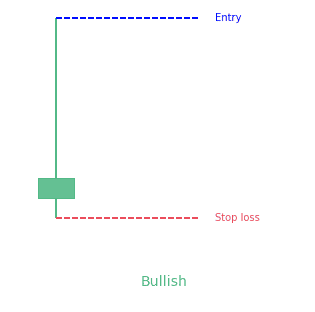
The inverted hammer is a 1-bar bullish candlestick pattern.It looks like a letter "T" upside-down. Statistics to prove if the Inverted Hammer pattern really works What is the Inverted Hammer candlestick pattern? As far as the...
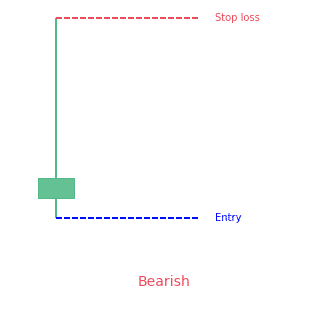
The Gravestone Doji Candlestick Pattern is one of the fabulous and versatile patterns in trading. It an interesting bearish trend reversal candlestick pattern. Some traders, use this pattern in their daily lives to learn about the feel of the market. The article is...
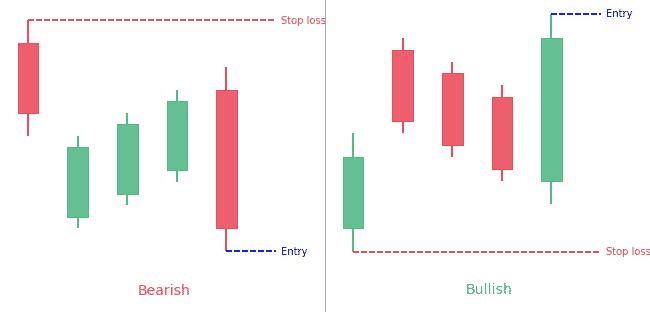
The Mat Hold candlestick pattern is a 5-candle patternIt can be bullish or bearish depending on its formationFor the bullish pattern, there is a tall green candle, 3 small red candles and the last candle is a tall green candle closing above the patternFor the bearish...
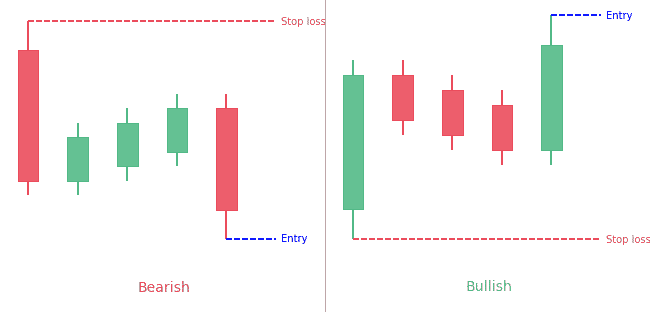
Candlestick patterns have become the preferred method of charting for a lot of traders. Their colorful bodies make it simple to spot market action and patterns that could hold predictive value; they also form patterns that have various meanings. One pattern is the...
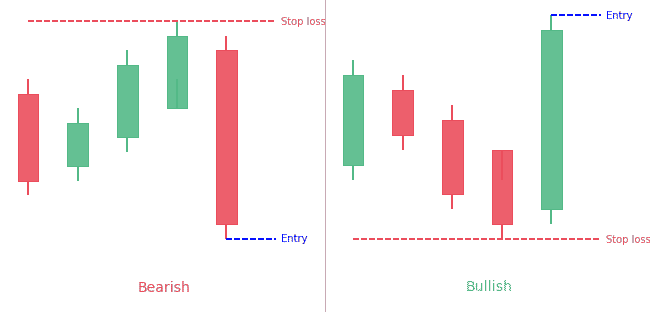
Trading price action usually brings about surprise and excitement at the same time. Price is commonly used as a base for any technical analysis, and the hikkake trading strategy takes in consideration three price action bars to identify the pattern. The pattern looks...
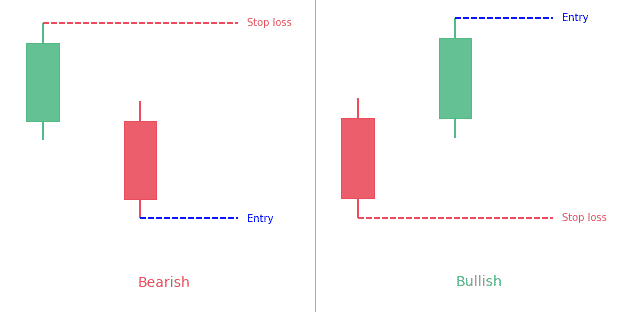
Traders have applied candlestick patterns in analyzing the movement of a market. One of such patterns is the separating lines candlestick pattern. The pattern comes up when there's an uptrend in the market and when there's also a pullback. The separating lines...
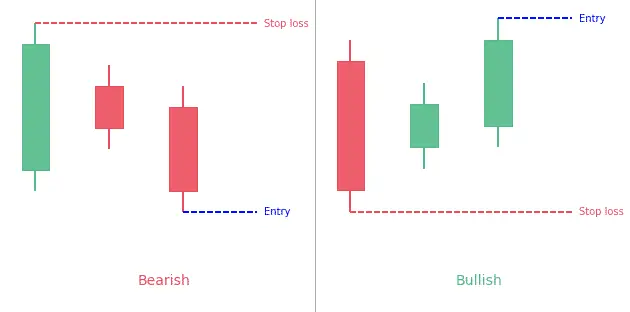
To interpret candlestick patterns, you need to look for particular formations. These candlestick formations assist traders know how the price is likely to behave next. In this article, we will go in-depth into the Three Inside Up / Down candlestick pattern. Some...
![Three-Line Strike Pattern: Complete Guide [2022]](https://patternswizard.com/wp-content/uploads/2020/06/threelinestike.png)
Recognizing patterns is a necessary aspect of technical analysis. Traders should make sure that if they have a moment of doubt, they can act on a situation if they have seen it before. In this article, we will cover in-depth the Three Line Strike candlestick pattern....
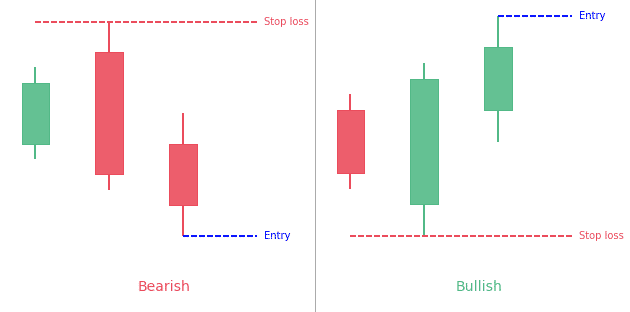
The Three Outside Up & Down candlestick patterns are 3-bar opposite reversal patterns.They are made of one up or down candle and then 2 candles of the opposite color.The second candle contains the first one.The third candle closes over (for the bullish formation)...
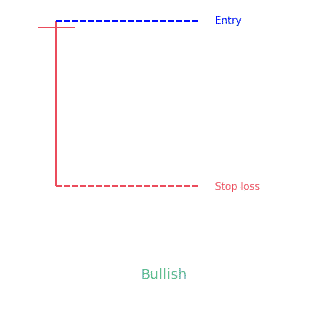
The dragonfly doji candlestick pattern is a 1-candle bullish pattern.It looks like the letter "T".It prints when the candle as a long bottom shadow but (almost) no upper shadow and open and close are almost the same. Statistics to prove if the Dragonfly Doji pattern...
![Key Reversal Bar Pattern: Complete guide [2022]](https://patternswizard.com/wp-content/uploads/2020/06/keyreversalbar.png)
Most times, traders take a 'ready, fire, aim' process to trade which is a backward way of trading. Trade is different from a trade trigger. A trade setup that most traders are always on the lookout for is a key reversal bar pattern combination. It forms when prices...
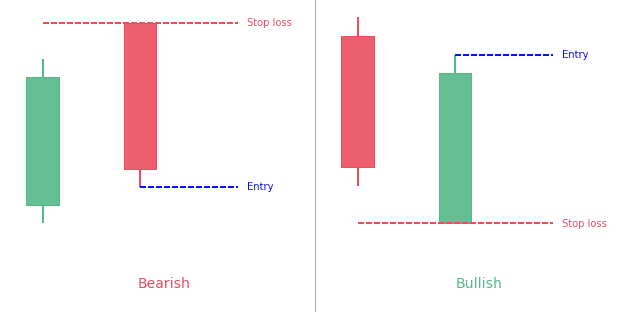
All patterns have a unique tale to tell about market forces that lead to its formation. And traders might benefit by trying to identify what drove the market to where it is now. Knowing exactly why a market carried out a particular move is almost impossible. Having...
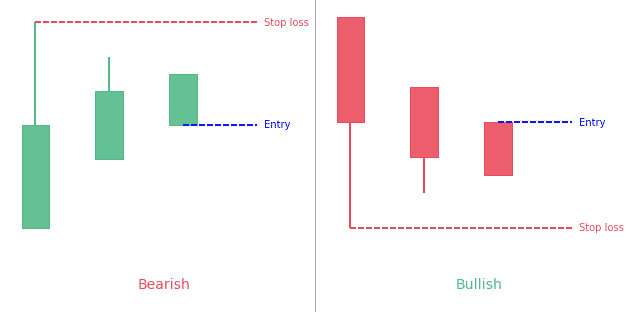
The Three Stars in the South candlestick pattern is a very rare pattern that doesn't typically precede large price moves.The bullish pattern forms with three black or red (down) candles of decreasing size. It usually follows a price decline.The bearish pattern forms...
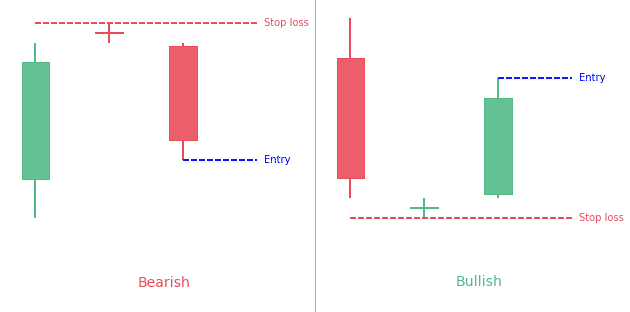
A Doji Star candlestick pattern is a three-bar pattern. It is considered as a signal of a potential upcoming reversal of the current trend of the market. It is a versatile candlestick pattern that is found in two variants, bullish and bearish. Its variants depend on...
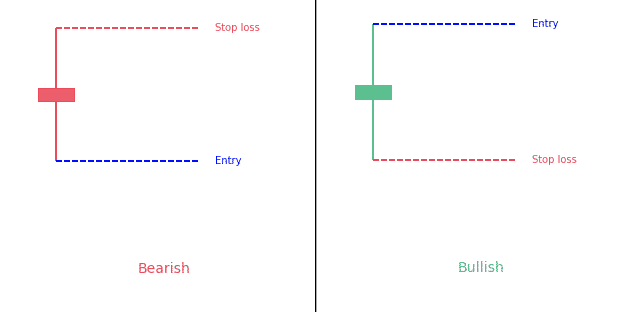
Candlestick patterns that have the same opening and closing price are known as "Doji candlestick pattern". There are four basic types of Doji candles: Four-Price DojiLong-legged DojiDragonfly Doji Gravestone Doji The Doji Candlestick is a 1-bar neutral...
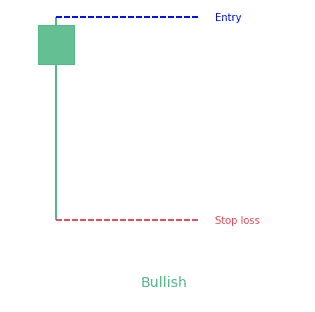
The Hammer candlestick pattern is a bullish reversal pattern that indicates a potential price reversal to the upside. It appears during the downtrend and signals that the bottom is near. After the appearance of the hammer, the prices start moving up. Hammer...
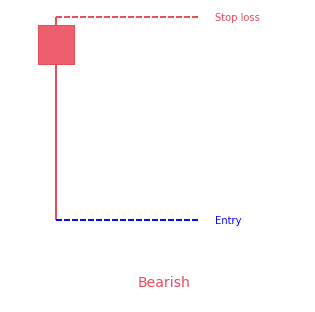
As the name suggests, the Hanging Man candlestick pattern is a bearish sign that appears in uptrends. On occasions, it also tells traders about the upcoming price reversal. The experts of the domain suggest that the Hanging Man pattern must be taken as a warning, not...
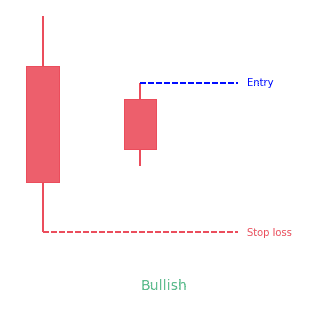
The Homing Pigeon candlestick pattern is a two-line candlestick pattern. Traditionally, traders consider it a bullish reversal candlestick pattern. However, testing has proved that it may also act as a bearish continuation pattern. This new development proves it to be...
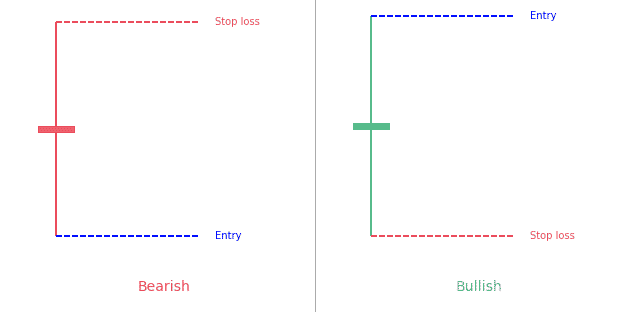
Candlestick patterns are becoming more and more popular these days for charting prices. They are easy to detect with their colorful bodies and black wicks and easy to observe the ways and the behavior of the market. One such popular candlestick pattern is the...
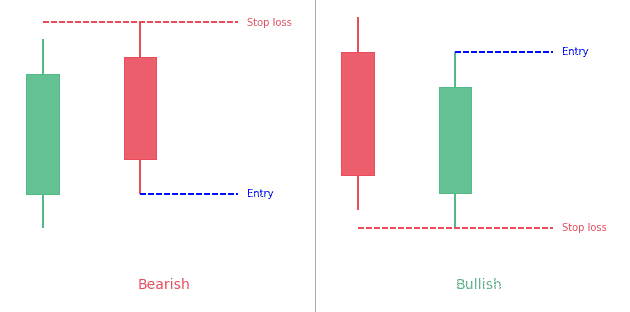
A Piercing line candlestick pattern is a two-day bullish candlestick reversal pattern that appears in a downtrend. It signals a potential short term reversal from downwards to upwards. It consists of two major components, a bullish candle of day 2 and a bearish candle...
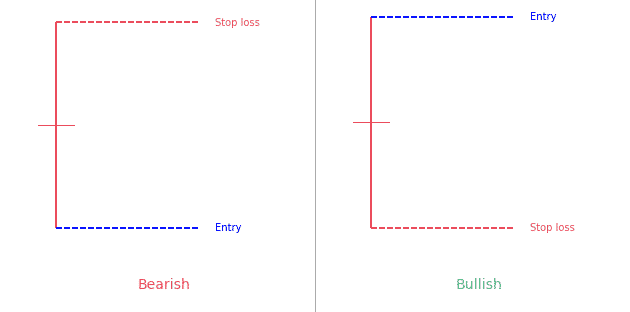
The Rickshaw Man candlestick pattern is very similar to the Long-Legged Doji pattern. A Long-Legged Doji pattern is the one that has a closing and opening price happening at or in the middle of the shadows. The high and low prices are far apart and make very long...
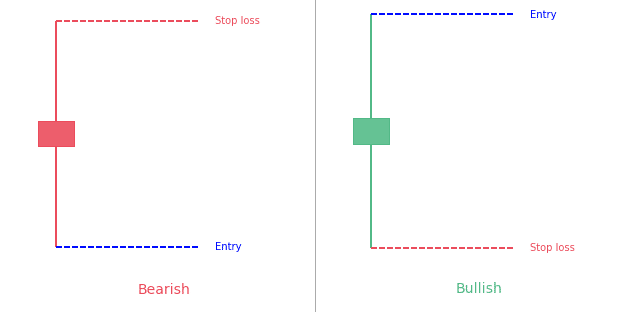
The Spinning Top candlestick pattern is a versatile single candle pattern. It is versatile and mysterious because of its formation that can occur at the peak of an uptrend, in the very middle of a trend, or at the bottom of a downtrend. It is a small candlestick...
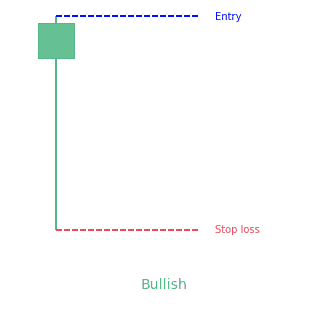
The Takuri candlestick pattern is a single candle bullish reversal pattern. It has a very small body with a much longer lower wick and without an upper wick. This pattern illustrates how a downtrend is opposed by the bulls and the candle eventually closes near its...
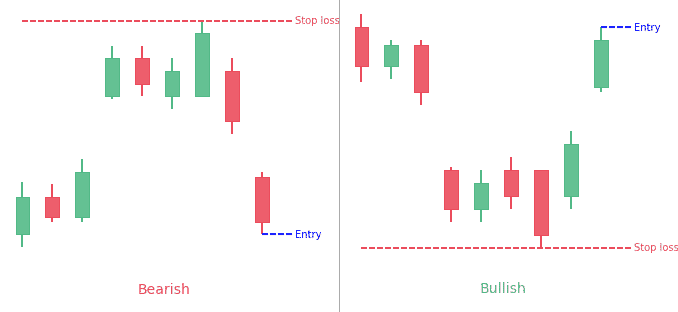
An Island Reversal Pattern appears when two different gaps create an isolated cluster of price.It usually gives traders a reversal biais. What is the Island Reversal candlestick pattern? The Island Reversal candlestick pattern is a fantastic candlestick pattern that...
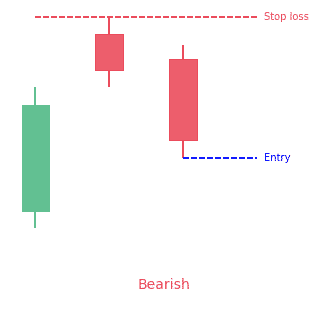
The Two Crows candlestick pattern is a three-line bearish reversal pattern.How to identify the pattern:The market must be in an uptrend. The first candle must be a long white candle. The second candle is a short black candle that starts with an...
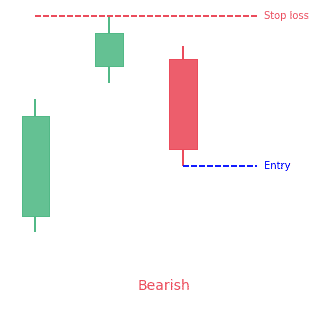
The upside gap three methods candlestick pattern is a 3-bar bearish continuation pattern.It has 2 green candles and a red one.The second candle gaps above the first one. Statistics to prove if the Upside Gap Three Methods pattern really works [displayPatternStats...
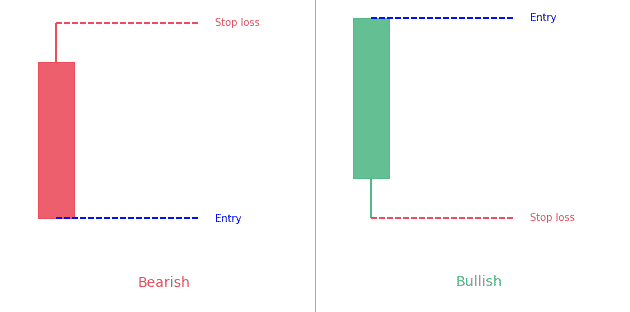
The Closing Marubozu is a 1-bar continuation candlestick pattern.It's a long candle close at it's high (bullish) or low (bearish). Statistics to prove if the Closing Marubozu pattern really works What is the Closing Marubozu...
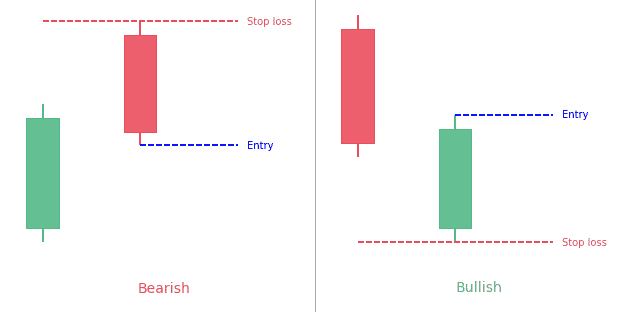
The Thrusting candlestick pattern is a two-bar pattern.The second candle gaps up/down and then retrace to close within the 1st candle's body. Statistics to prove if the Thrusting pattern really works What is the Thrusting...
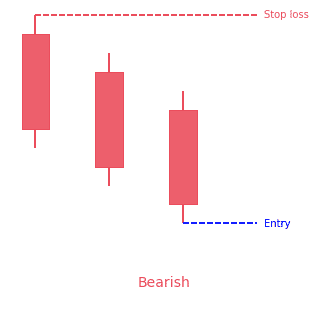
The identical three crows candlestick pattern is a 3-bar bearish reversal pattern.It occurs during an uptrend.It is made of three consecutive bearish candlesticks. Statistics to prove if the Identical Three Crows pattern really works [displayPatternStats...
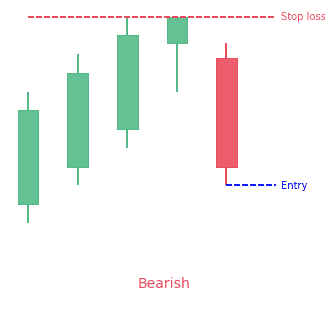
The Ladder Top candlestick pattern is a 5-bar bearish reversal pattern that appears at the end of a bullish trend.You can identify it with the following characteristics: The first three candles are always white with long real bodies opening and closing above the open...
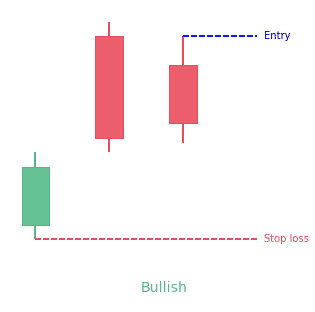
The up-gap side by side white lines candlestick pattern is a 3-bar bullish continuation pattern.The first and second lines are separated by a bullish gap. Statistics to prove if the Up-Gap Side By Side White Lines pattern really works [displayPatternStats...
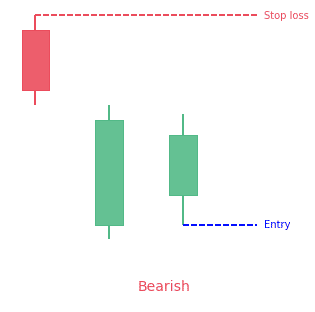
The down-gap side by side white lines candlestick pattern is a 3-bar bearish continuation pattern.It appears during a downtrend. Statistics to prove if the Down-Gap Side By Side White Lines pattern really works What is the...
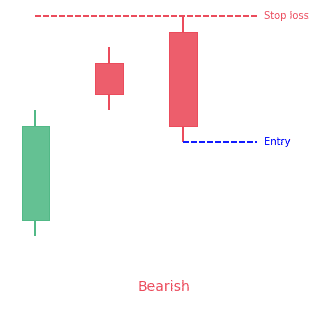
The upside gap two crows candlestick pattern is a 3-bar bearish reversal pattern.It appears during an uptrend. Statistics to prove if the Upside Gap Two Crows pattern really works What is the upside gap two crows candlestick...
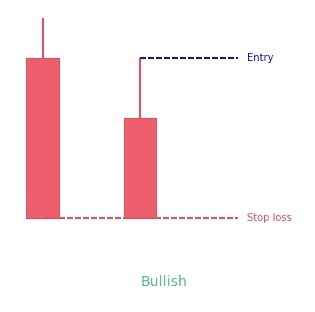
The matching low candlestick pattern is a 2-bar bullish reversal pattern. It occurs during a downtrend.As his name suggests, both lows from the 2 candles are equal. Statistics to prove if the Matching Low pattern really works ...
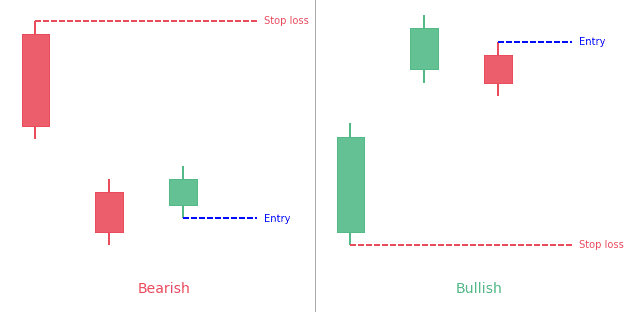
The Tasuki gap candlestick pattern is a three-bar continuation pattern.The first two candles have a gap between them.The third candle then closes the gap between the first two candles. Statistics to prove if the Tasuki Gap pattern really works...
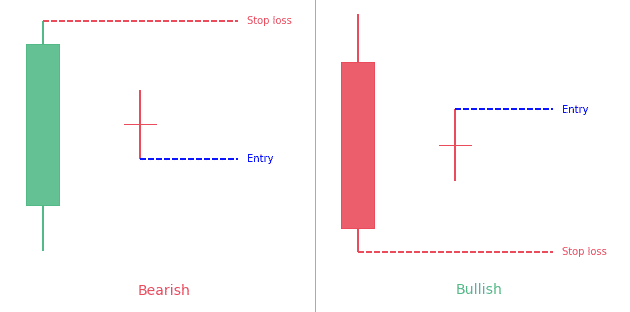
The harami candlestick pattern consists of two candlesticks.The first candle is a big one and the second candle is a doji, contained within the first one's body. Statistics to prove if the Harami Cross pattern really works What...
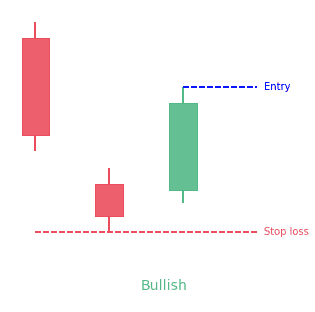
The downside gap three methods is a 3-bar candlestick pattern.It appears during a downtrend.The first two candles have a gap down between them while the third candle covers the gap between the first two. Statistics to prove if the Downside Gap Three Methods pattern...
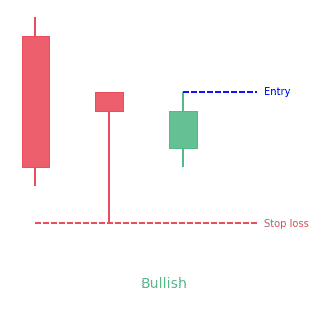
The unique three river bottom candlestick pattern is a bullish reversal pattern.It occurs during a downtrend in the market. Statistics to prove if the Unique Three River pattern really works What is the unique three river...
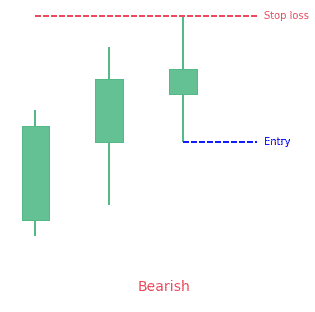
The advance block candlestick pattern is a 3-bar bearish reversal pattern.It has three long green candles with consecutively higher closes than the previous candles.Each candle has a shorter body than the previous one. Statistics to prove if the Advance Block pattern...
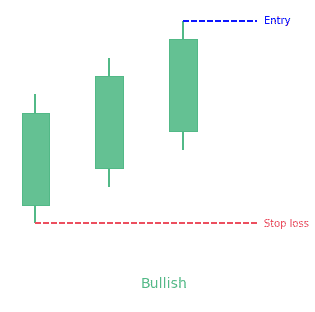
The three white soldiers candlestick pattern is a 3-bar bullish pattern.It has 3 long green candles, each making new higher high.Each candle's body should be approximately the same size. Statistics to prove if the Three White Soldiers pattern really works...
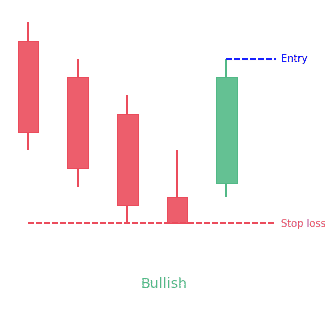
The ladder bottom candlestick pattern is a 5-bar bullish reversal pattern.It forms following these characteristics:The first three long black candlesticks, resembling three black crows formation, with successive lower opens and closeThe fourth is also a black...
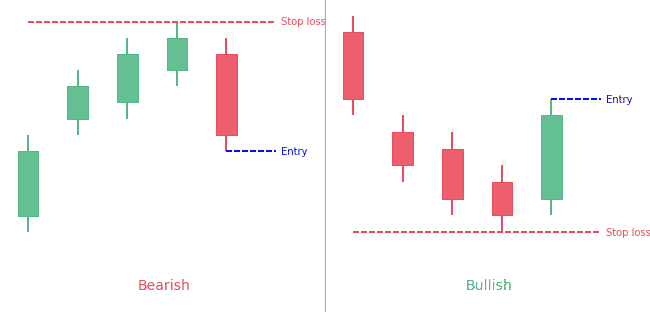
The breakaway candlestick pattern is a five bar reversal candlestick pattern.It can be bullish or bearish.The first candle must be a long candle.The next three candles must be spinning tops. The second candle must also create a gap between the first and...
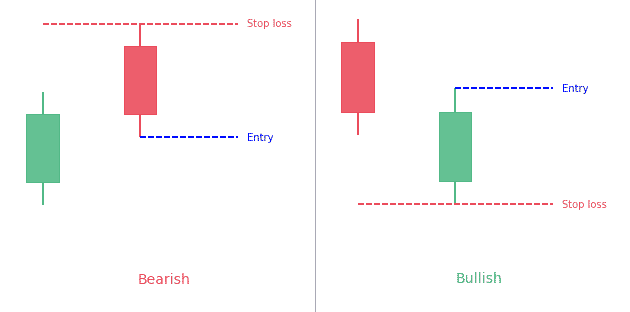
The counterattack candlestick pattern is a reversal pattern that indicates the upcoming reversal of the current trend in the market. There are two variants of the counterattack pattern, the bullish counterattack pattern and the bearish counterattack pattern. The...
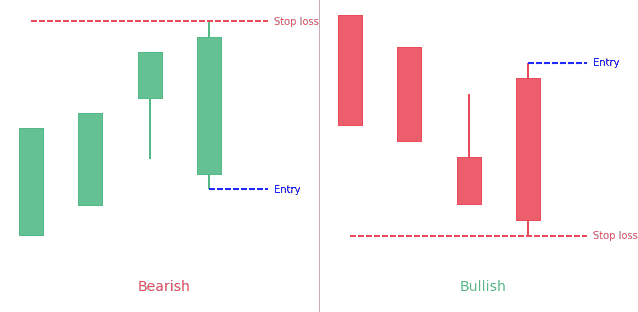
The concealing baby swallow candlestick pattern is a 4-bar bullish reversal pattern.The first candle must be a Marubozu which appears during a trend. The second candle must also be a same color Marubozu. It opens within the body of the previous candle and closes...
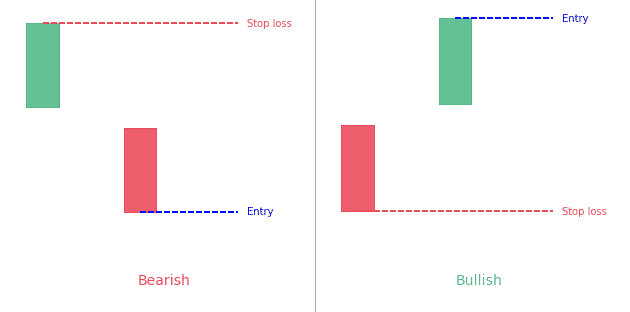
The kicking candlestick pattern is a 2-bar reversal pattern.It is made of two opposite side marubozus separated by a price gap. Statistics to prove if the Kicking pattern really works The kicking candlestick pattern is a two-bar...
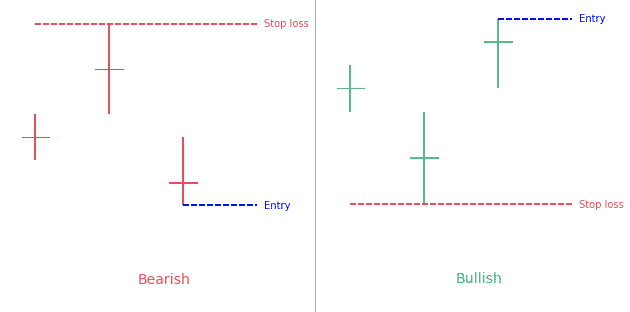
The tri-star candlestick pattern is a 3-bar trend reversal pattern.There must be a clear and defined trend in the market. Three consecutive Doji candles must appear. The second Doji candle must create a gap below the first and third Doji candles creating a...
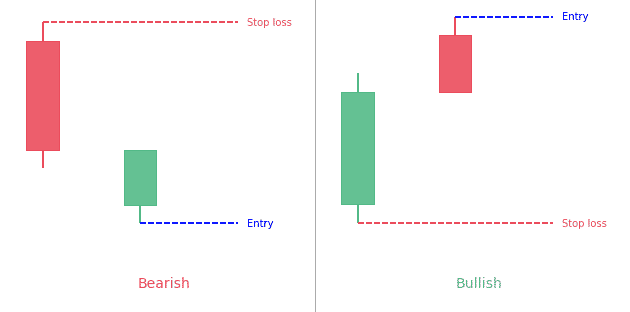
The in-neck candlestick pattern is a 2-bar continuation pattern.Closing prices of both candles are the same or nearly the same forming a horizontal neckline. Statistics to prove if the In-neck pattern really works The in-neck...
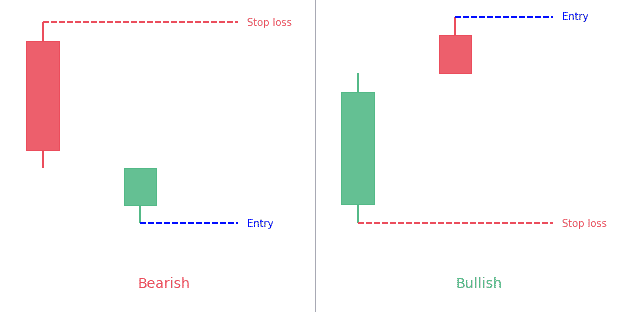
The on-neck candlestick pattern is a 2-bar continuation pattern.Closing prices of the second candle is nearly the same than first candle high/low forming a horizontal neckline. Statistics to prove if the On-neck pattern really works ...
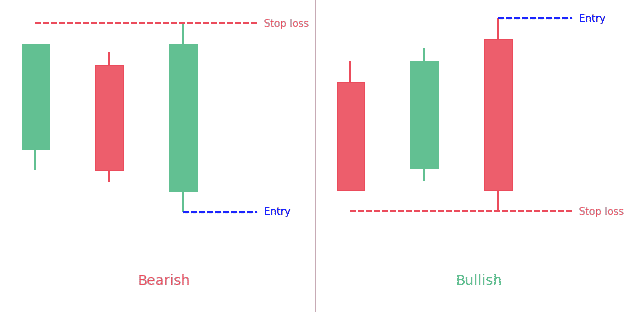
A stick sandwich is a 3-bar pattern.The closing prices of the two candlesticks that surround the opposite colored candlestick have to be the same. Statistics to prove if the Stick Sandwich pattern really works What is the Stick...
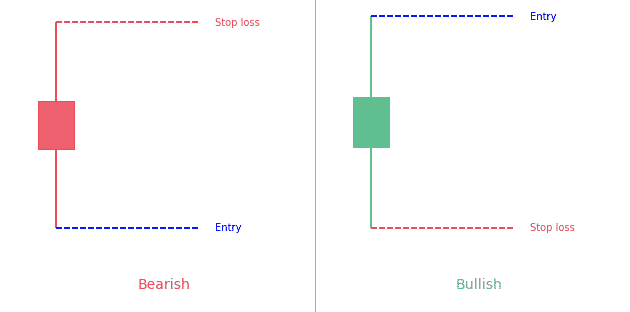
High wave is a 1-bar candlestick pattern that has very long upper and lower shadows and a small real body.It shows indecision in the market. Statistics to prove if the High Wave pattern really works A lot of candlestick traders...
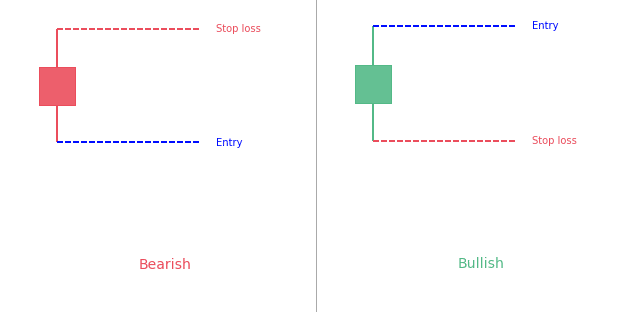
The Short Line candlestick pattern is a 1-bar very simple to understand pattern.It simply consists in a candle with a short body.There are various kind of specific variations of the short line pattern (doji, hammer, hanging man, shooting star). Let's go in-depth about...
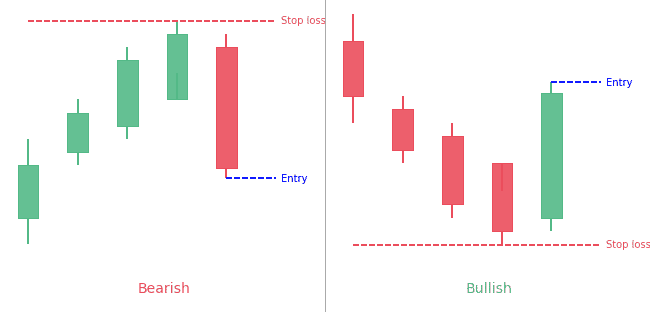
The modified Hikkake candlestick pattern is the more specific and upgraded version of the basic Hikkake pattern.The difference with the normal pattern is that the "context bar" is used prior to the inside price bar. It consists of a context bar, an inside bar, a fake...
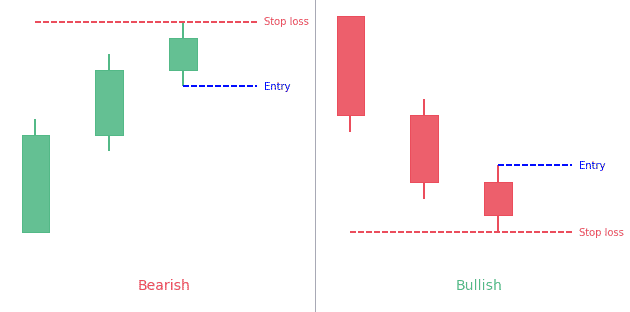
The stalled candlestick pattern is a three-bar pattern that predicts an upcoming reversal of the trend in the market. Although it is usually a bearish reversal pattern, yet there are strong possibilities that a bullish variant of the stalled pattern may also appear...
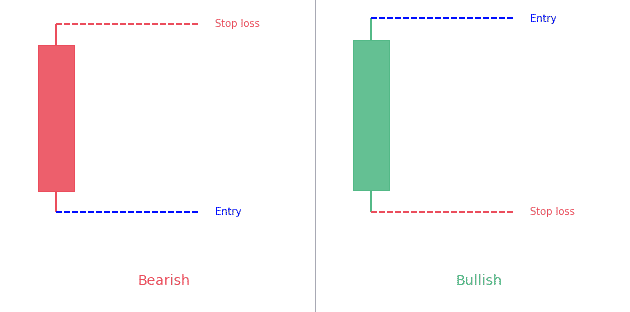
The Long Line candlestick pattern is a 1-bar pattern.It simply consists of a long body candle.It can be bearish or bullish. What is a long line candle? Candlesticks provide different visual hints on the trading charts for a better and easy understanding of the...
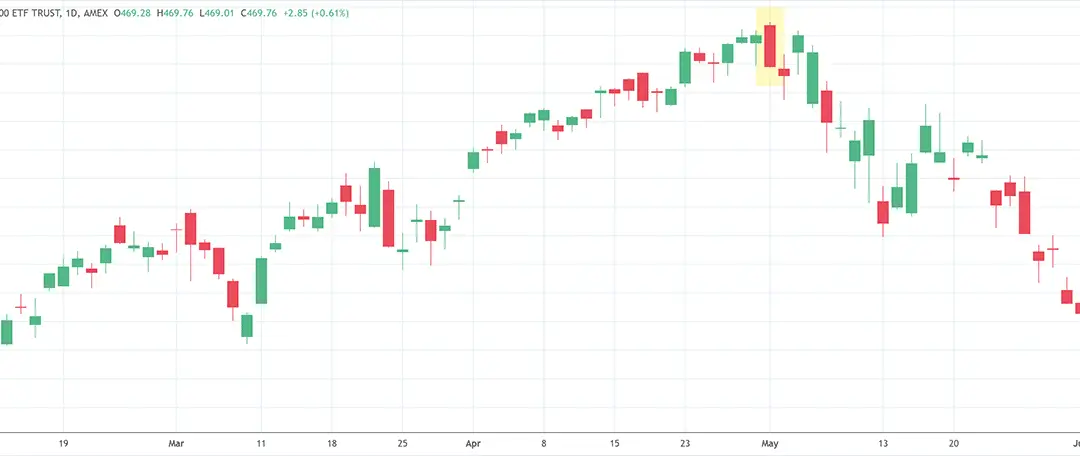
Introduction Candlestick charts are technical tool that put together data for numerous time periods into single price bars. This enables them to become more important than traditional open-high, low-close bars or simple lines...
What is the Cradle Pattern? To adequately understand candlestick patterns, you must have had a good understanding of Japanese candlesticks and all their attributes. Ideally, cradle patterns should be an indication of reversal of the recent trend. It usually takes...
There are different types of candlestick patterns. But when we talk about above the stomach evolves over a period of almost two sessions. In this pattern, the existing downtrend is there. And it appears at the bottom of any downtrend. Brief Review about Above the...

PS: Get 20% off with the code SAVE20
Get “Every Candlestick Patterns Statistics”, The Last Trading Book You’ll Ever Need! 📖

Pre-register now and receive the candlestick patterns statistics ultimate ebook for free before anyone else!
"All you need is one pattern to make a living."
- Linda Raschke