 Good Trading requires the Best Charting Tool!
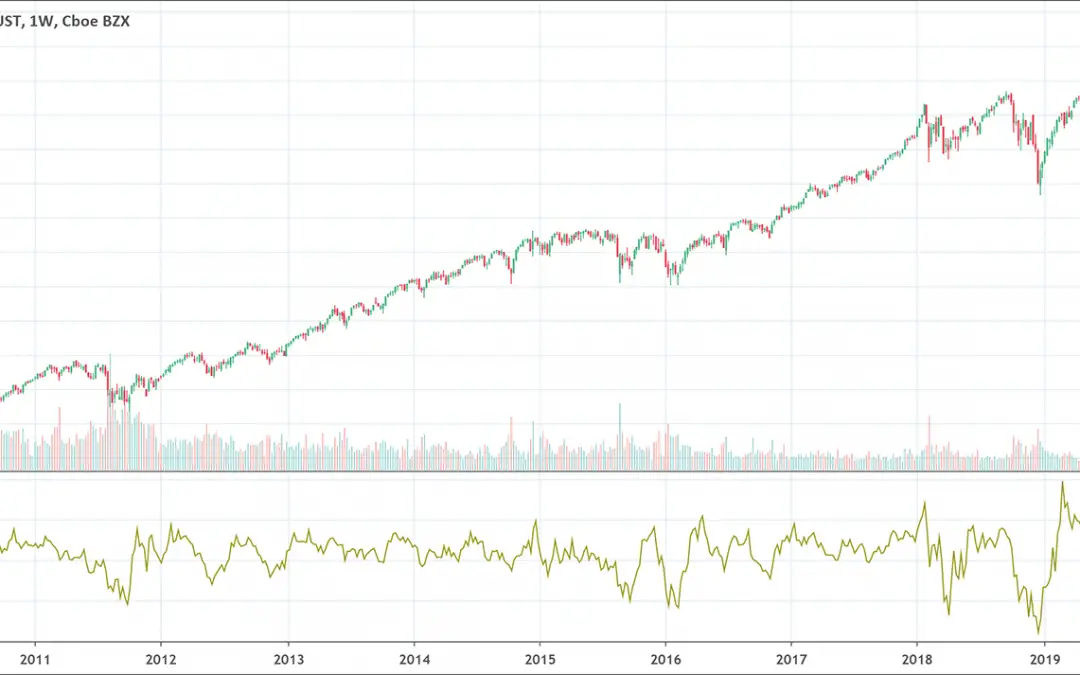
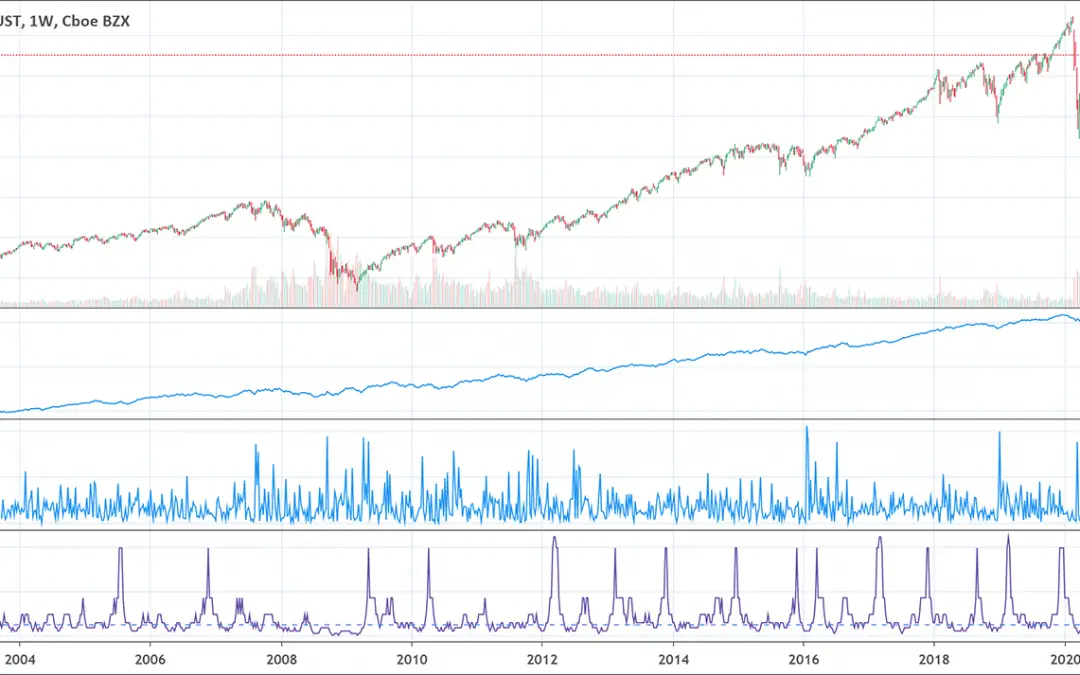
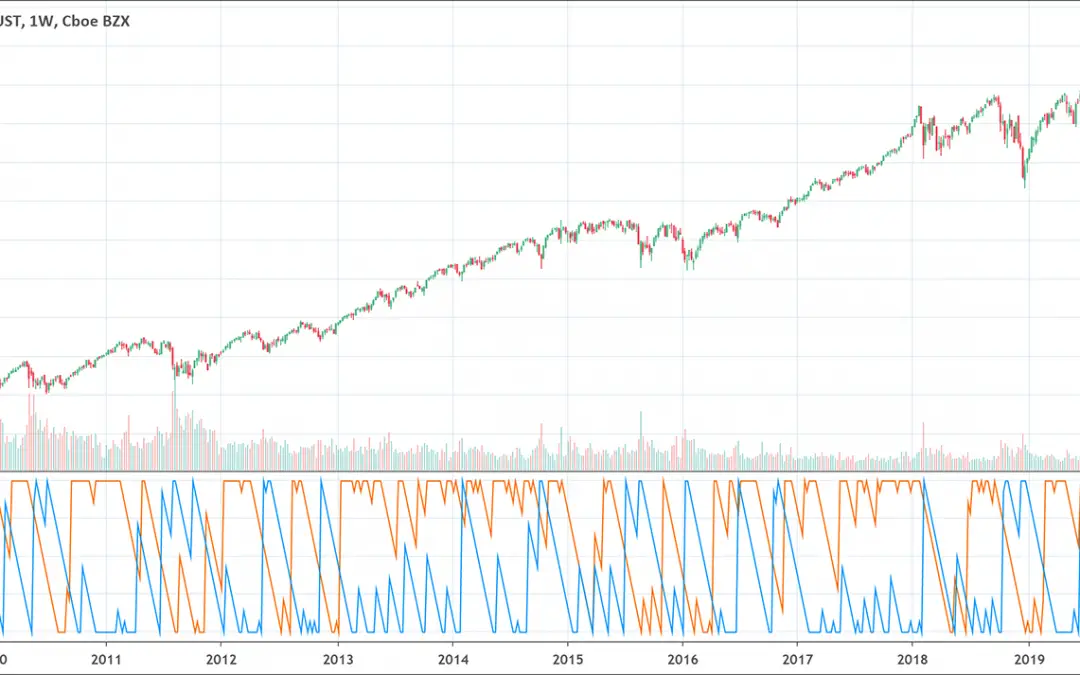
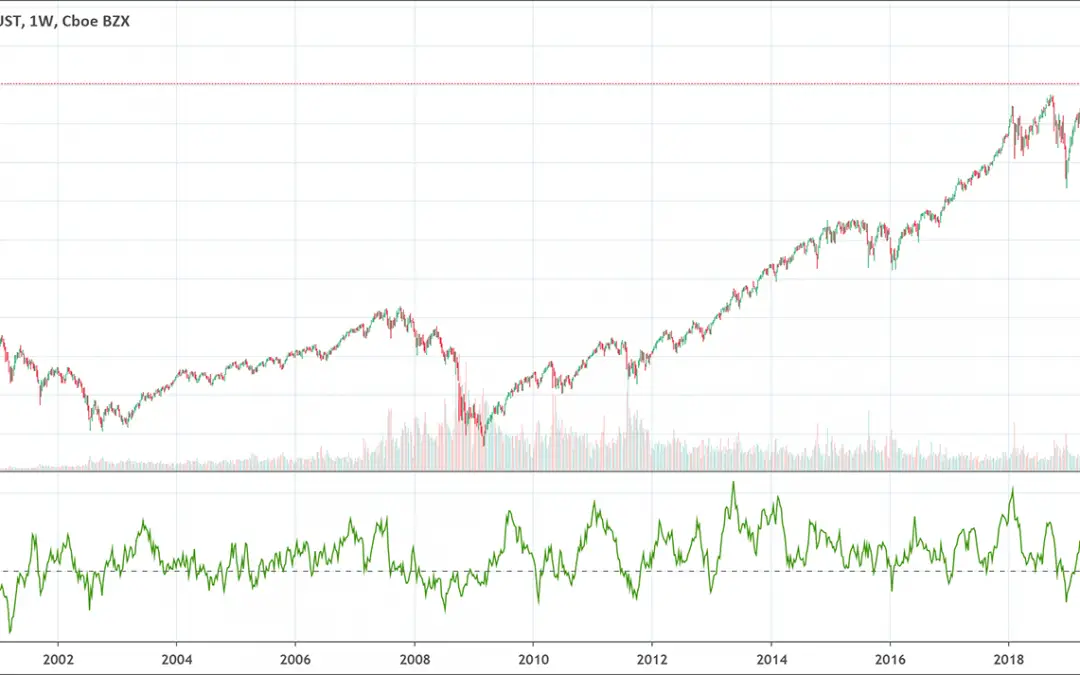
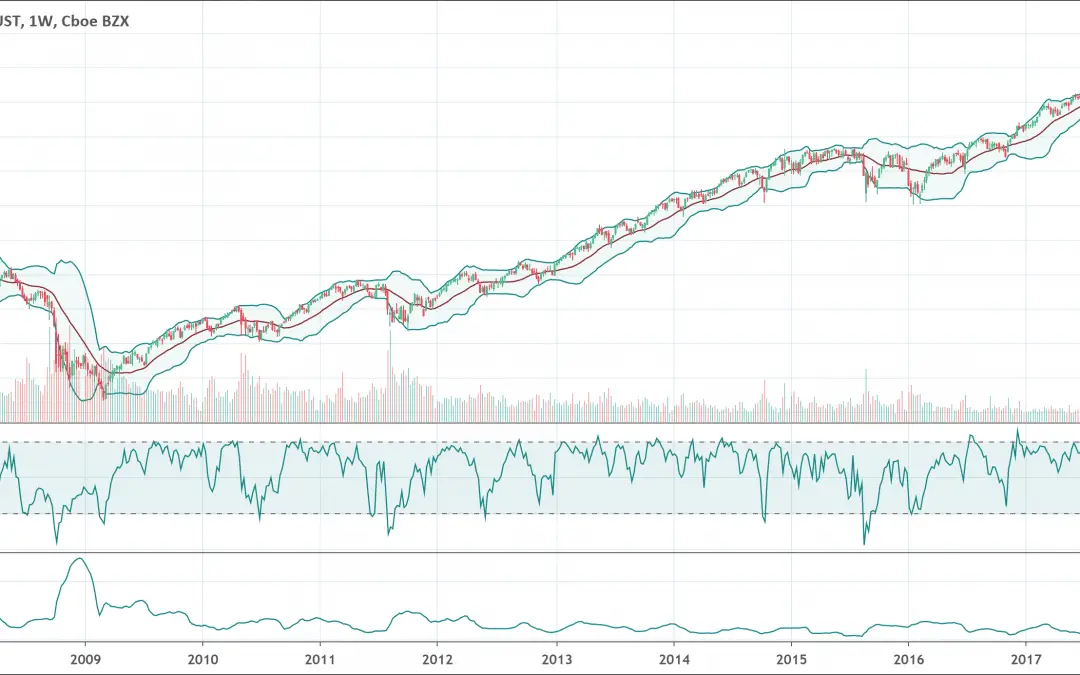
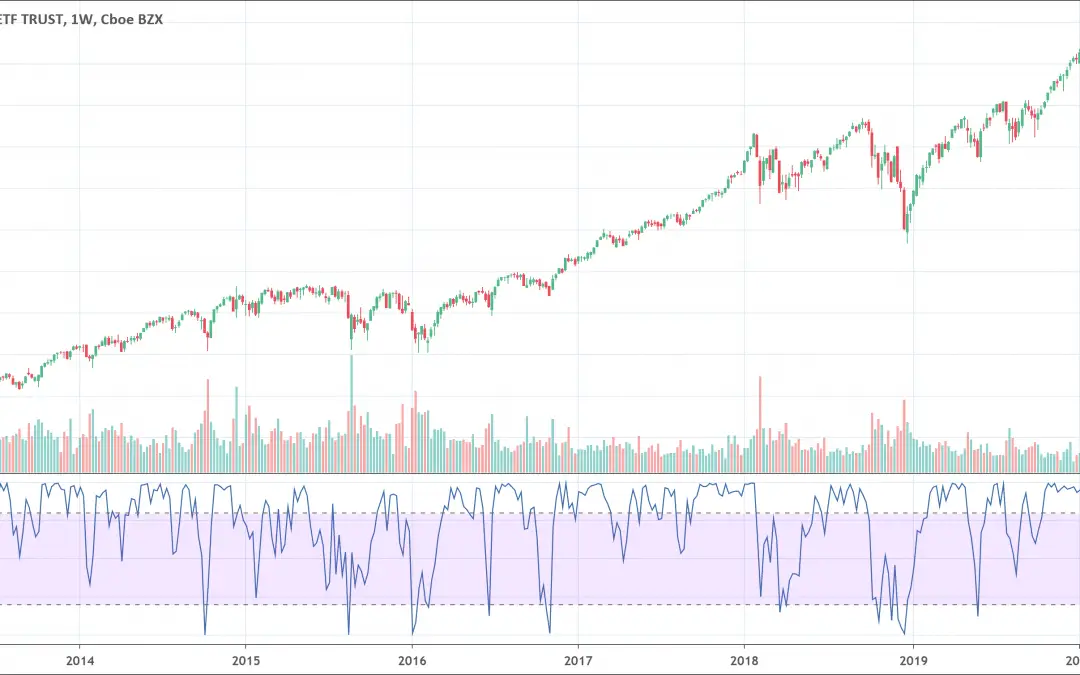
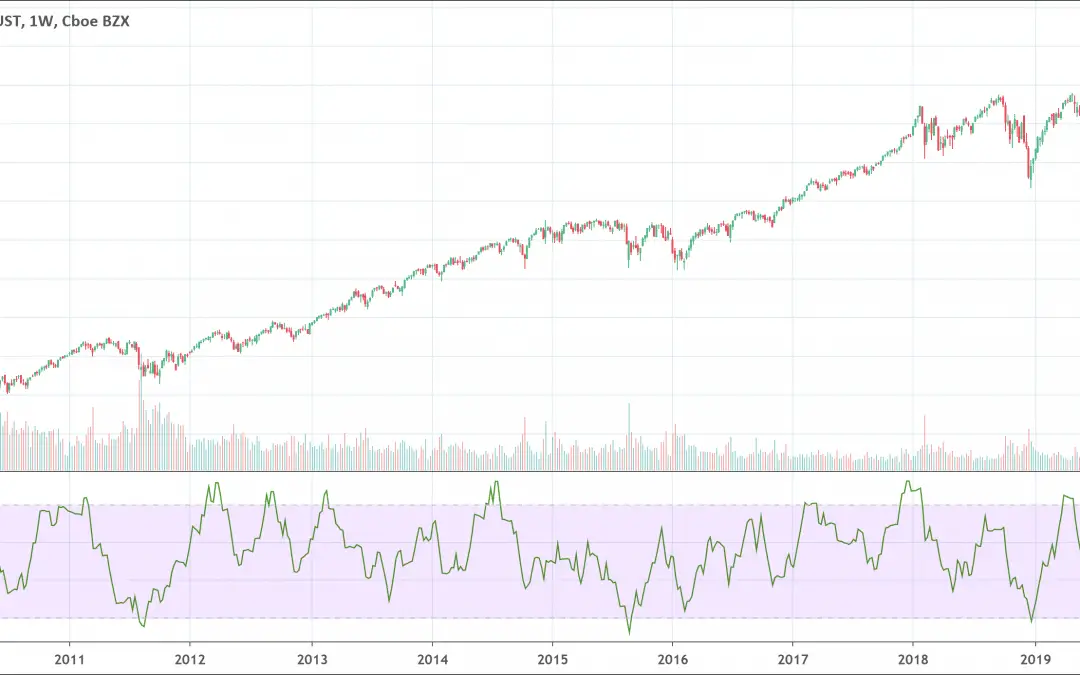
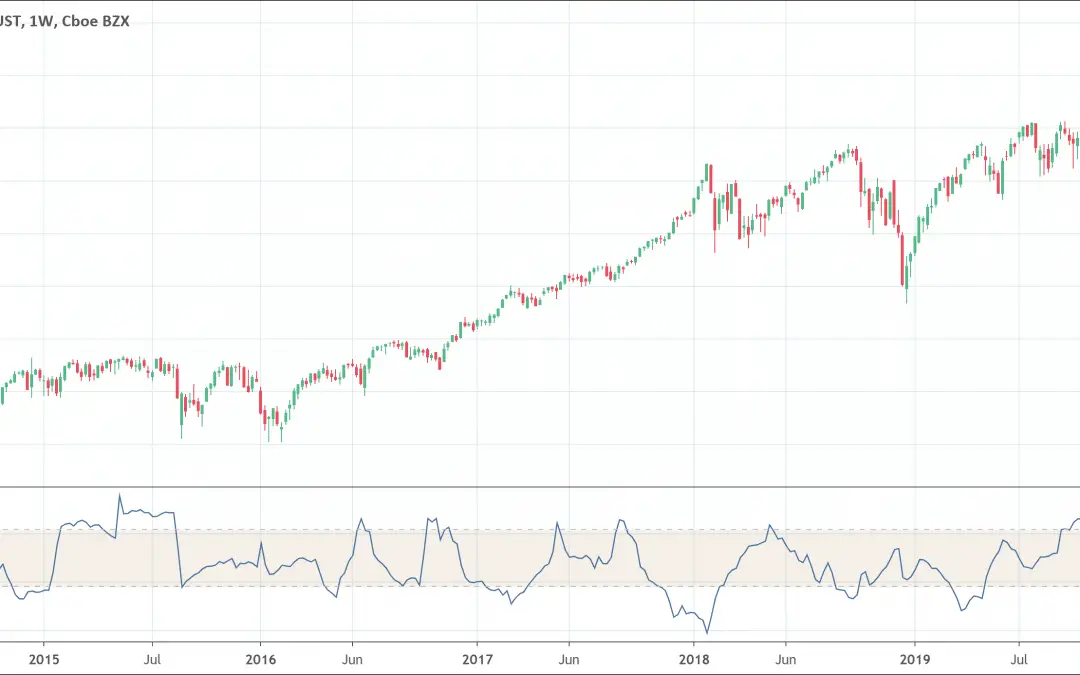
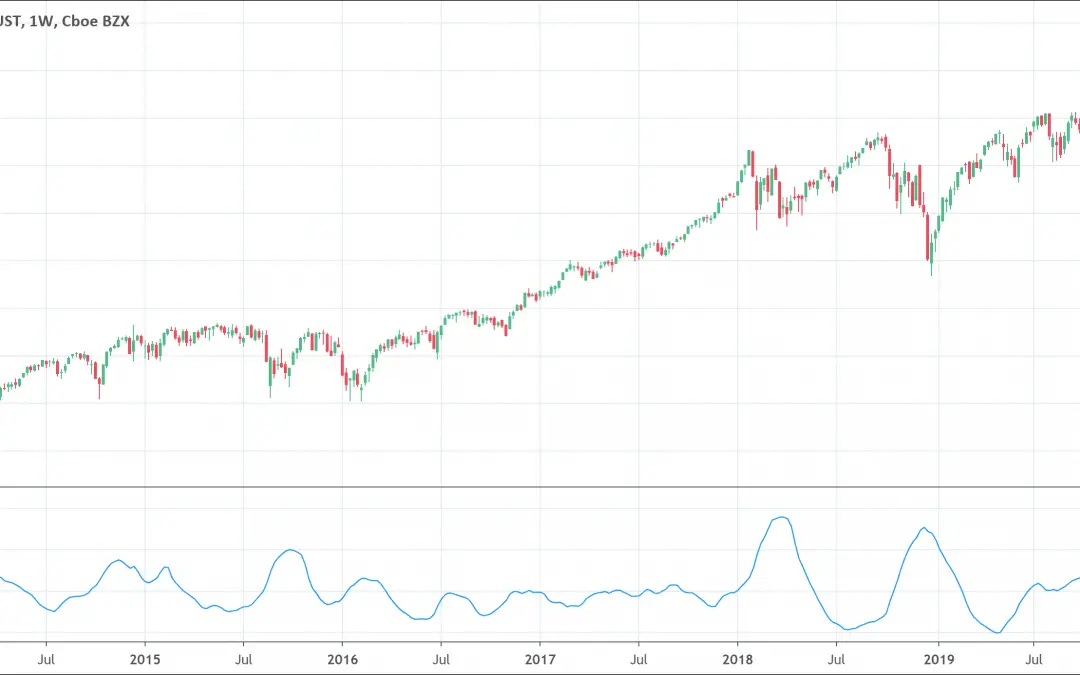
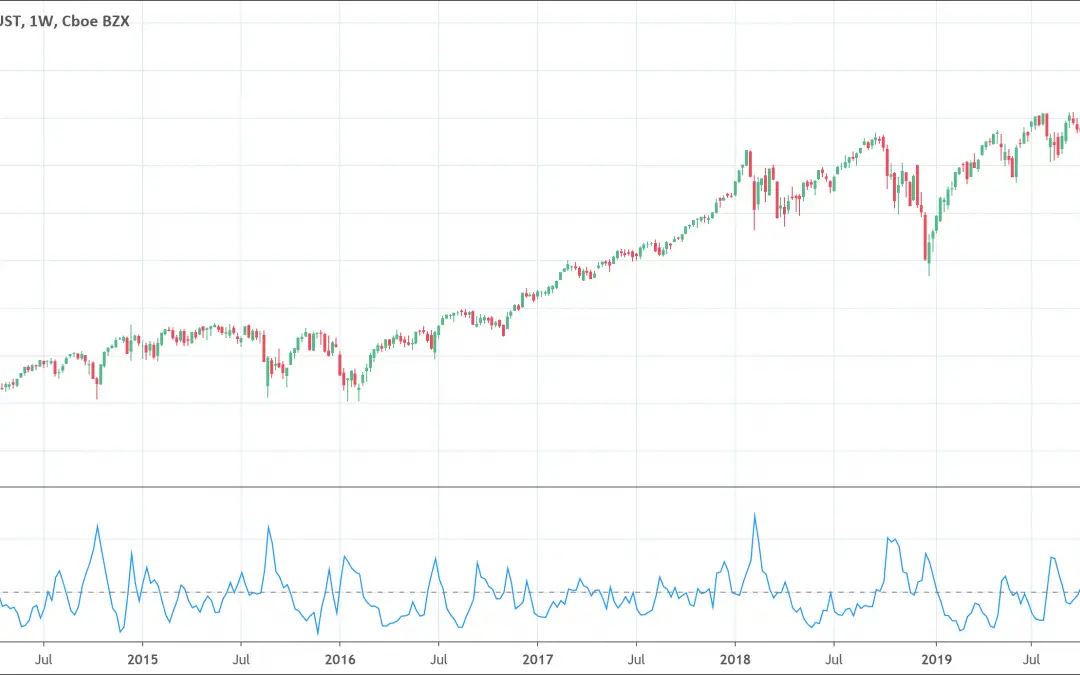
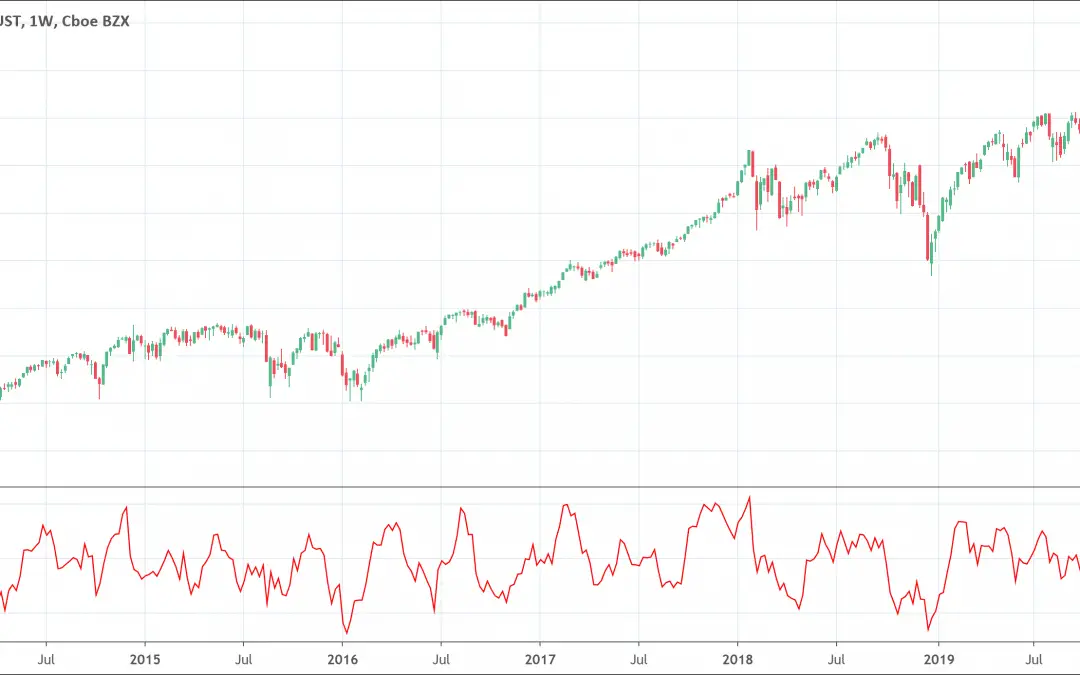
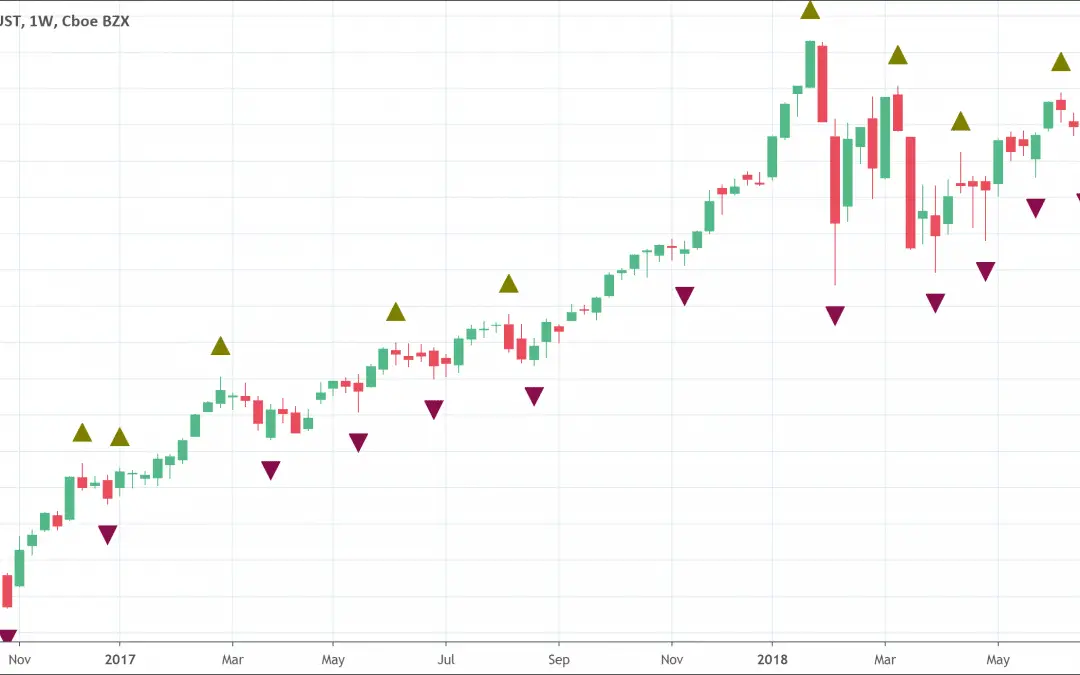
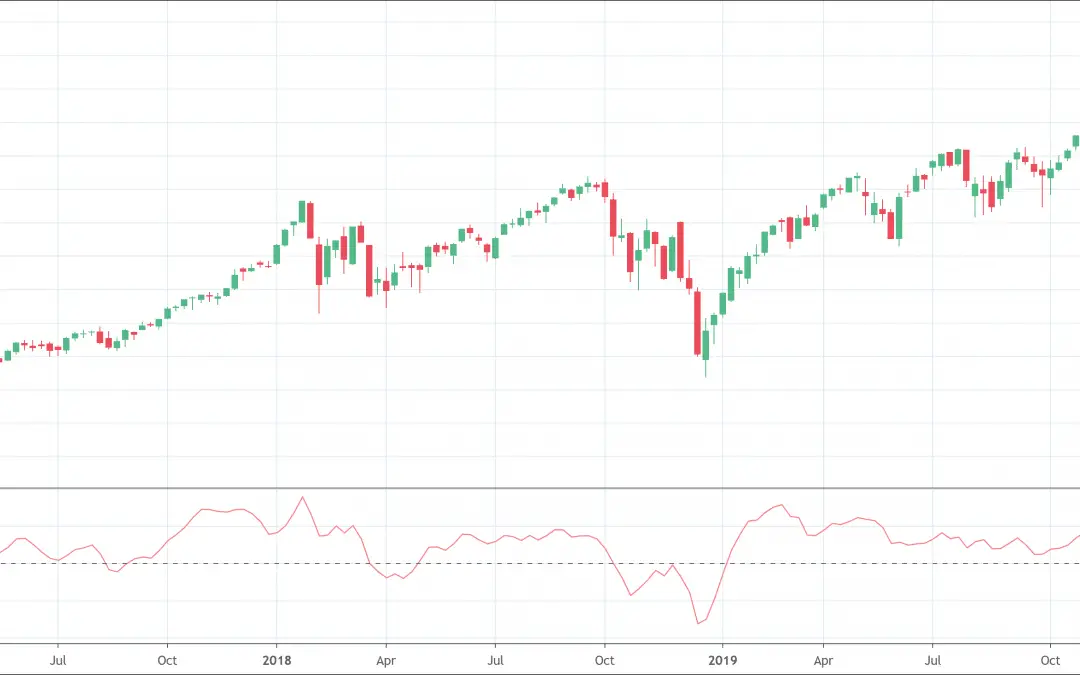
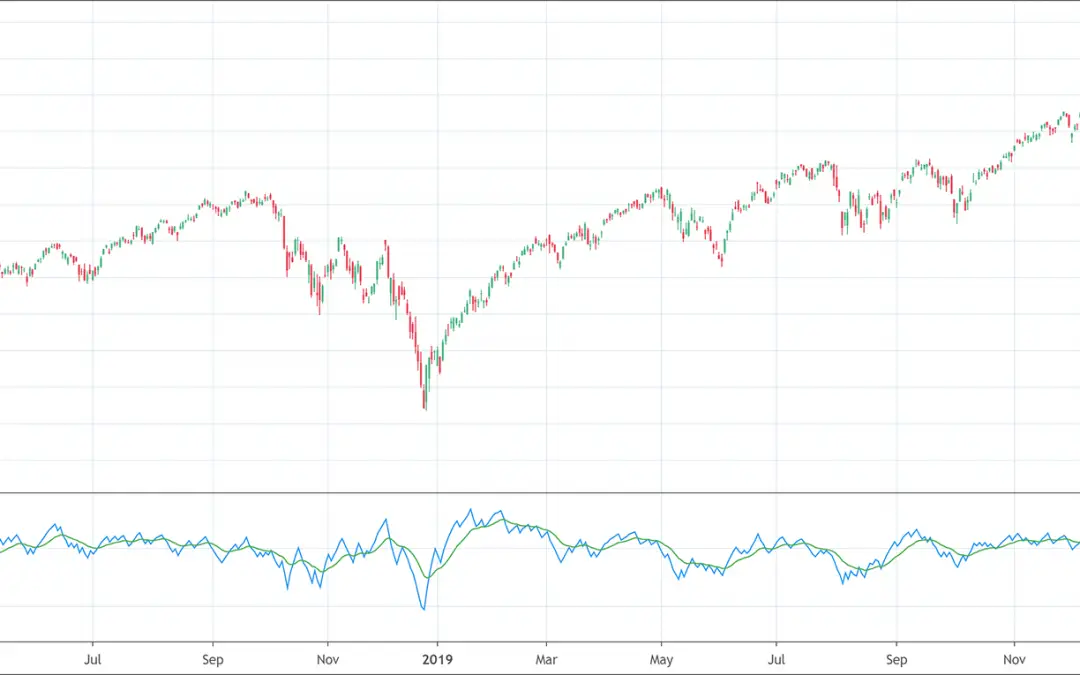
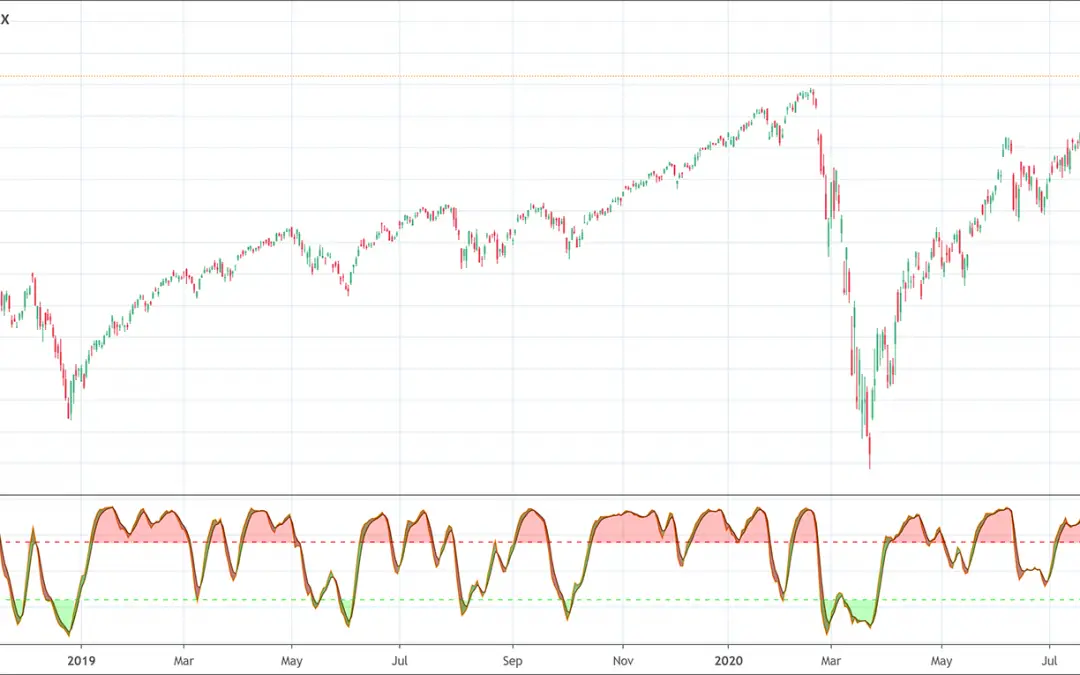
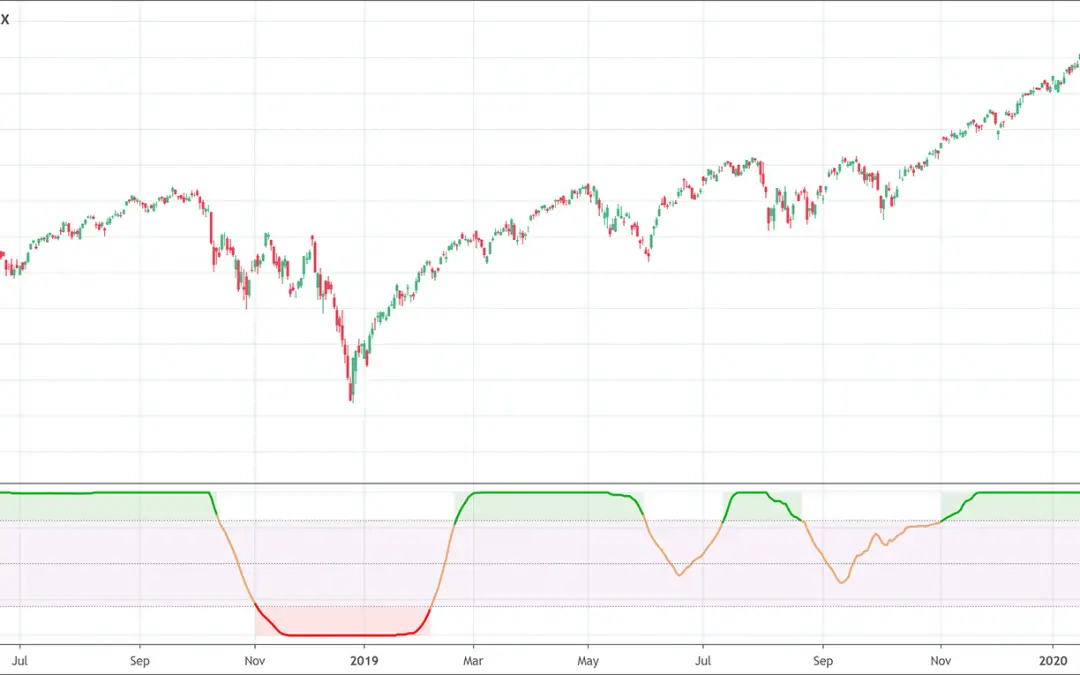
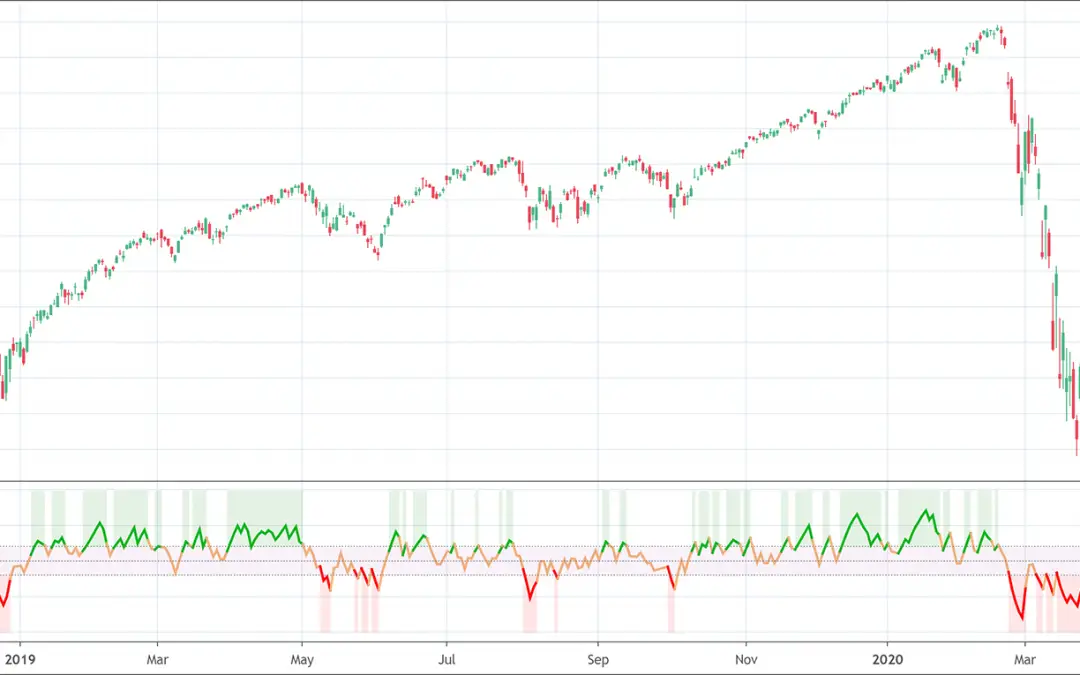
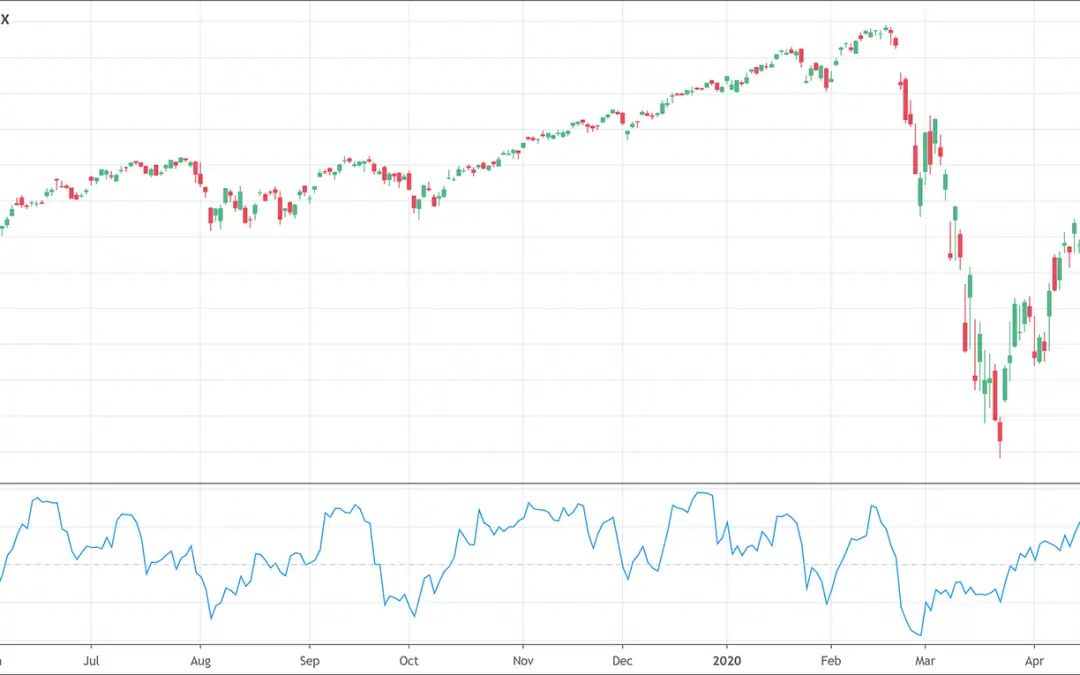
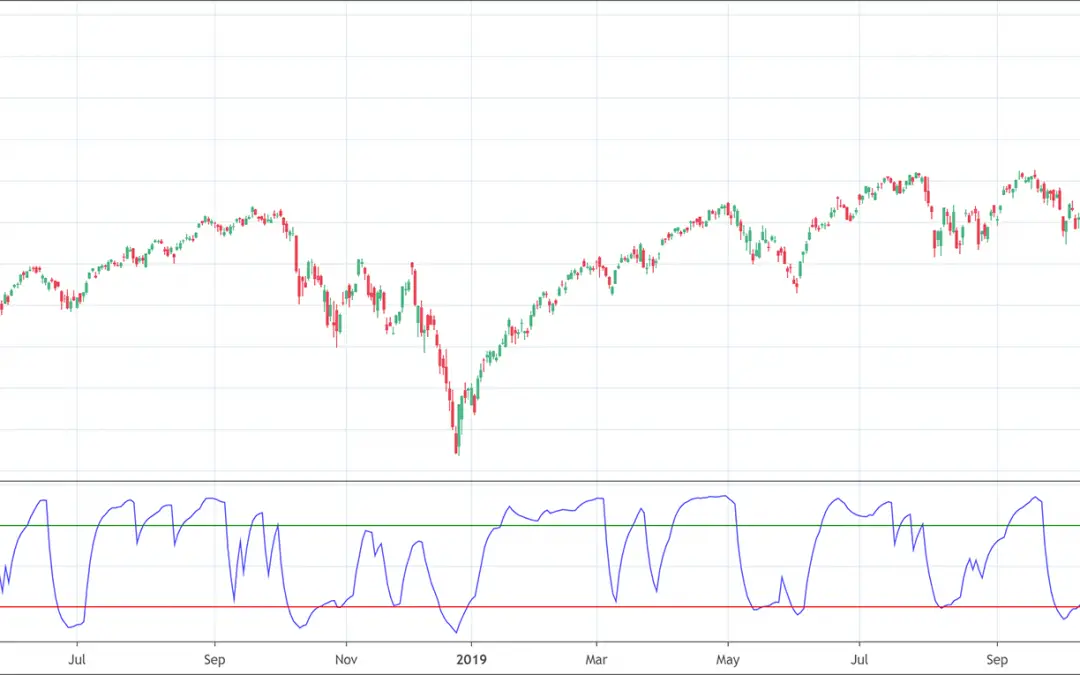
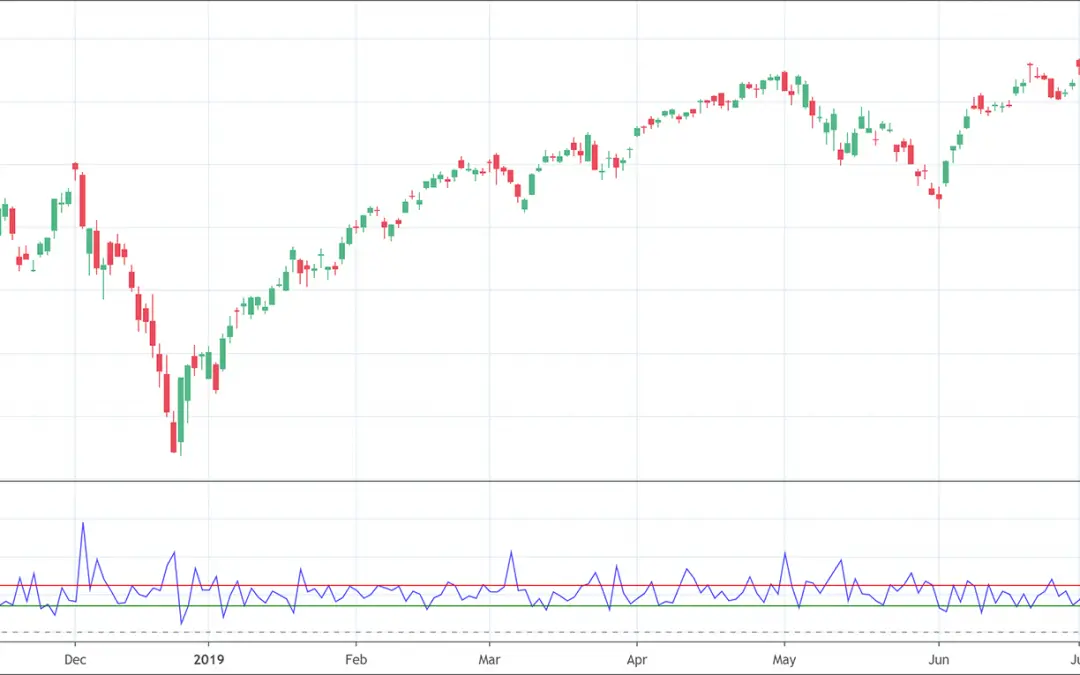
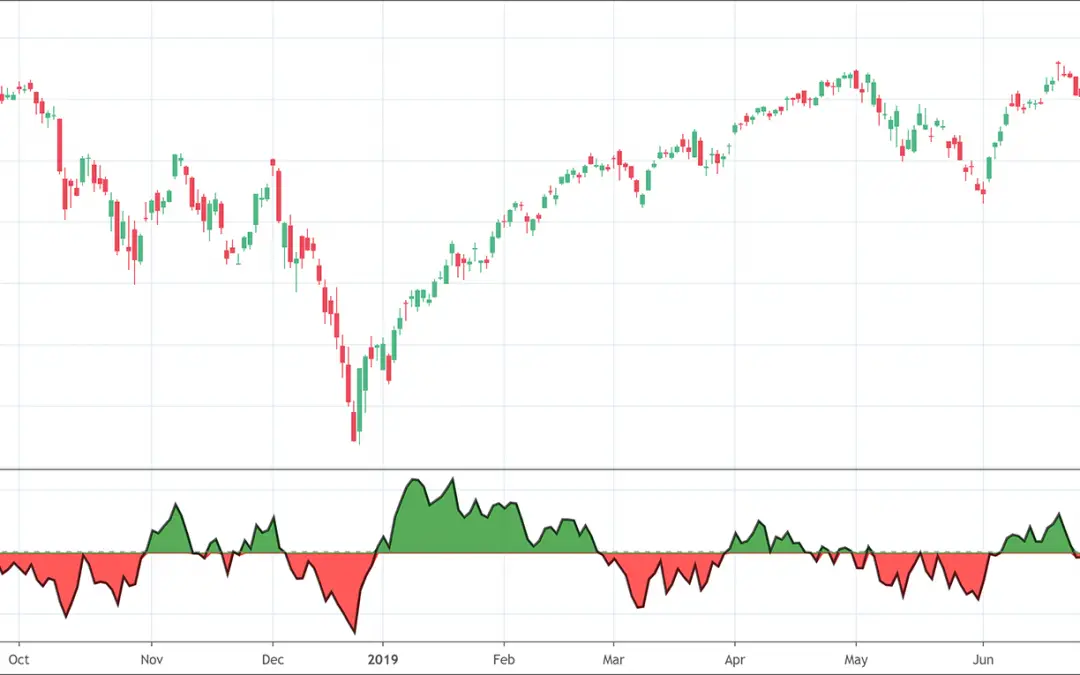
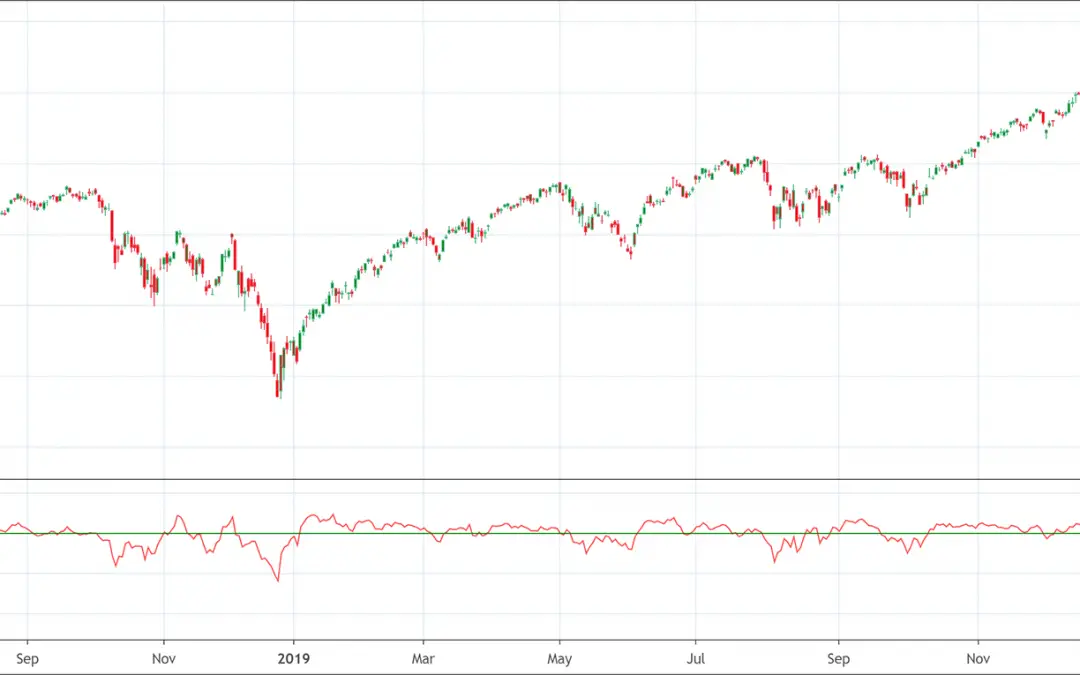
The RSI (Relative Strength Index) indicator is a popular momentum oscillator.It provides traders with bullish and bearish price momentum signal.When the RSI is above 70%, it's considered overbought; when it's below 30%, it's considered oversold. What is the Relative...
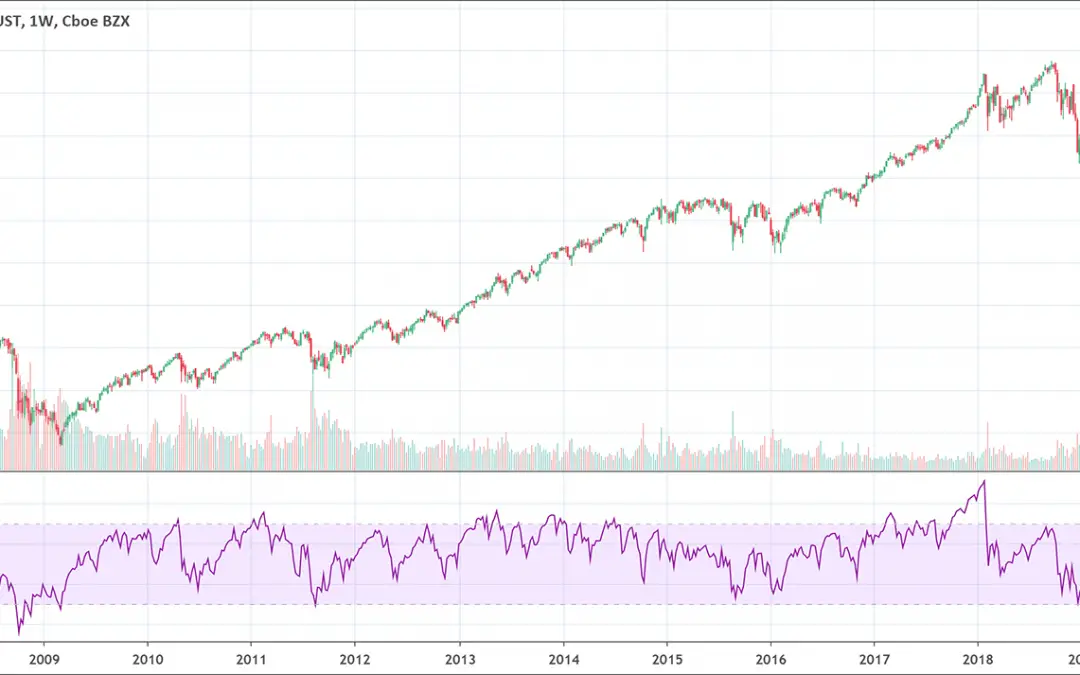
Relative Strength Index (RSI): Complete Guide
read more
![Stochastic Oscillator: Full Trading Guide [2022]](https://patternswizard.com/wp-content/uploads/2020/06/Stochastic-1080x675.png)
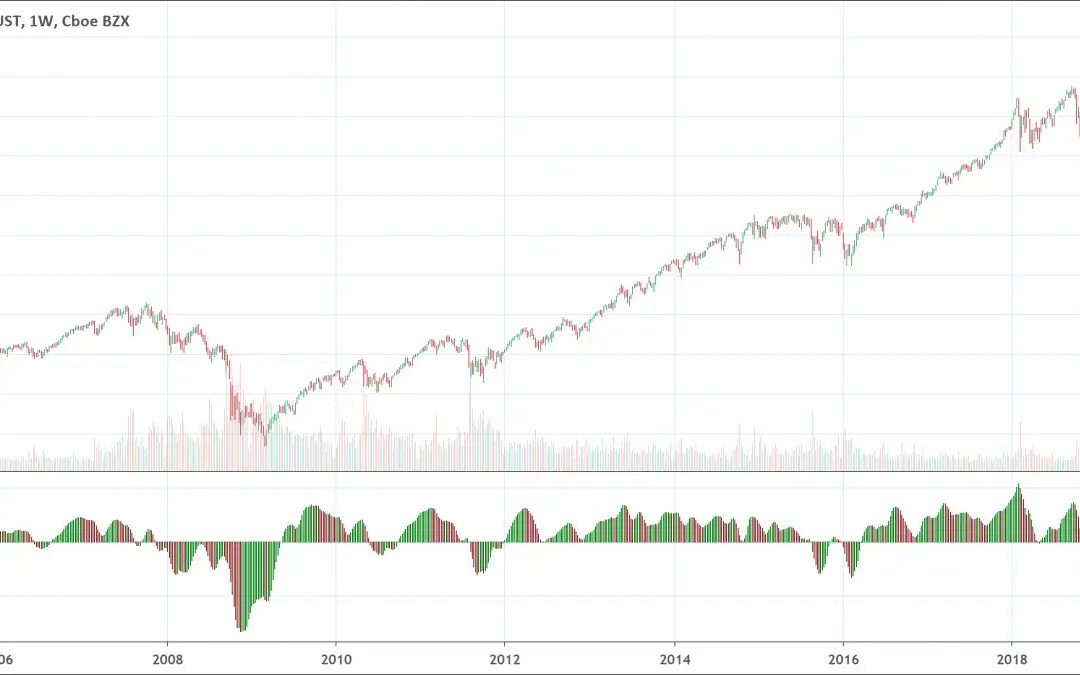
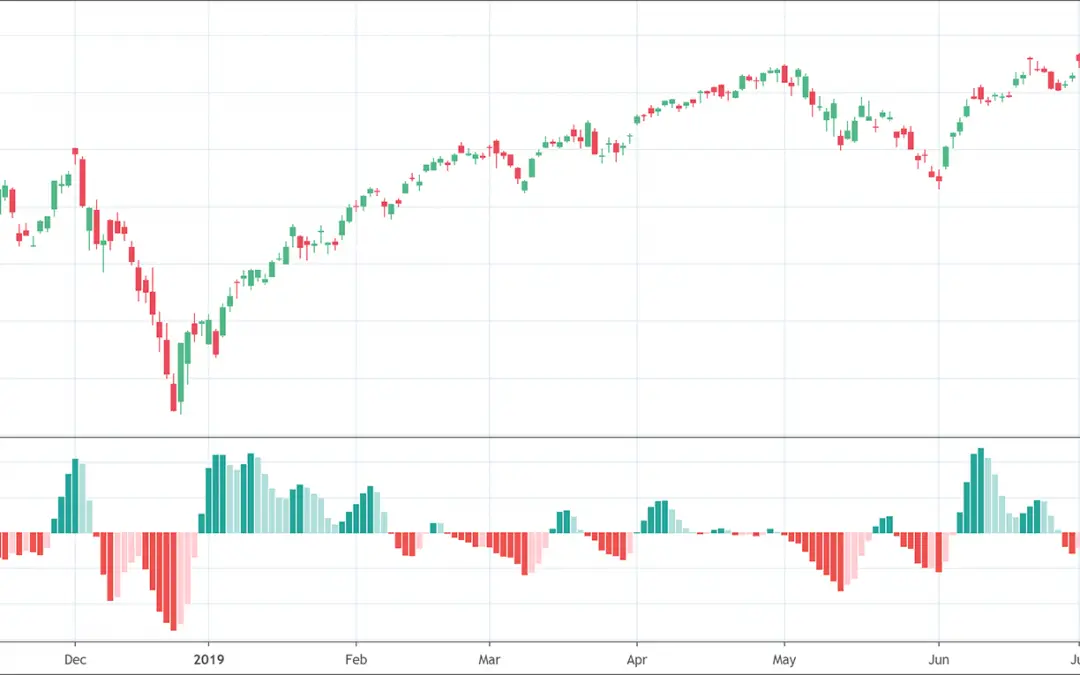
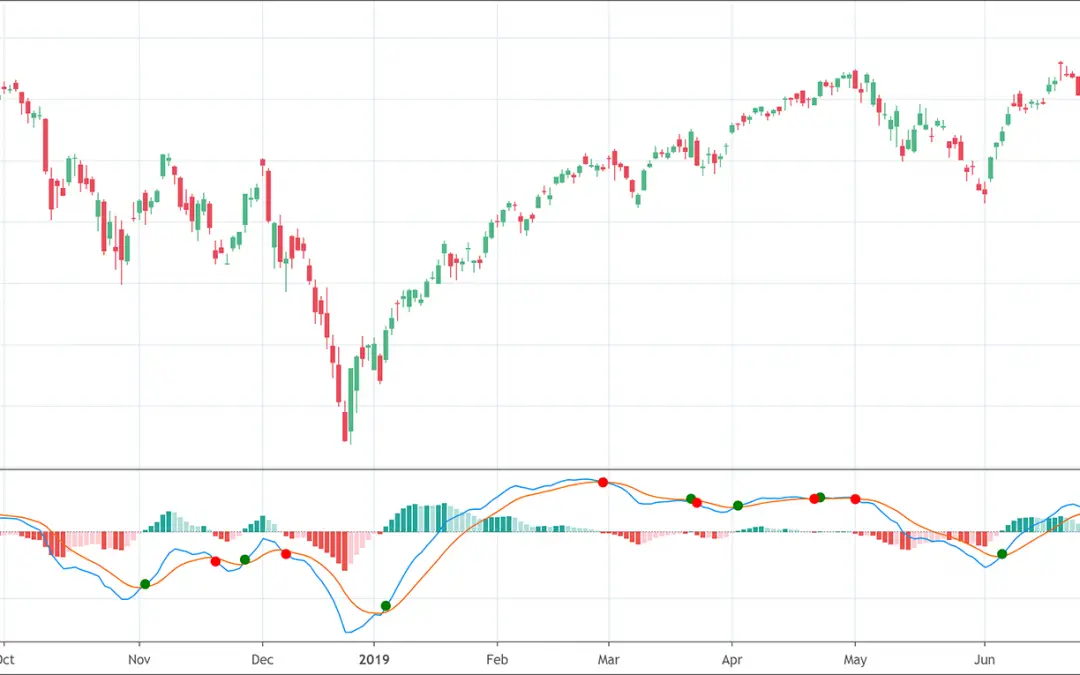
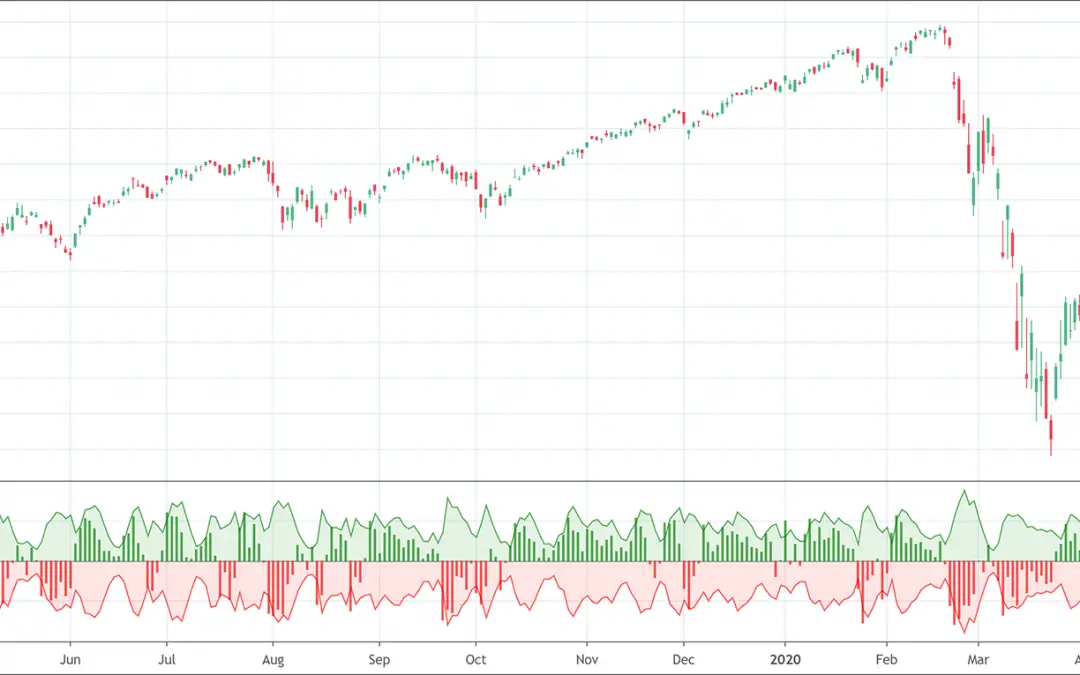
![MACD Indicator: The Ultimate Guide [2022]](https://patternswizard.com/wp-content/uploads/2020/06/MACD-1080x675.png)
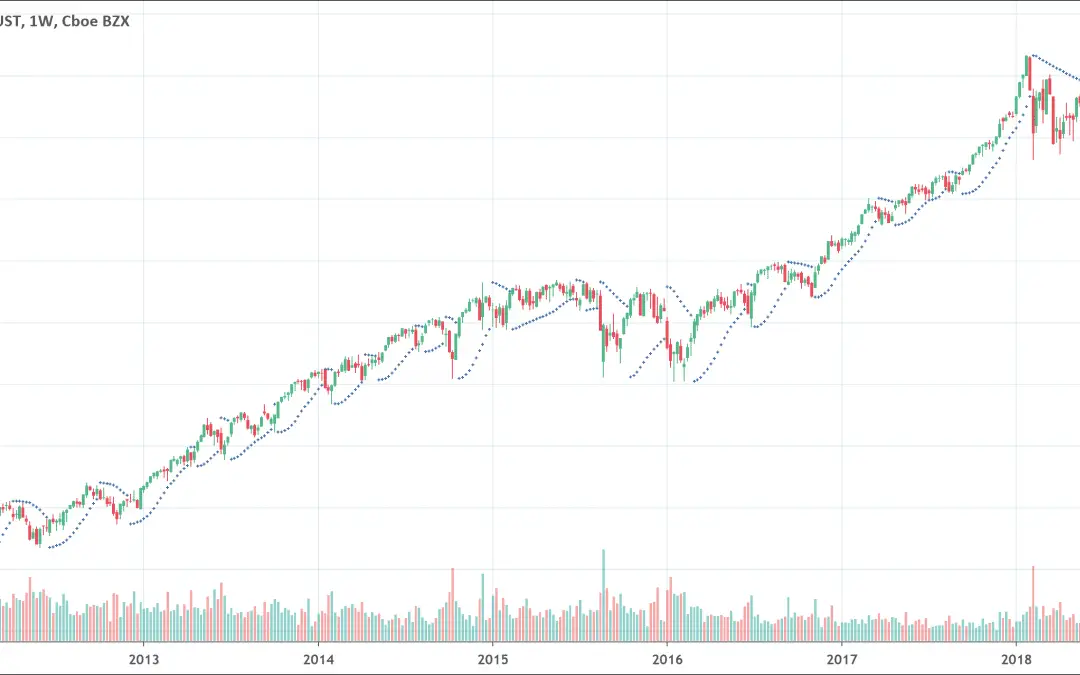
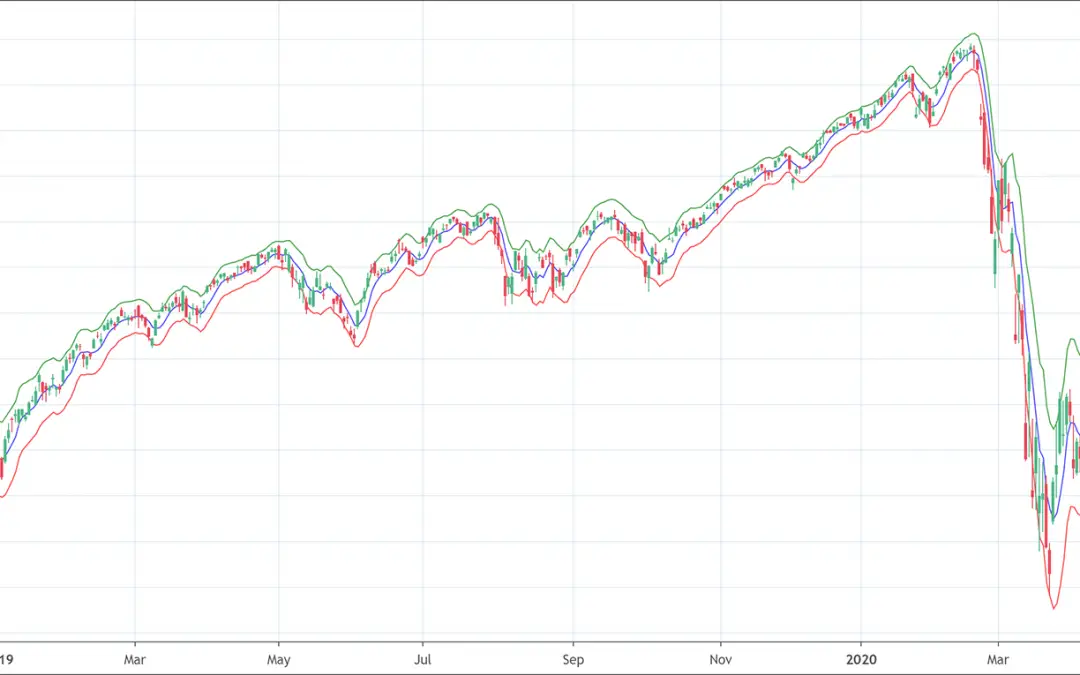
![McGinley Dynamic Indicator: Full Guide [2022]](https://patternswizard.com/wp-content/uploads/2020/07/mcginleydynamic-1080x675.png)
![Rate of Change Indicator: Complete Guide [2022]](https://patternswizard.com/wp-content/uploads/2020/07/rateofchange-1080x675.png)
![Stochastic RSI indicator: Full Guide [2022]](https://patternswizard.com/wp-content/uploads/2020/07/stochrsi-1080x675.png)
![Volume Price Trend Indicator: Full Guide [2022]](https://patternswizard.com/wp-content/uploads/2020/08/pricevolumetrend-1080x675.png)
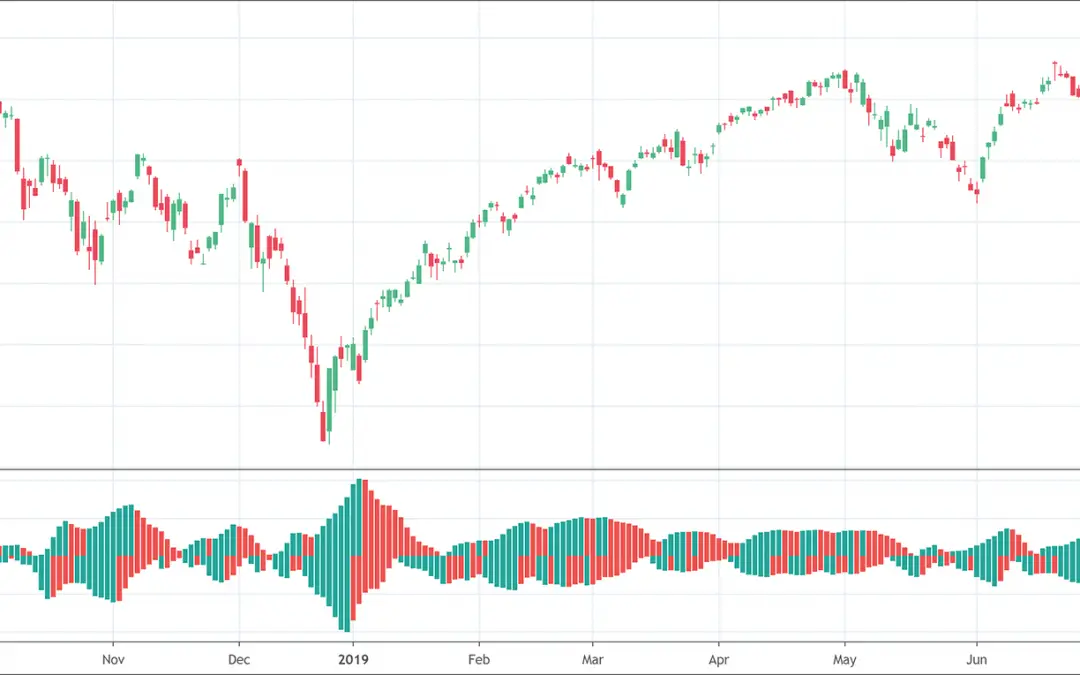
![TTM Squeeze Indicator Explained [Full Trading Guide]](https://patternswizard.com/wp-content/uploads/2021/10/TTM-Squeeze-1080x590.png)
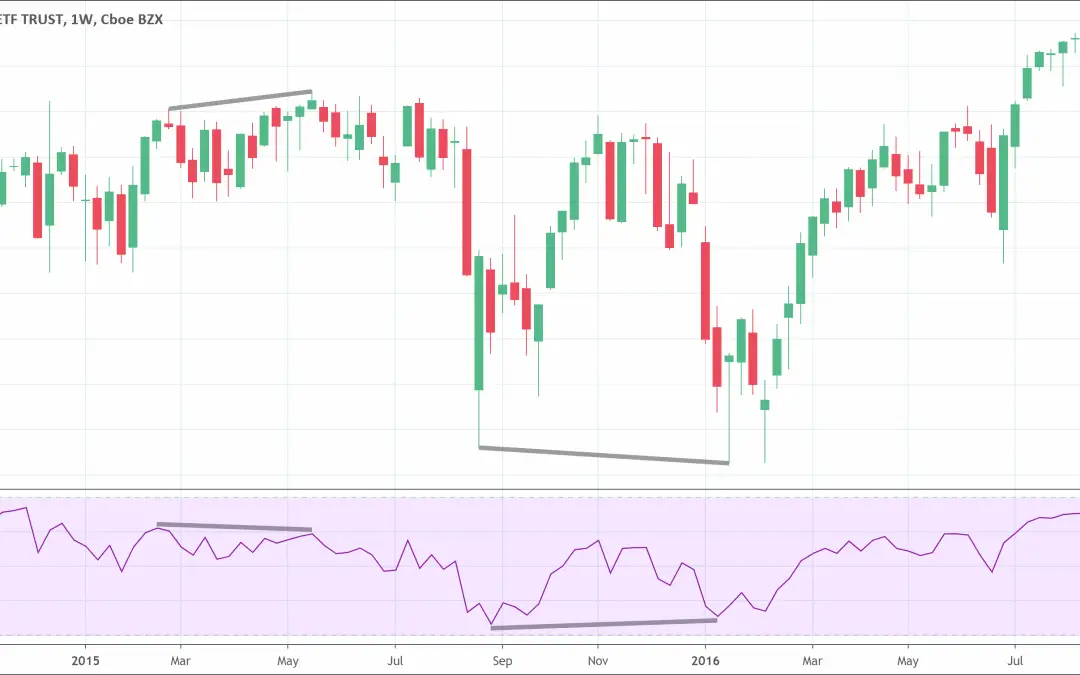
![RSI Divergence: How to interpret & trade it? [Complete Strategy]](https://patternswizard.com/wp-content/uploads/2021/11/rsi-divergence-1080x504.png)
 We loved Marwood Research’s course “Candlestick Analysis For Professional Traders“. Do you want to follow a great video course and deep dive into 26 candlestick patterns (and compare their success rates)? Then make sure to check this course!
