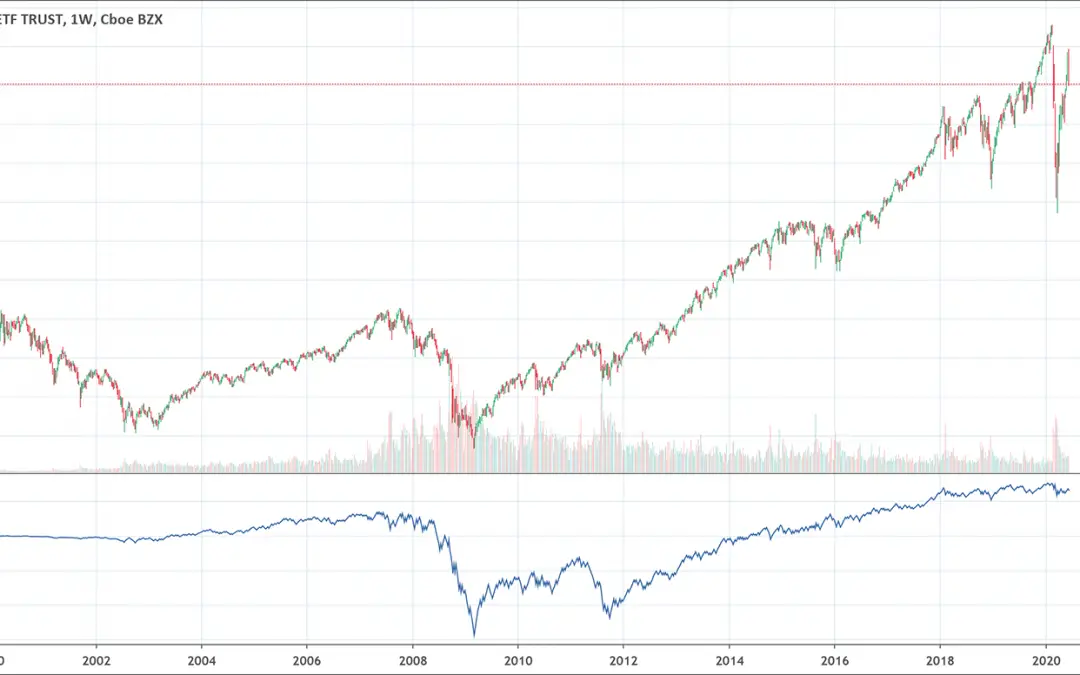
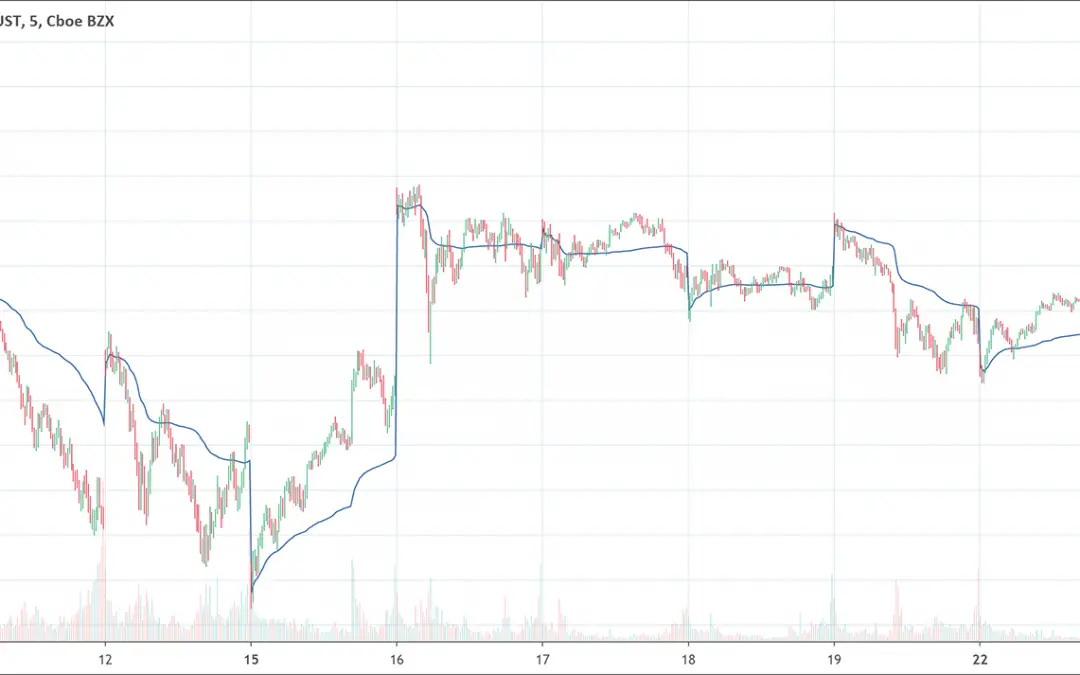
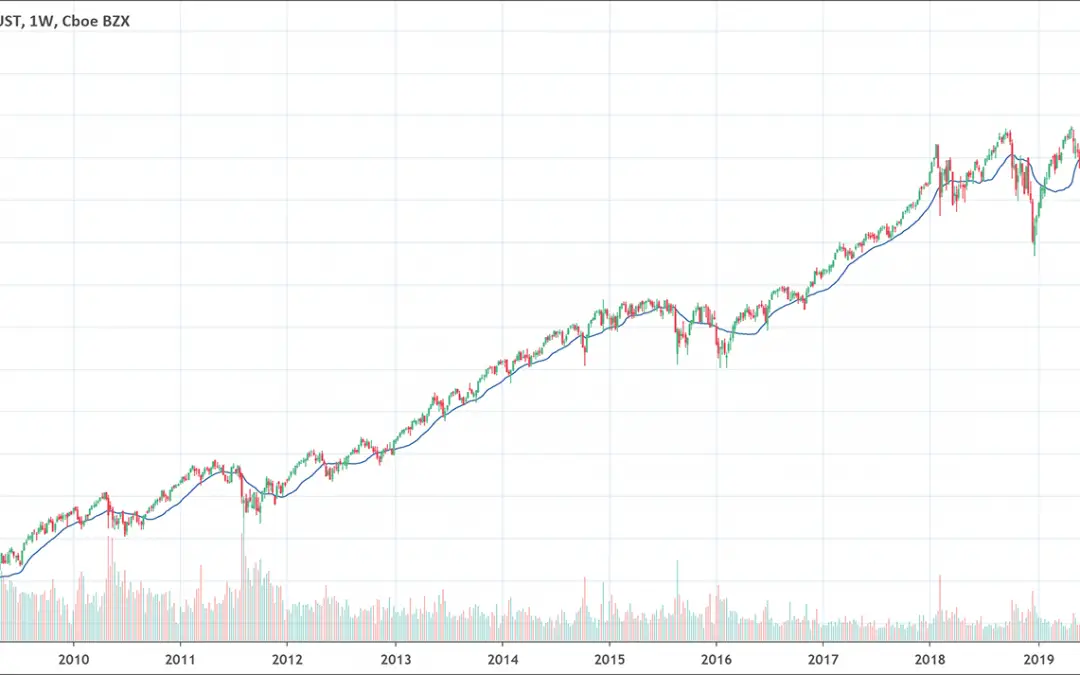
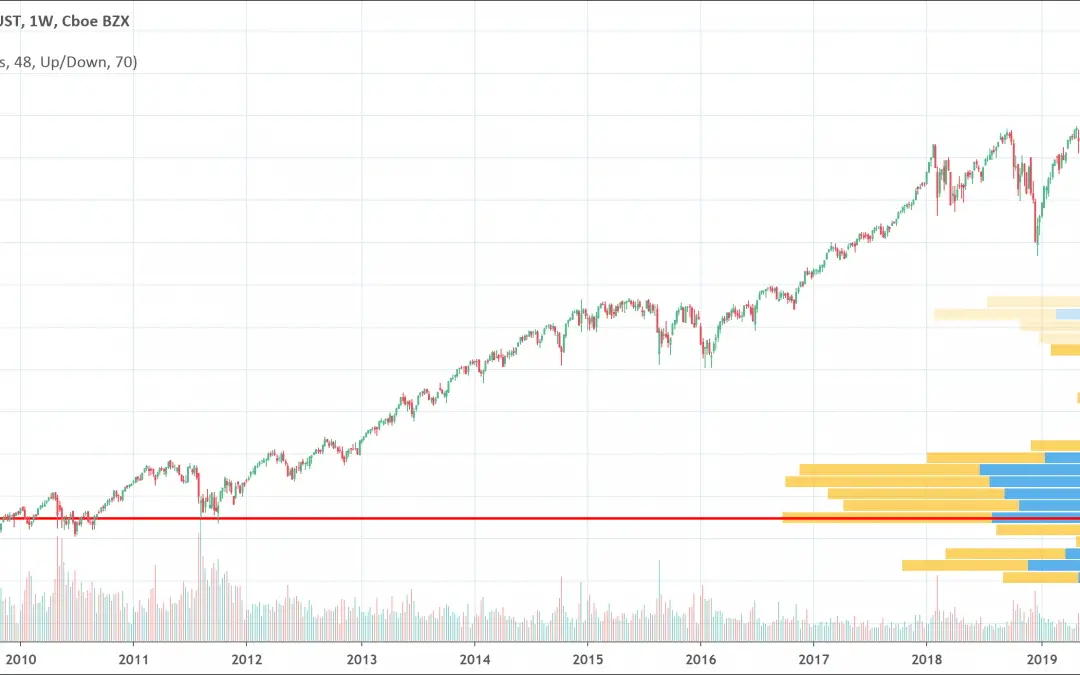
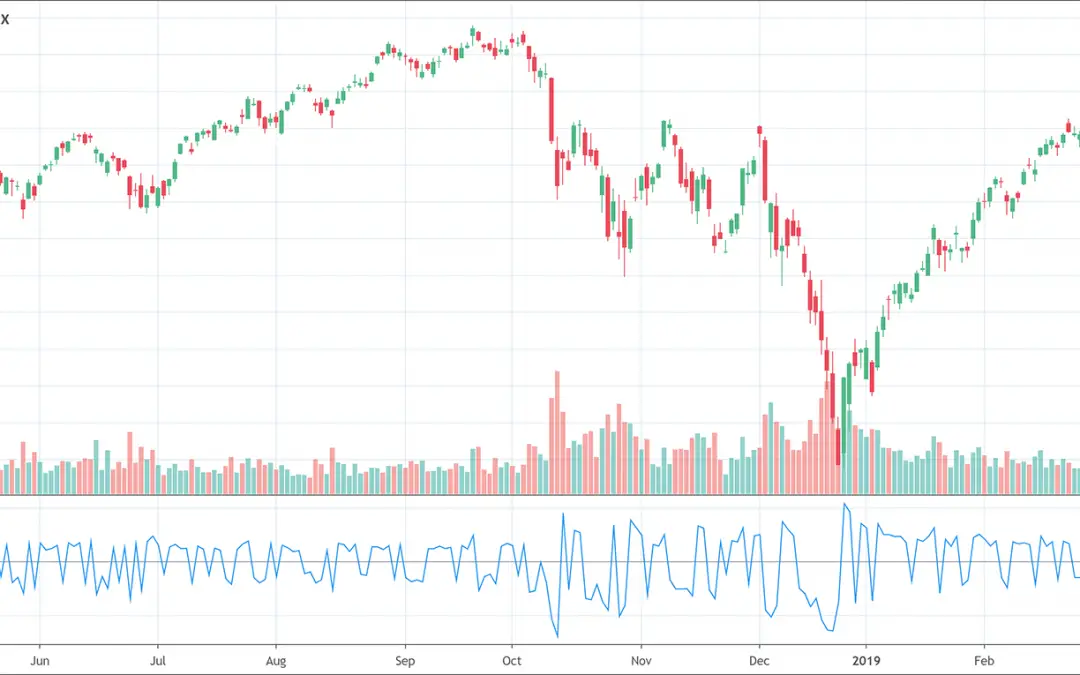
Volume is a key factor when analyzing price action and technical analysis.
Trading volume is a way to show how many assets were traded on any given period of time.
It plays a big role in price movement.
What are volume indicators?
Each indicator tells a different story. That’s why for the same feature (here the volume on a given time period), there can be multiple indicators. Each volume-based indicator does its own computation and uses the volume only or in conjunction with other data. Technical analysis is an approach where you need many stories to point in the same direction to get confident in taking a trade.
The most famous volume indicators are the Accumulation / Distribution indicator, the On Balance Volume, the Stochastic Oscillator, the Negative Volume Index, the VWAP, the VWMA, the Chaikin Money Flow, the Volume Profile and many more.
Each of these technical indicators are very easy to add to your charts using TradingView. As you likely noticed, most of the price charts visible on our site are taken from this tool. There your chart gets updated as price and current volume change.
Click here if you want to test TradingView for free!
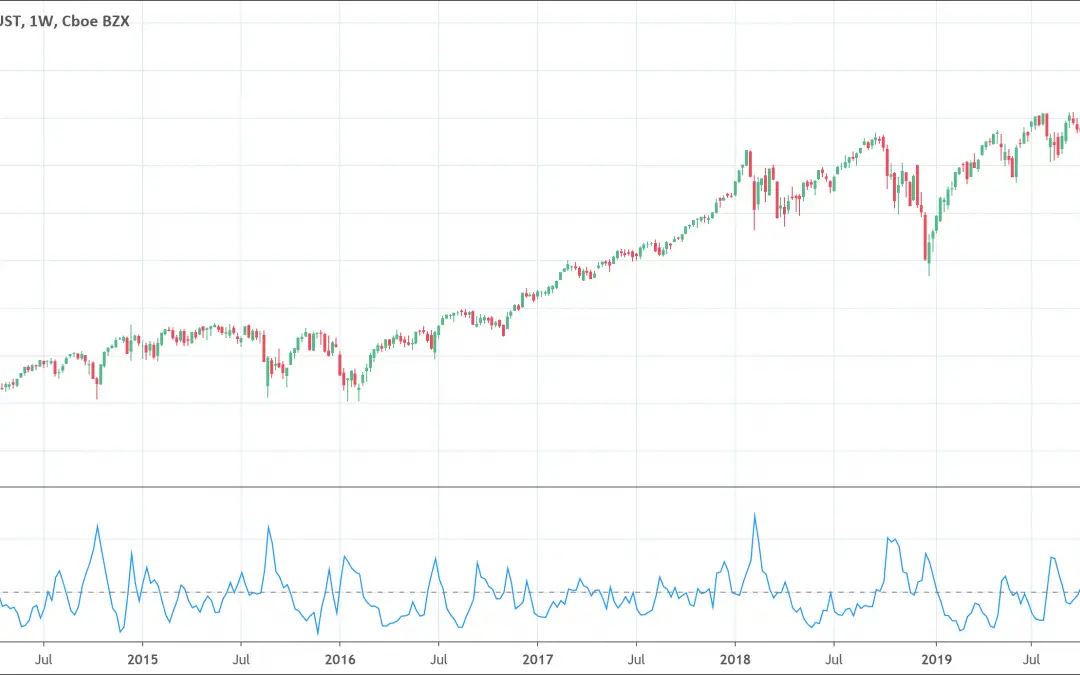
Volume is a great way to assess market trends on a price chart.
Why is high volume important?
High volume is a clear sign that many buyers and sellers are interested in the given asset (may it be a stock, currency pair, commodity, …).
A high volume near resistance levels is a sign many traders are willing to defend this line. The same is true for a support level.
When price is moving in a trend, might it be an up or down trend, an increase in volume when price reaches new extremes is a great signal that this trend is likely to continue.
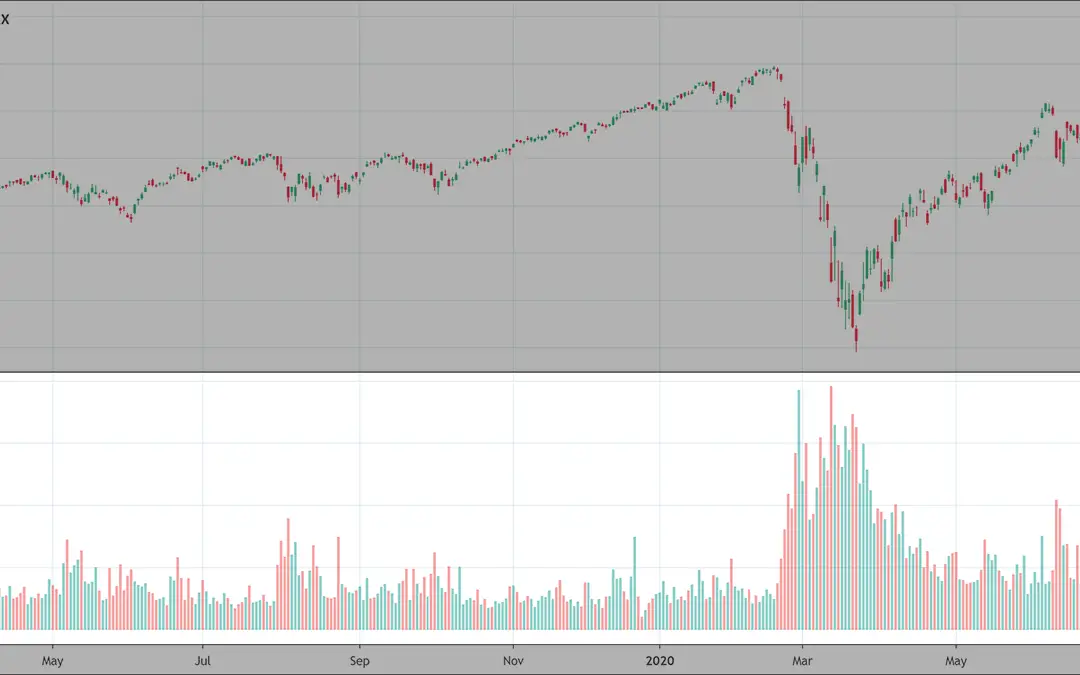
Heavy volume is a sign of strong interest from many traders in the asset at current price levels.
Why is low volume important?
Low volume is a sign of low interest from the traders. It might be because traders are not interested in the asset or it might indicate price reached low interest zones. These zones can be either too high (no new buyer is willing to step in) or too low (no new seller is willing to step in).
When prices reach new highs but volume decreases, it might be a sign that buyer interest is slowing down and the up trend could reverse. The same is true for a new low but reversed (the down trend could reverse).
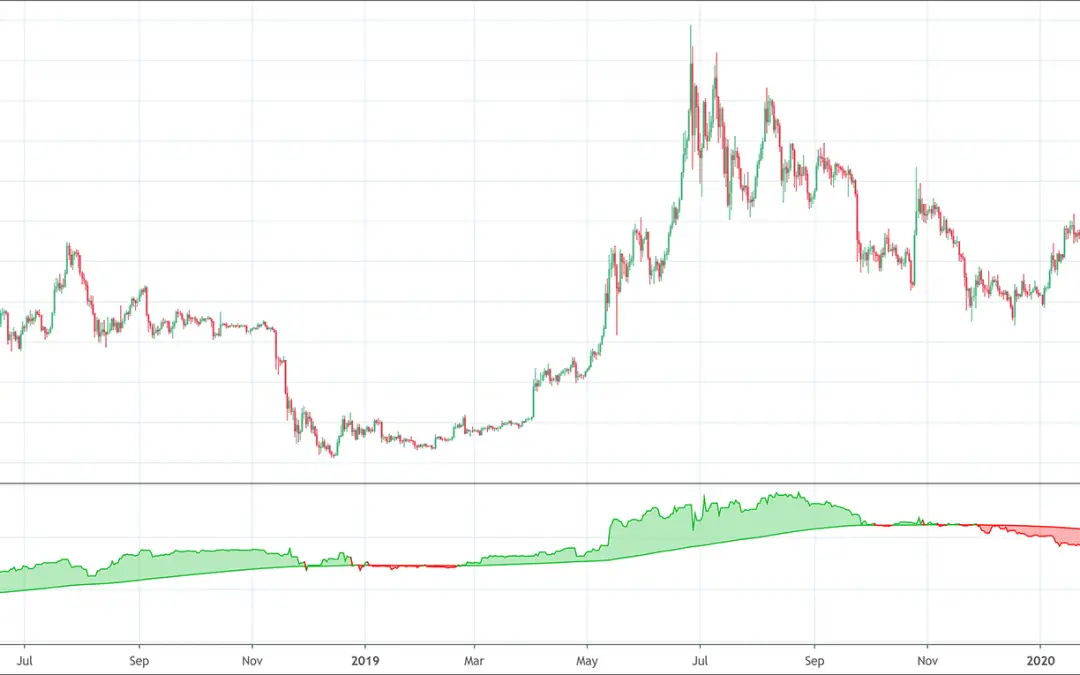
There are many volume indicators
All these hidden interest indications are visible when you encompass a volume analysis in your trading strategy.
Here, you’ll find more than 10 volume indicators described here. Each of them can greatly integrate with chart patterns so you can increase your chance of a trade going your way.
Want to go into the details of a specific volume indicator? You’re at the right place!
Feel free to discover the detailed article for each and every volume indicator right below :
 Good Trading requires the Best Charting Tool!
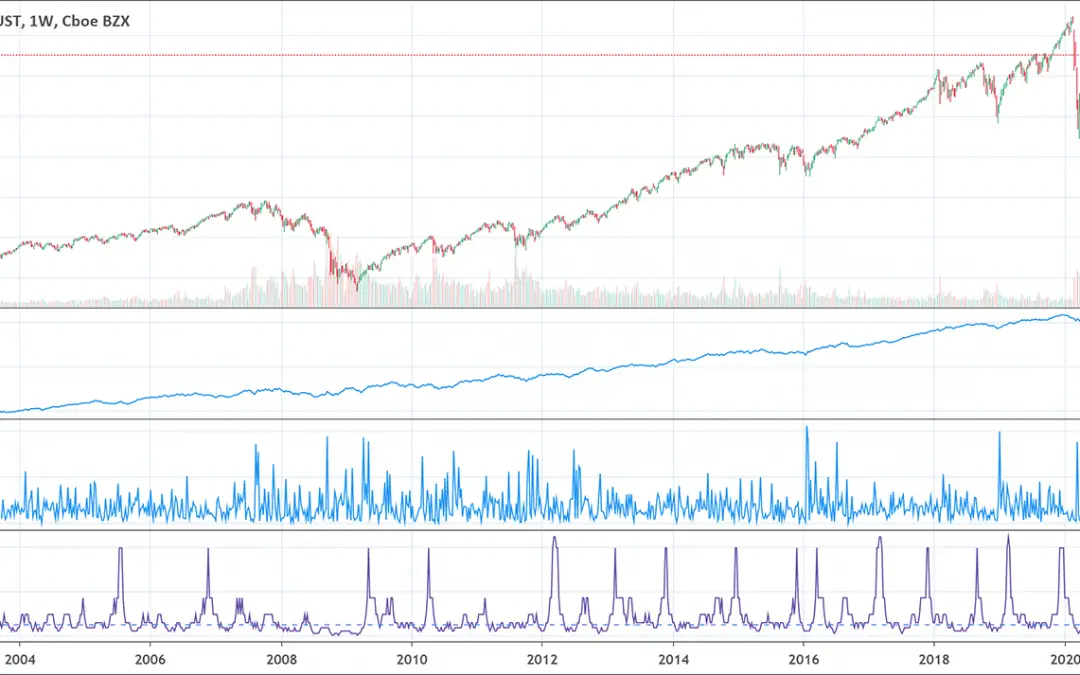
![Volume Price Trend Indicator: Full Guide [2022]](https://patternswizard.com/wp-content/uploads/2020/08/pricevolumetrend-1080x675.png)
 We loved Marwood Research’s course “Candlestick Analysis For Professional Traders“. Do you want to follow a great video course and deep dive into 26 candlestick patterns (and compare their success rates)? Then make sure to check this course!
