
 Good Trading requires the Best Charting Tool!
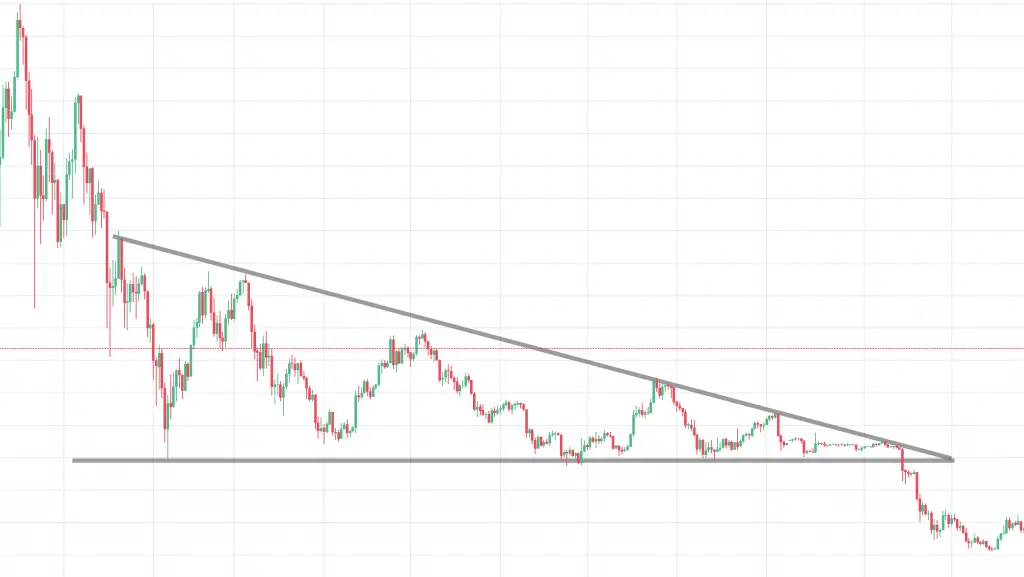
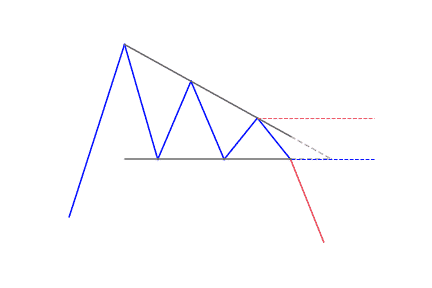
- A descending triangle forms with an horizontal resistance and a descending trendline from the swing highs
- Traders can use the descending triangle pattern as a signal to enter a short position at breakdown
- The opposite technical pattern is the ascending triangle
What is a Descending Triangle pattern?
Also referred to as the ‘falling triangle’, the descending triangle pattern is one of the top continuation patterns that appear in the middle of a trend. Traders anticipate the market to continue in the direction of the bigger trend and accordingly develop trading setups.
It is a bearish chart pattern. It is used in technical analysis that is made by drawing one trend line that connects a series of lower highs and a second horizontal trend line that connects a series of lows. But it can play out as a bullish descending triangle pattern in some instances.
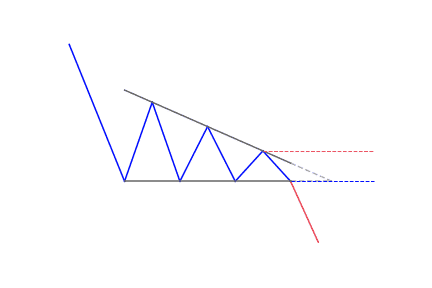
Most times, traders anticipate a move below the lower support trend line. It suggests that the downward momentum is building and a breakdown is imminent. When this breakdown happens, traders enter into short positions and help to aggressively push the price of the asset even lower.
How to identify a Descending Triangle classical pattern?
Main features of a good descending triangle
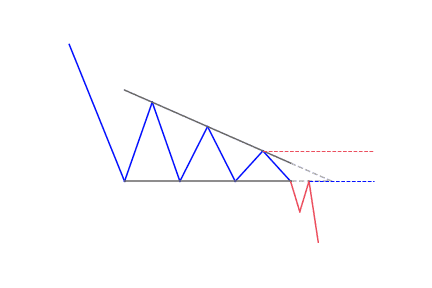
The main features of a descending triangle pattern are:
- A flat support line
- A descending trend line that connects various lower highs
- The descending trend and the flat line of support meets at a point
It can be seen when there is a downtrend composed of a series of lower highs that are connected by a trend line sloping downwards at the top of the descending triangle chart pattern. At the bottom, price tests a strong floor of support at least 3 to 4 times; this is where the price couldn’t push any lower.
It forms in a trend context
The classical pattern forms with a trend line that is sloping and a flat or horizontal support line. The pattern comes up when the price bounces off the level of support at least twice. Downtrend retracement can be conducive to this pattern. The descending triangle is fairly easy to identify once traders know what to look for. The method below can be used in all financial markets (forex, stocks, crypto, …).
- Downtrend: The market has to be in a downtrend before the descending triangle pattern will appear. This is vital and places emphasis that traders should not just trade the pattern whenever the descending triangle comes up.
- Consolidation: The descending triangle then shows up when the market enters the consolidation phase.
- Upper trend line: While the market is consolidating, a downtrend sloping trend line can be drawn by connecting all highs. This shows that the sellers are slowly pulling the price down, which gives further support for a bearish trading bias.
- Lower trend line: This acts as support. Price mostly approaches this level and bounces off until the breakout eventually occurs.
- Trend continuation: After the price posts a strong break below the lower trend line, traders will look for confirmation of the pattern through continued downward momentum.
What does the Descending Triangle charting pattern tell traders?
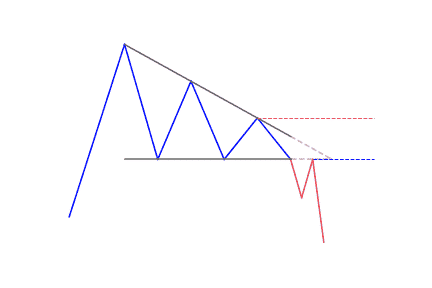
Descending triangle patterns are very popular among traders. It clearly shows that the demand for an asset, commodity or derivative is weakening. When the price breaks below the lower support, it is a clear indication that the downside momentum will probably continue or become even stronger. Descending triangles offer opportunities to technical traders to make great profit over a short period of time. They can form as a reversal pattern to an uptrend, but they are mostly seen as bearish continuation patterns.
How to trade when you see the Descending Triangle pattern?
A lot of traders look to enter a short position following a high volume breakdown from lower trend line support in a descending triangle pattern. Generally, the price target for the chart pattern is the same as the entry price minus the vertical height between the two trend lines at the time of the break. The trend line resistance found at the top can also be a stop loss level. It allows traders to reduce any potential loss they might experience.
When trading the descending triangle, traders have to identify the downtrend. Thereafter, the descending triangle appears as the market begins to consolidate. The measuring technique can be applied once the triangle forms, as traders look forward to the breakout.
After observing a strong break below support, traders can enter a short position. They can set a stop at the recent swing high and take profit target in line with the measuring technique.
Descending Triangle measuring technique
This classical pattern has an inherent measuring technique. It can be applied to the pattern to determine likely take profit targets. For this pattern, traders can measure the distance from the beginning of the pattern, at the highest point of the descending triangle to the flat support line. That same distance can be transposed later on, beginning from the breakout point and ending at the potential take profit level.
What are the differences between Descending and Ascending Triangles?
Both the ascending and descending triangles are continuation patterns. The descending triangle pattern has a horizontal lower trend line and a descending upper trend line, while the ascending triangle pattern has a horizontal trend line on the highs and a rising trend line on the lows. Moreover, triangles show an opportunity to short and suggest a profit target. They are just different looks on a potential breakdown. Ascending triangles can also be formed on a reversal to a downtrend but they are more commonly applied as a bullish continuation pattern.
Limitations of using a Descending Triangle pattern
The limitation this pattern has is the potential for a false breakdown. There are instances where the trend lines will need to be redrawn if the price action breaks out in the opposite direction. There is no perfect chart pattern… If there is no breakdown, the stock could rebound to re-test the upper trend line resistance before it makes another move lower to re-test the lower trend line support levels. The more the price reaches the support and resistance levels, the more reliable will the chart pattern be.
Conclusion
Trading involves hard work and taking calculated risks. Ensure you get familiar with the descending triangle pattern before you commit any real money with this chart pattern. Don’t look for the perfect conditions rather learn how to trade like a pro. The descending triangle chart pattern is nice to have in your trading tool belt alongside other trading strategies.


 We loved Marwood Research’s course “Candlestick Analysis For Professional Traders“. Do you want to follow a great video course and deep dive into 26 candlestick patterns (and compare their success rates)? Then make sure to check this course!