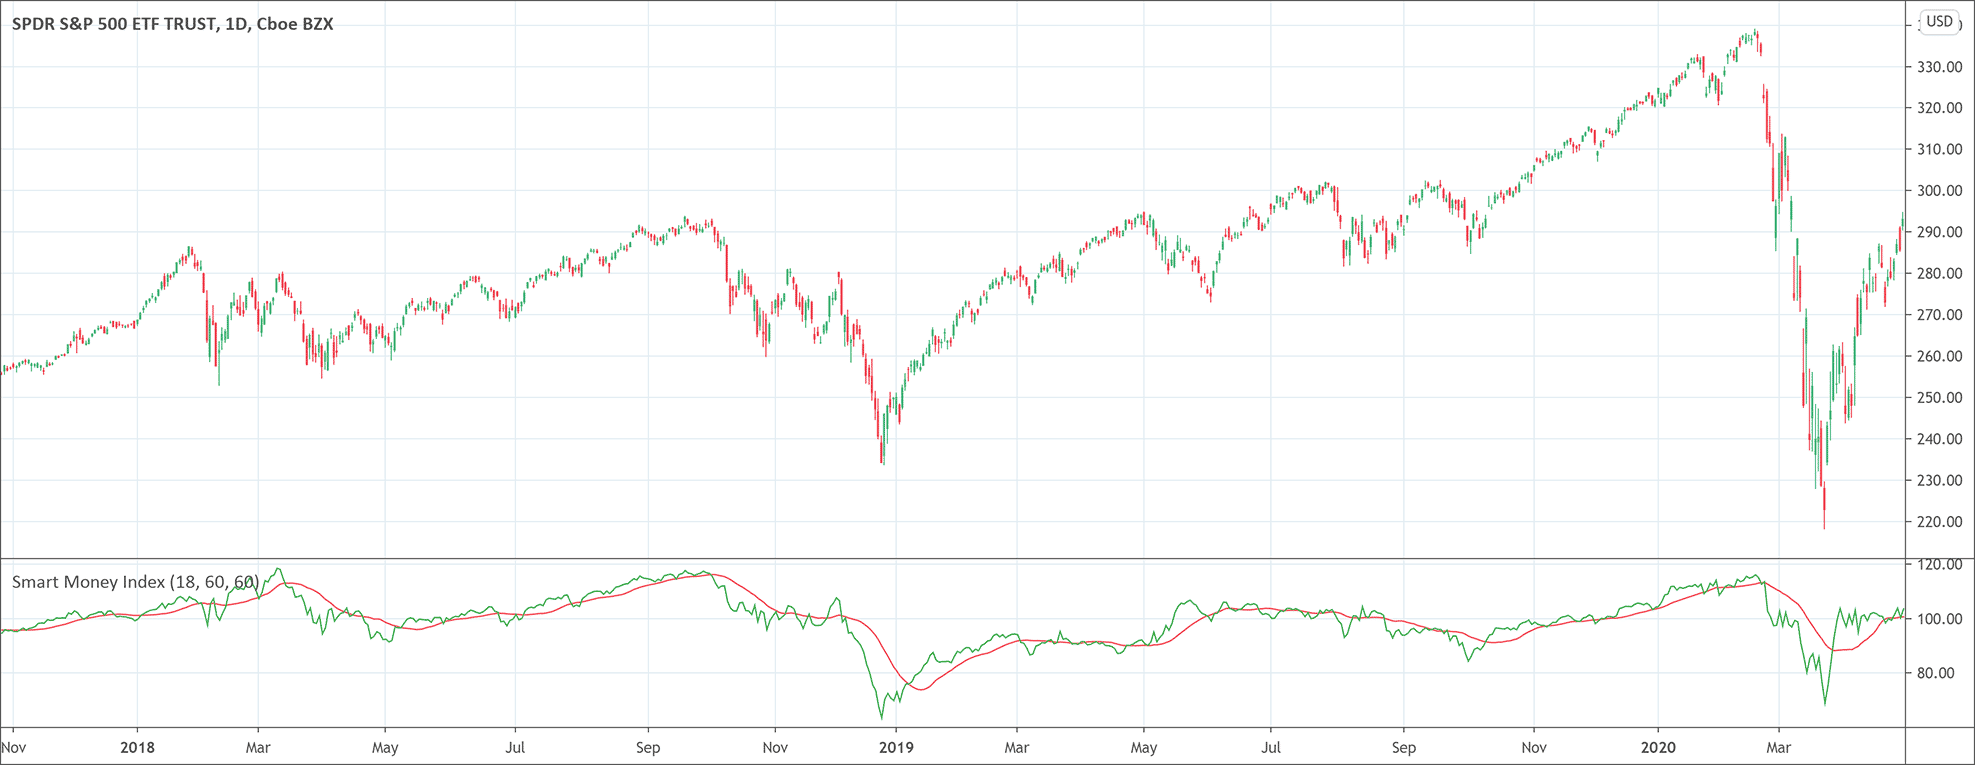
- The smart money flow index or smart money index is an indicator.
- It measures the sentiment of the investors in the market.
The smart money flow index or smart money index is an indicator. It measures the sentiment of the investors in the market. Don Hays, a money manager, introduced and popularized it. The basic principle of the smart money index is that most of the traders show a tendency of overreaction. Especially at the start of the trading day. Overnight news and economic data cause the overreaction of the overnight news and other economic data.
The financial market has generally two types of traders. The first type includes expert traders and hedge fund managers. They are known as the smart money and are adept and expert at trading (it’s their job). On the other hand, the second type consists of novice and inexperienced traders. They are not aware of the trading game. Don Hays developed a smart money flow index to help those traders who do not know about the tricks of trading. His purpose was to guide inexperienced traders to trade like the smart money.
How to calculate the smart money flow index?
The stocks industry is the foundation of the SMFI. The indicator uses the data in the S&P 500 index for calculations. However, it is not the limit of the smart money index rather, it can be used in other types of assets such as cryptocurrencies, currencies, commodities, etc. Time is one of the most important factors for its calculations and traders need to be punctual for trading. The calculations of the smart money index have the following steps.
- Calculations of the nominal gain or loss of the asset during the first half an hour of trading.
- Computations of the market’s gain or loss of the asset during the final hour of trading.
- Calculations of the smart money index using the following formula.
Smart money index = Yesterday’s smart money index – First hour’s gain or loss + market’s gain or loss during the last hour
How to use the smart money flow index?
Traders generally use the smart money flow index to confirm the current trend in the market or to look for divergences.
Confirmation
If the market and the smart money index move in the same direction, it indicates that the smart money index is providing confirmation of the trend.
More specifically, if the stock market is rallying and the smart money flow index and smart money index is also trending high, it is a confirmation of the bullish market trend.
Conversely, if the stock market falls and the smart money index is also trending low, it is a confirmation of the bearish market trend.
Divergence
If the smart money index is going in the opposite direction of the market, it indicates that the market will eventually move in the direction of the smart money index.
More specifically, if the stock market is going down but the smart money index is trending high, it is a signal of bullish divergence. There are strong chances that the market will go up shortly.
On the other hand, if the stock market is rallying but the smart money index is trending low, it is a signal of bearish divergence. Now, there are strong chances that soon the market will fall.
Conclusion
The smart money flow index is a technical analysis tool that helps inexperienced traders to trade like smart money. It helps to confirm and spot divergences. Between these two common uses of the smart money index, traders more often use it to spot divergences. Because divergences assist traders to predict major turning points in the market. Moreover, the smart money index often signals bearish divergence and bullish divergence signals are very rare for it. However, the smart money flow index doesn’t give buying or selling signals. Technical analysts and experts advise using it in conjunction with other technical analysis tools to avoid false signals.

 Good Trading requires the Best Charting Tool!

 We loved Marwood Research’s course “Candlestick Analysis For Professional Traders“. Do you want to follow a great video course and deep dive into 26 candlestick patterns (and compare their success rates)? Then make sure to check this course!