
 Good Trading requires the Best Charting Tool!
- A rising wedge forms when two converging upward slope trendlines encapsulate the price
- It is a bearish pattern
What is a Rising Wedge?
Rising wedge is a popular reversal pattern that can easily be predicted in nature. It offers clues to traders on the direction and distance of the next price move. They commonly appear in financial markets. Traders like the pattern as a result of its simplicity in identification and application. This bearish pattern starts wide at the bottom and contracts as prices move upwards and trading range gets smaller.
The pattern forms when price consolidates between upward sloping support and resistance lines, where the slop of the line of the support slope is steeper than that of the resistance slope. This shows that the higher lows form faster than higher highs, leading to a wedge-like formation – thus the name of this chart pattern.
The rising wedge pattern can both be a reversal or continuation pattern. It depends on its position on the price chart. There are basically two kinds of wedge patterns – the ascending or rising and the descending or falling wedge patterns.
A falling wedge is different from the rising wedge because of the slant of the triangle. It declines downwards between two converging trend lines to get to an apex point which is respected as a bullish pattern. Just like the rising wedge, it can either be a continuation or a reversal signal. As a continuation signal, it forms during an uptrend, meaning that the upward price action would resume. As a reversal signal, it forms at the bottom of a downtrend, meaning that an uptrend would be next.
How to identify a Rising Wedge pattern?
The rising wedge can be both a bearish reversal and bearish continuation pattern which leads to some confusion in the identification of the pattern. Both cases have a different set of observation dynamics which must be put into consideration.
Identifying the Rising Wedge pattern during an uptrend
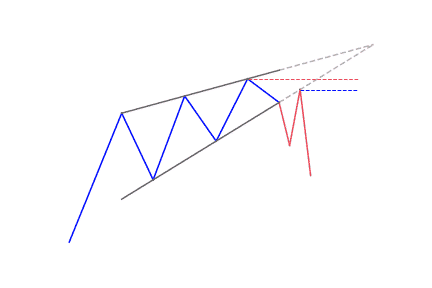
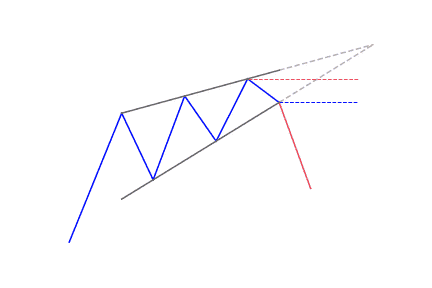
During an uptrend, a rising wedge is a reversal pattern. It forms when the price is making higher highs and higher lows, which appears by a contracting range in prices. The price oscillates within two lines that move closer together to make a pattern. This means there is a slowing of momentum and usually precedes a reversal to the downside. When this happens, you can look for potential opportunities to sell.
In summary:
- Established uptrend
- Formation of rising wedge consolidation
- Linking higher highs with lower lows by using a trend line
- Confirmation of divergence between price and volume by using a volume function
- Confirm overbought signal by using technical tools
- Look for a break below support for short entry
Identifying a Rising Wedge pattern during a downtrend
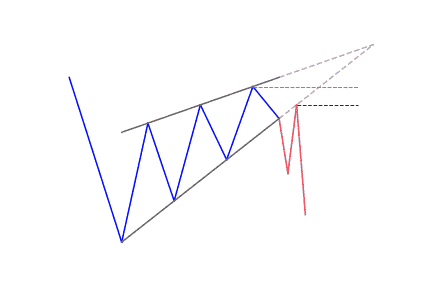
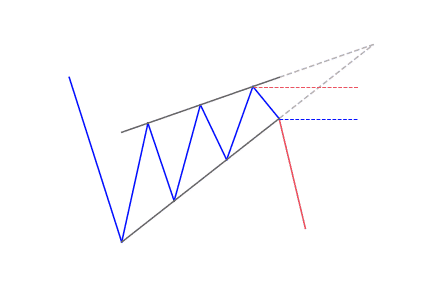
During a downtrend, a rising wedge is a temporary movement of price in the outside market. It’s known as market retracement. Just as it is with the rising wedge in an uptrend, it is characterized by a reduction in prices that are confined within two lines coming together to make a pattern. It shows the continuation of the downtrend, and it means you can look for selling opportunities.
In summary,
- Established downtrend
- Formation of rising wedge consolidation
- Joining higher highs and lower lows by making use of trend line assembling towards a narrowing point
- Confirmation of divergence between price and volume using volume function
- Overbought signal can be confirmed by using technical tools
- Look for break below support for a short entry
What does Rising Wedge pattern tell traders?
With a consolidation in prices, traders know that a big slash is on its way, so they will expect a breakout, either to the top or bottom. When the rising wedge is formed after an uptrend, it is referred to as a bearish reversal pattern. But if it is formed during a downtrend, it could mean a continuation of the down move.
Either way, when this chart pattern is spotted, you may start to get ready with your entry orders.
The rising wedge starts at the bottom and contracts as prices move higher and the trading range contracts. It usually occurs when the price of a security has been rising over time, but it can also happen when there’s a downward trend.
How to trade when you see a Rising Wedge pattern in your favorite market?
First method
After the identification of a rising wedge pattern, whether in an uptrend or a downtrend, one way that can be used to enter the market is to place a sell order, short entry, on the break of the bottom side of the wedge. To get rid of false breakouts, wait for a candle to close below the bottom trend line before entering.
The profit target can be measured by taking the height of the back of the wedge and by extending that distance down from the trend line breakout.
Second method
Another way of trading a rising wedge is to wait for the price to trade below the trend line, known as the broken support, as it is with the first method. After that, place a sell order on the retest of the trend line, since the broken support now becomes resistance. Usually, the stop loss would go above the new resistance area.
Few little known advantages of trading wedge patterns
There are some patterns that appear important in forecasting general price trends. Some studies prove that a wedge pattern will breakout towards a reversal – a bullish breakout for falling wedges and a bearish breakout for rising wedges, more often, with a falling wedge being more reliable for indication than a rising wedge.
The rising wedge can be one of the most difficult chart patterns to recognize and trade accurately. Although it is a consolidation formation, the loss of upside momentum on each successive high offers the pattern its bearish bias. On the other hand, the series of higher highs and higher lows keep the trend inherently bullish. The last break of support shows that the forces of supply have finally worn out and lower prices are likely to be seen. There is no any measuring method to estimate the decline; it is advisable for you to make use of other technical analysis to forecast price targets.


 We loved Marwood Research’s course “Candlestick Analysis For Professional Traders“. Do you want to follow a great video course and deep dive into 26 candlestick patterns (and compare their success rates)? Then make sure to check this course!