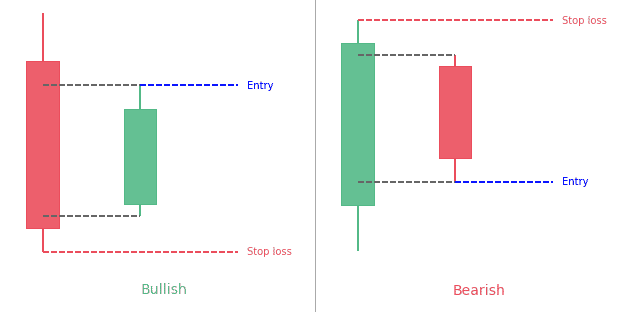
- The Harami pattern is a 2-bar reversal candlestick pattern
- The 2nd bar is contained within the 1st one
Statistics to prove if the Harami pattern really works
Are the odds of the Harami pattern in your favor?
How does the Harami behave with a 2:1 target R/R ratio?
From our research the Harami pattern confirms 55.8% of the time on average overall all the 4120 markets we analysed. Historically, this patterns confirmed within 2.7 candles or got invalidated within 3.8 candles. If confirmed, it reached the 2:1 R/R target 40.6% of the time and it retested it's entry price level 94.2% of the time.
Not accounting for fees, it has an expected outcome of 0.219 $/$.
It means for every $100 you risk on a trade with the Harami pattern you make $21.9 on average.
Want to account for your trading fees? Have the detailled stats for your favorite markets / timeframes? Or get the stats for another R/R than 2:1?
🚀 Join us now and get fine-tuned stats you care about!
How to handle risk with the Harami pattern?
We analysed 4120 markets for the last 59 years and we found 377 842 occurrences of the Harami pattern.
On average markets printed 1 Harami pattern every 41 candles.
For 2:1 R/R trades, the longest winning streak observed was 14 and the longest losing streak was 22. A trading strategy relying solely on this pattern is not advised. Anyway, make sure to use proper risk management.
Keep in mind all these informations are for educational purposes only and are NOT financial advice.
If you want to learn more and deep dive into candlestick patterns performance statistics, I strongly recommend you follow the best available course about it. Joe Marwood (who's a famous trader with more than 45 000 Twitter followers) created an online course called "Candlestick Analysis For Professional Traders" in his Marwood Research University. There he will take you through the extensive backtesting of the 26 main candlestick patterns. He then summarizes which one is THE best pattern. Do you know which one it is?
Remember, don't trade if you don't know your stats. Click here to signup to the course now!
What is the Harami candlestick pattern?
Even though the word Harami appears in the Hindi language that is not what the context of this article refers to. The Harami which is applicable here is an old Japanese word which means pregnant or conception. With this image in mind, it will be easier to grasp the candlestick formation we will describe here. We are talking about a two candle pattern. The first one stands tall and the second one is substantially shorter. For easy reference the second candle is different in color to the first one. The Harami candlestick pattern hints at a trend reversal possibility. Furthermore, there are 2 types of patterns as far as harami is concerned the bearish and the bullish patterns.
How to identify the Harami candlestick pattern?
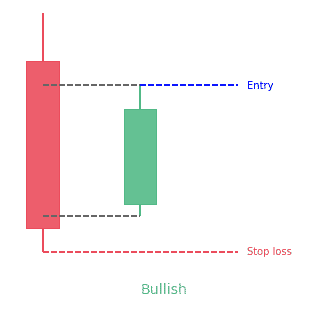
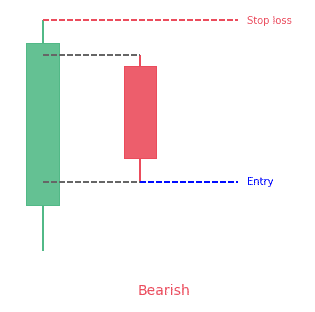
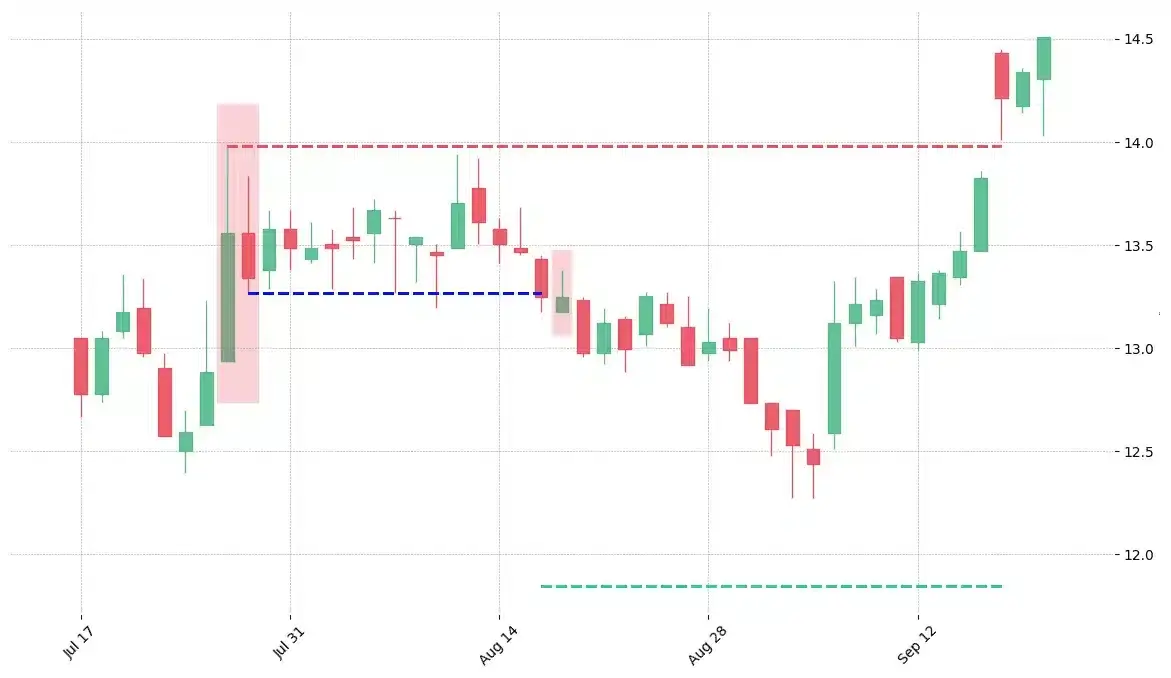
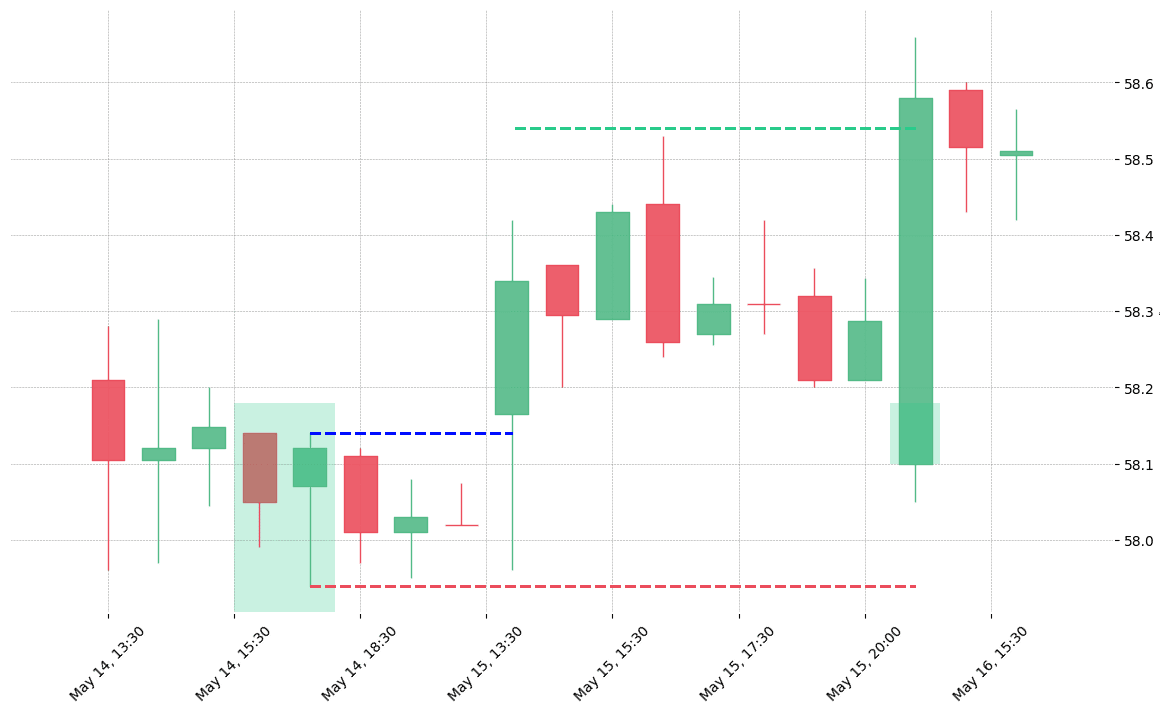
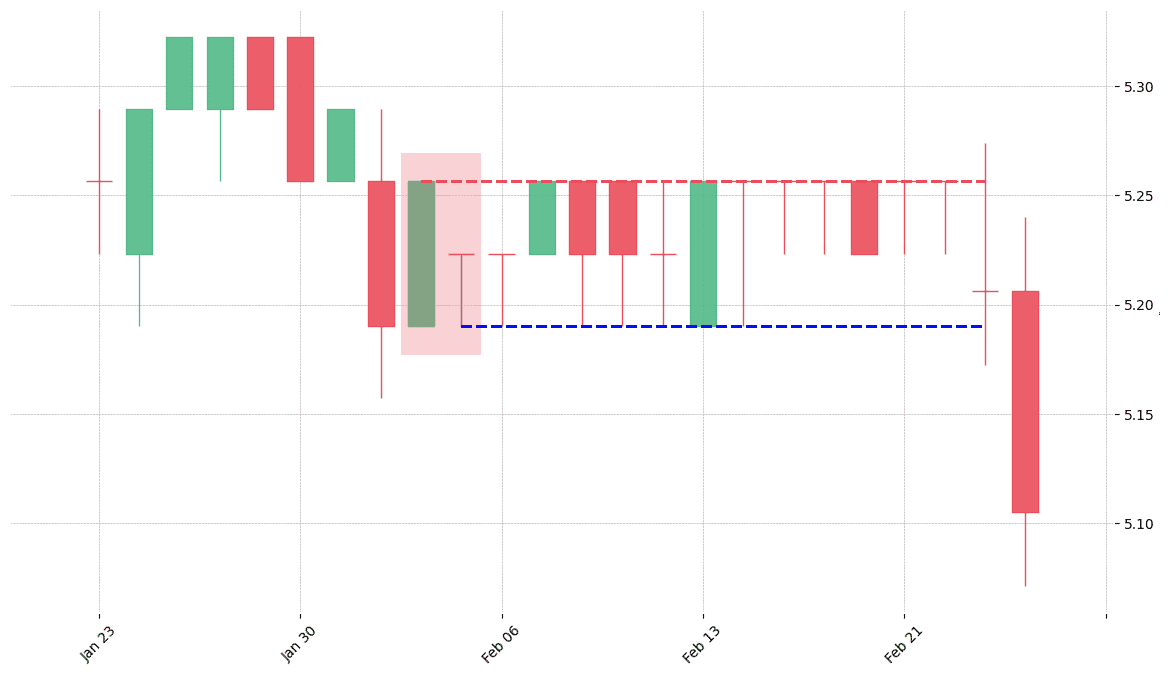
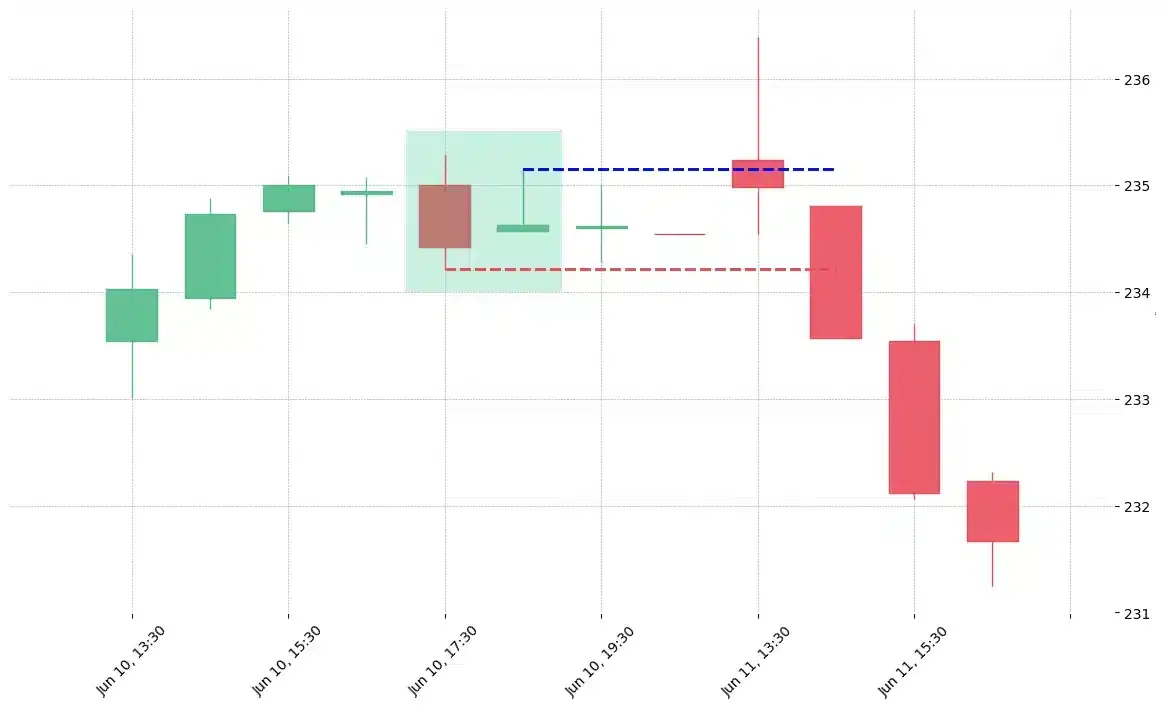
When you look at the Harami candlestick pattern it represents two candlesticks. The first one being quite large and the second one significantly smaller. Also the second candlestick is contained within the body of the first candlestick. This is where the reference to the Japanese word Harami comes in referring to a condition of pregnancy or conception. This is presenting a picture with the mother figure with the larger body being the first candlestick. Then there is the smaller body represented by the smaller candlestick which is actually confined within the first body.
Therefore, when it comes to trading the following criteria has to be considered in order to successfully identify the Harami candlestick pattern. There will always be a prevailing trend regardless of whether it is a downtrend or an uptrend. It is necessary that the first candle or the main body must continue with the original direction of the trend. This body will have the same color as the current trend and it will also have a long body. Furthermore, in order to be a Harami candlestick pattern the second candle has to be contained within the body of the first candle.
Also, all activities such as opening and closing takes place within the body of the first candle. It will have a different color and in appearance it will have a smaller body than the large candlestick. There is one principal criteria for it to be a Harami. The first candlestick’s body contains the body of the second one.
What does the Harami pattern tell traders?
In trading the second or confirming candle is a very important tool. The smaller candle indicates to traders wether they should conceive a reversal or a continuation. As far as a technical analysis is concerned the Harami pattern is very popular. It’s mainly due to its ability to quickly indicate a reversal. This always happens at a highly opportune time in conjunction with a tight risk. Because of this early indication extremely valuable risk reward ratios will be available to traders. It’s a great advantage they can benefit tremendously.
A technical analysis using the Harami candlestick pattern makes it possible to quickly identify an existing downtrend. It will allow traders to look for signals that there is a slowdown or reversal as far as momentum is concerned. During the technical analysis it is important to always ensure that the size of the small candle will never exceed 25% of the large candle. During the process it will be seen that the entire bullish candle is encircled by the body of the previous bearish candle.
How to trade when you see the Harami pattern?
On the day after the bullish Harami occured when there is a price increase this could signal that it is time to buy. Therefore, when a bullish Harami pattern appears in conjunction with a trendline break then this could mostly be interpreted as a buy signal. On the other hand, it could be time to sell when on the day after the bearish Harami occurred if there are further price reductions which are closing below the upward support trendline. This is why when a trendline break and a bearish Harami pattern is seen together this could be a potential sell signal.
Therefore, a bullish Harami is a reversal pattern. It often prints after a downtrend. On the other hand, a bearish Harami is also a reversal pattern. This time, it often prints after an uptrend. It always is a sound trading strategy to confirm each signal with other confluent trading signals (trendline break can be one of them).
What you should know more for Harami
Technical analysts are always looking for quick ways to analyze all of the daily market performance data. In order to do so they will rely on patterns which can be observed in candlestick charts and this can be a great help to quickly get an accurate picture which can then be used to make instant decisions. In this process traders always depend on the bullish harami and its partner in crime the bearish Harami. These two patterns are used to accurately predict future reversals as far as the trending direction of prices is concerned. In this regard, candlestick chart analysis provides access to a variety of patterns. These patterns can accurately predict future trends.
There is also the dark cloud cover and the piercing pattern. The dark cloud cover is simply another two candles bearish reversal pattern. However, in this instance the body of the first candle is long and is green in color. It may then be observed that the market opens by indicating an upward gap when compared to the closing of the previous day. Momentum decreases and the gap fills immediately. Traders can interpret it as a bearish sign. Nevertheless, in order to be a dark cloud cover the observed fall should continue and furthermore prices should close at the end of the day below the middle of the preceding days body.
On the other hand, the piercing pattern is a bullish pattern and this is almost the opposite of the dark cloud cover which has been mentioned previously. In this regard, we can commonly observe long red candles in a bear market. Just like on a normal bear market day it will be seen that prices opened lower when they are compared to the close of the previous day. However, bears often lose control and therefore the gap fills very quickly. When the bulls take control, price continues to increase. It results in a closing above the halfway mark. The red candle on the previous day was the sign of it.
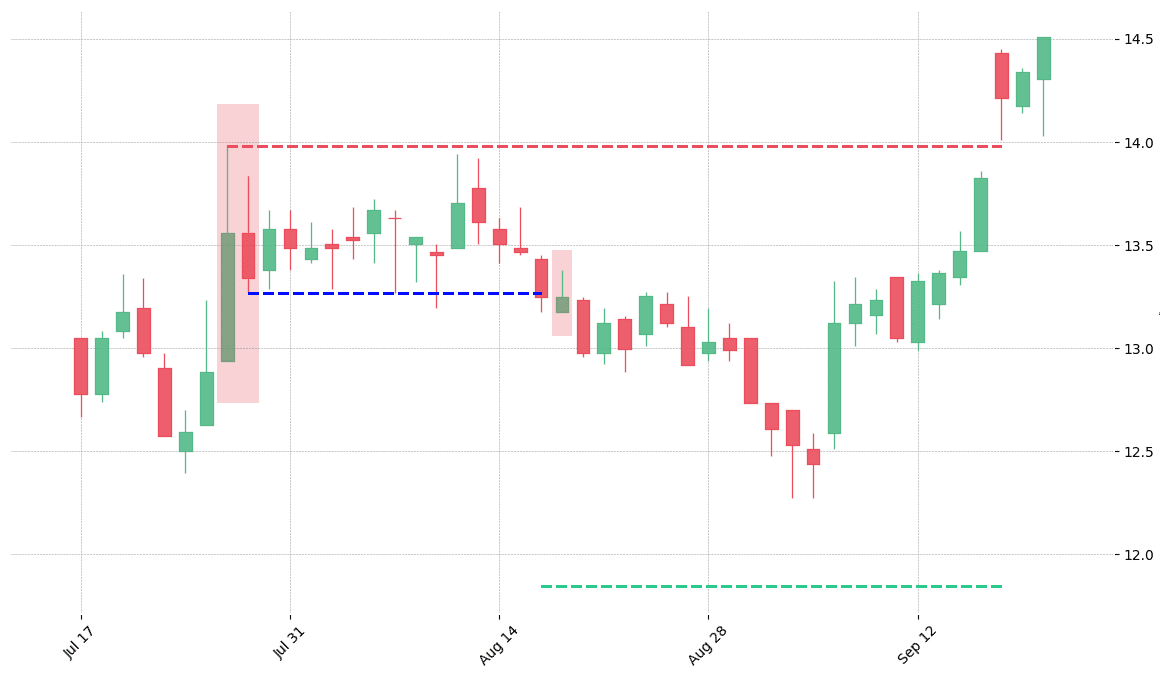
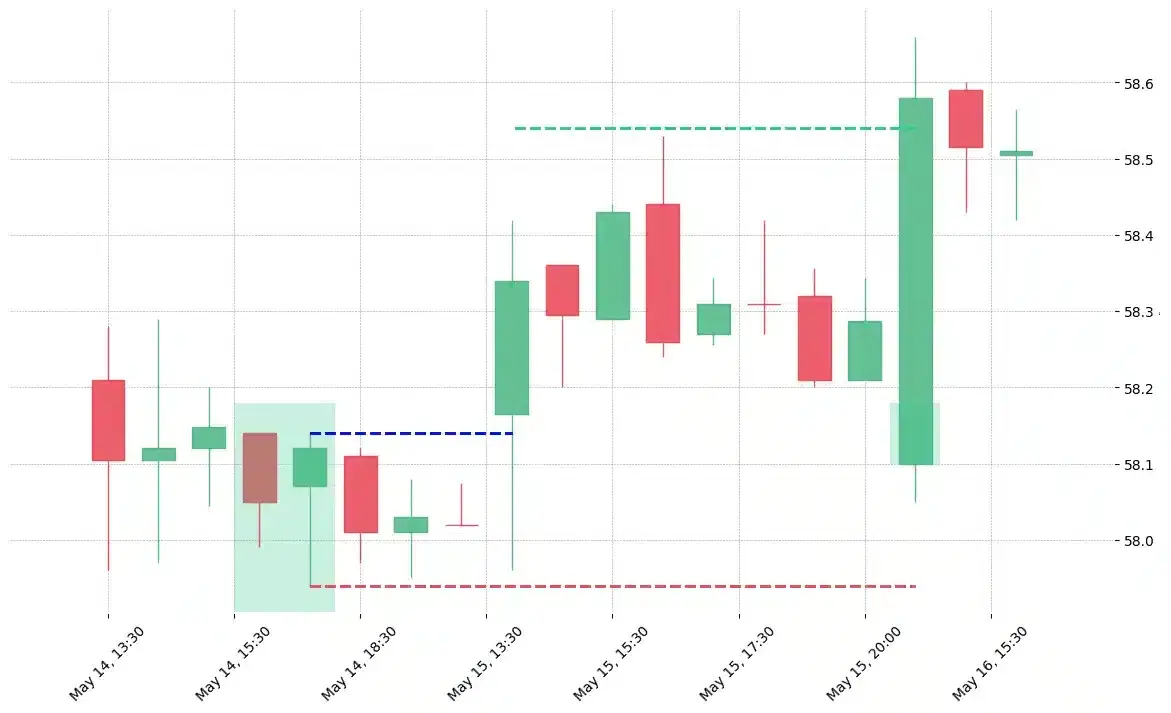
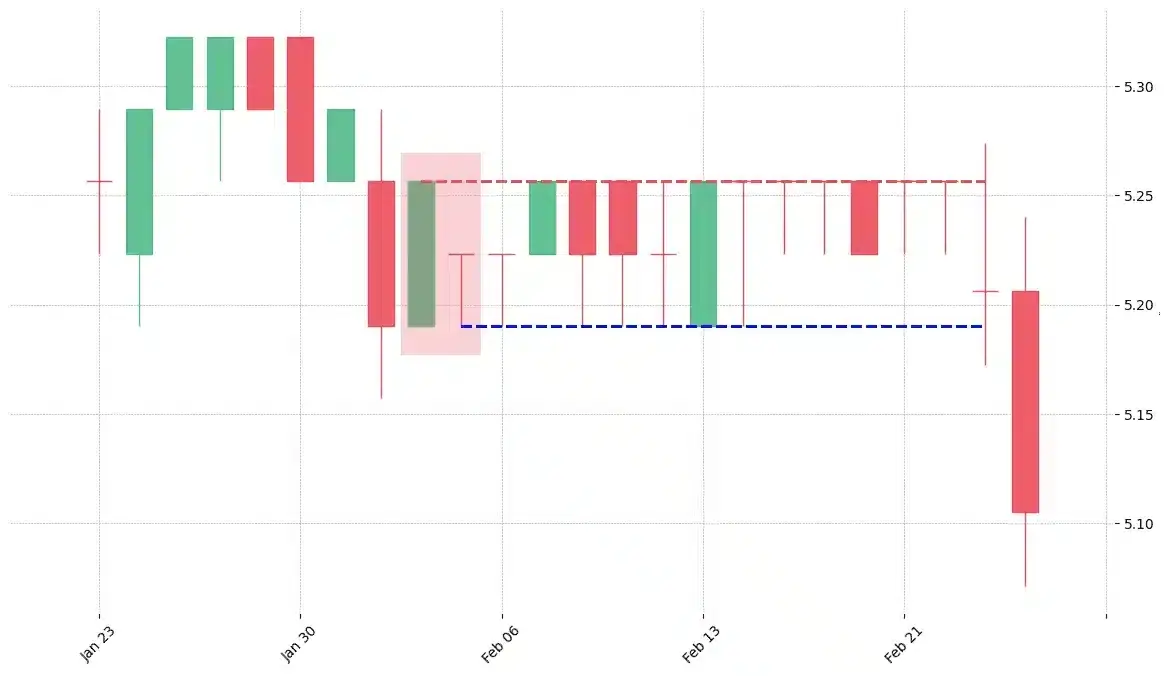
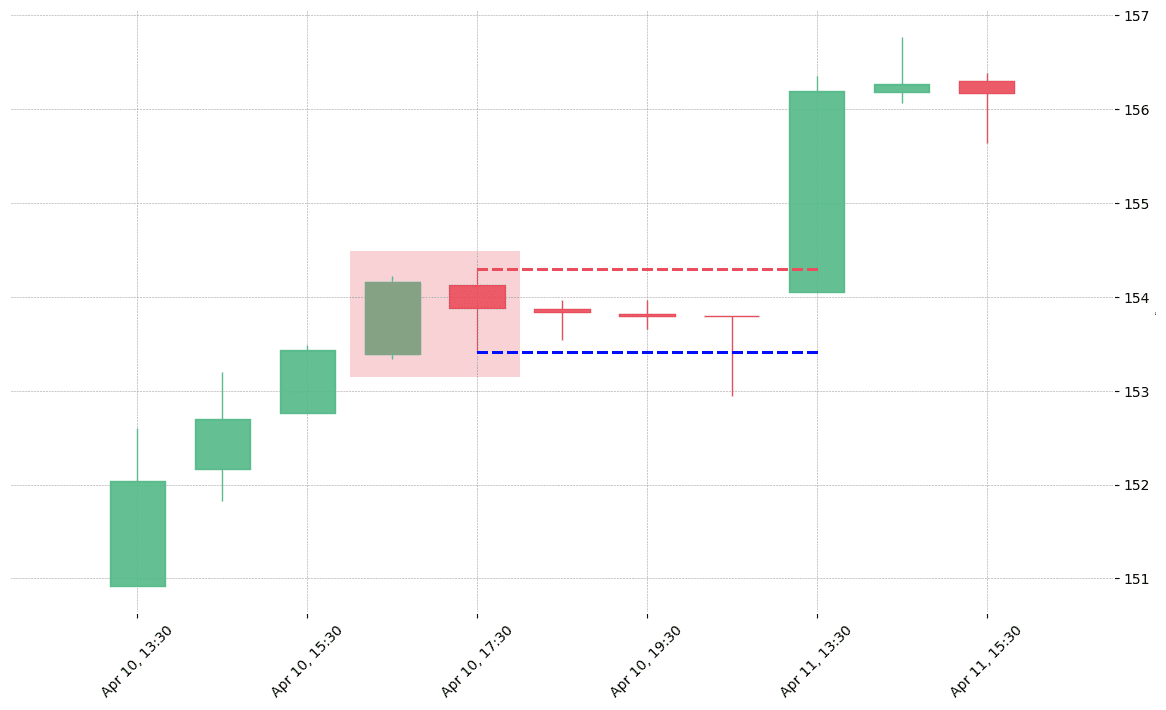
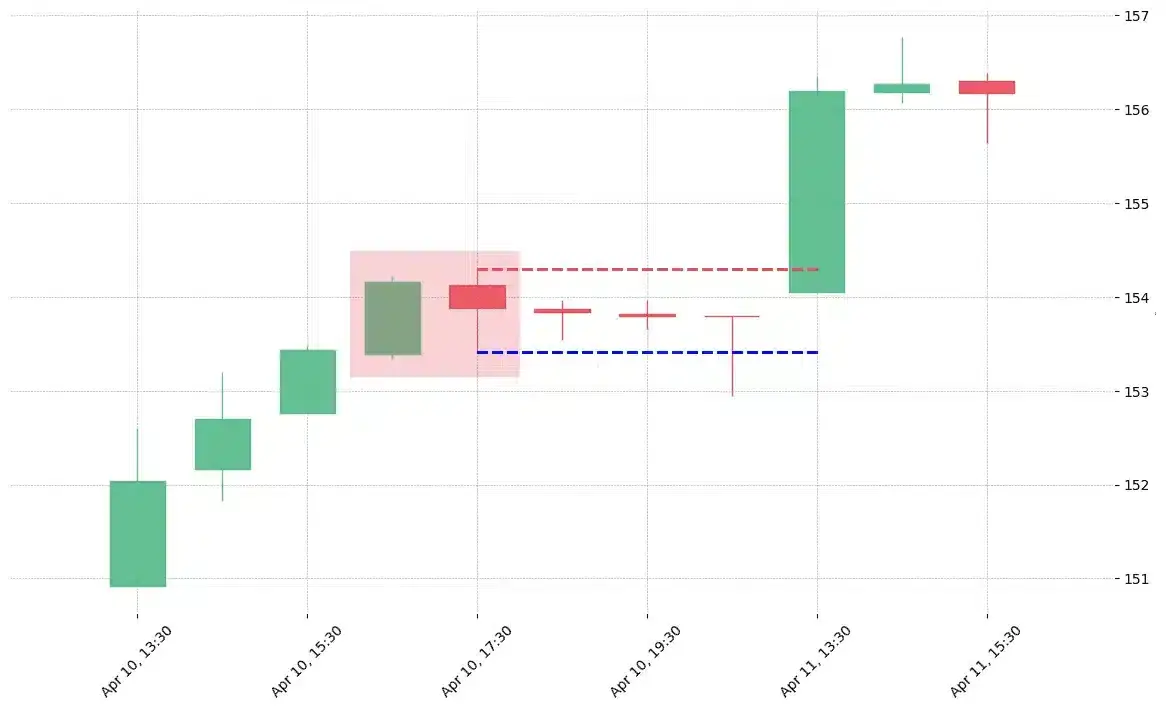
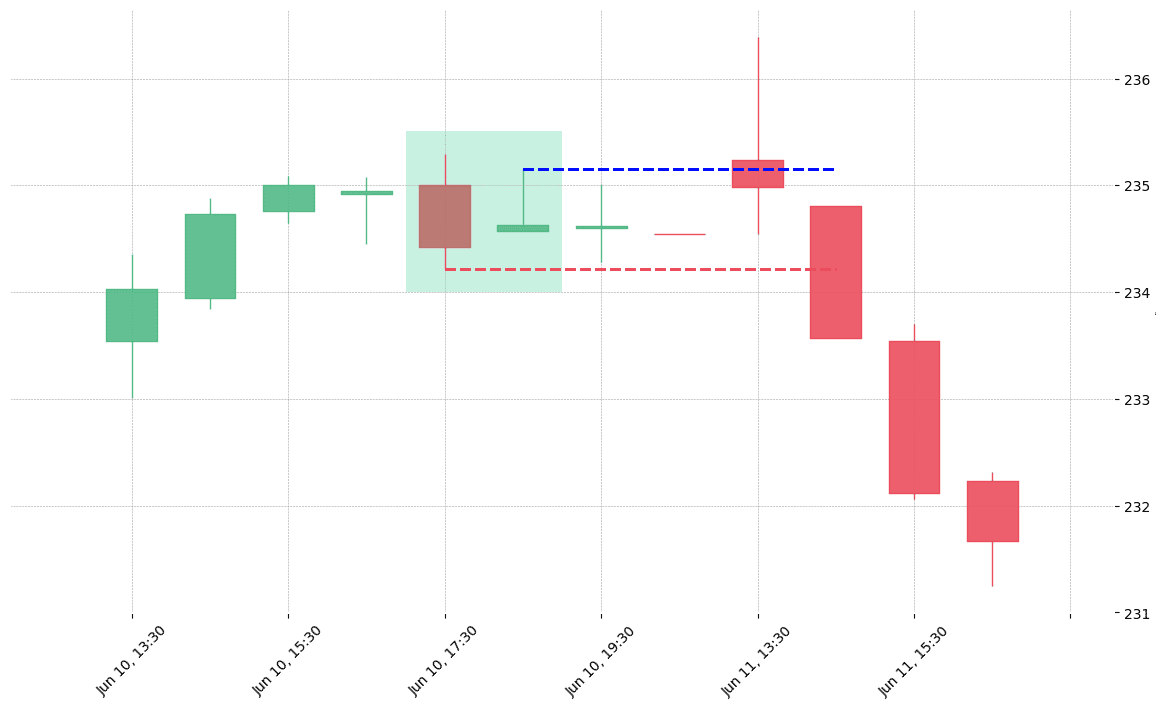
How does the Harami pattern look in real life?
Looking to learn more about this pattern?
You should take a look at Joe Marwood's online course. In his course, he backtested the 26 main candlestick patterns before to summarize which one is THE best pattern. I really liked his course and you shouldn't miss it!
Click here to signup to his "Candlestick Analysis For Professional Traders" course now!
 Good Trading requires the Best Charting Tool!


 We loved Marwood Research’s course “Candlestick Analysis For Professional Traders“. Do you want to follow a great video course and deep dive into 26 candlestick patterns (and compare their success rates)? Then make sure to check this course!