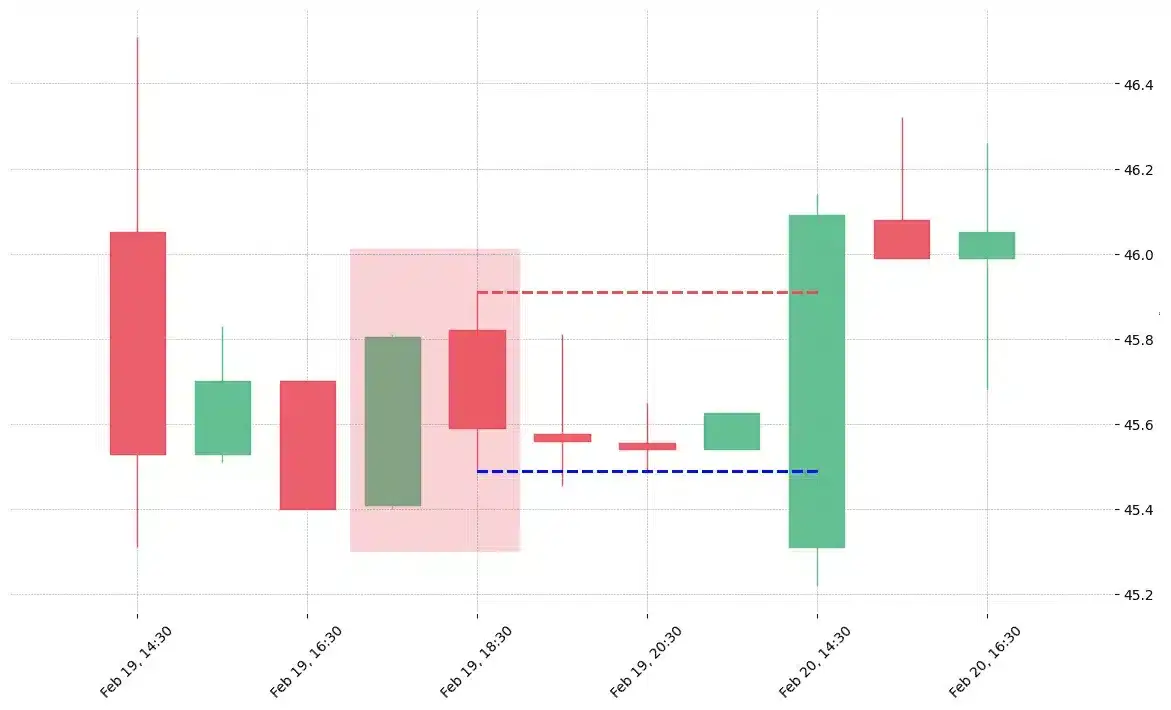
- The dark cloud cover is a 2-bar bearish reversal candlestick pattern
- It starts with a green candle
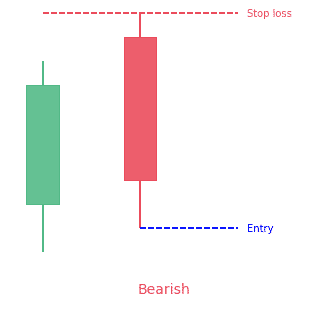
- The second candle opens above the first one (gap) but then closes below the midpoint of the prior bullish candle
- Both candles show be quite large
Statistics to prove if the Dark Cloud Cover pattern really works
Are the odds of the Dark Cloud Cover pattern in your favor?
How does the Dark Cloud Cover behave with a 2:1 target R/R ratio?
From our research the Dark Cloud Cover pattern confirms 66.6% of the time on average overall all the 4120 markets we analysed. Historically, this patterns confirmed within 2 candles or got invalidated within 4.1 candles. If confirmed, it reached the 2:1 R/R target 35.4% of the time and it retested it's entry price level 97.9% of the time.
Not accounting for fees, it has an expected outcome of 0.061 $/$.
It means for every $100 you risk on a trade with the Dark Cloud Cover pattern you make $6.1 on average.
Want to account for your trading fees? Have the detailled stats for your favorite markets / timeframes? Or get the stats for another R/R than 2:1?
🚀 Join us now and get fine-tuned stats you care about!
How to handle risk with the Dark Cloud Cover pattern?
We analysed 4120 markets for the last 59 years and we found 15 238 occurrences of the Dark Cloud Cover pattern.
On average markets printed 1 Dark Cloud Cover pattern every 1 024 candles.
For 2:1 R/R trades, the longest winning streak observed was 9 and the longest losing streak was 18. A trading strategy relying solely on this pattern is not advised. Anyway, make sure to use proper risk management.
Keep in mind all these informations are for educational purposes only and are NOT financial advice.
If you want to learn more and deep dive into candlestick patterns performance statistics, I strongly recommend you follow the best available course about it. Joe Marwood (who's a famous trader with more than 45 000 Twitter followers) created an online course called "Candlestick Analysis For Professional Traders" in his Marwood Research University. There he will take you through the extensive backtesting of the 26 main candlestick patterns. He then summarizes which one is THE best pattern. Do you know which one it is?
Remember, don't trade if you don't know your stats. Click here to signup to the course now!
Many traders use the dark cloud candlestick pattern to spot any reversal in the market. It allows them to create favorable risk to reward ratios. It is easy to spot, however, traders need to look at how the dark cloud cover candlestick forms in relation with other vital factors and avoid simply going into a trade immediately when the pattern appears.
Dark cloud cover is a bearish reversal candlestick pattern. It appears when a down candle (red or black) opens above the close of the previous up candle (green or white), and then closes below the middle of the upper candle.
What is the Dark Cloud Cover candlestick pattern?
Definition
The dark cloud cover is a bearish top reversal or trend reversal pattern. It is present in an uptrend and indicates a potential weak uptrend. It is a two-candlestick pattern and looks like the piercing pattern. Since it is a bearish trend reversal pattern, the dark cloud cover is only valid if it shows up in an uptrend.
The first candlestick in this pattern has to be a light candlestick with a big real body. The next candlestick must be a dark candlestick that opens over the high of the first candlestick but closes well into the real body of the first candlestick. It indicates a change in sentiment.
Variations
Traders can rely more on the pattern if the second candlestick ends below the midpoint of the first candlestick. The deeper the second candlestick penetrates, the more important it becomes. It also becomes more important if the two candlesticks that form the pattern are Marubozu candlesticks, having no lower or upper shadows.
Just like many other trend reversal patterns, the dark cloud cover pattern depends on its location. It depends on where it appears on the price chart in relation to the pivot points, trend lines, and support and resistance lines. This pattern at or near a trend line or a resistance line can be used to confirm that the test of the trend line will fail. The high point of the dark cloud cover pattern can also serve as a resistance line. It can then be a possible location for a stop loss.
As with a bearish engulfing pattern, buyers drive the price higher at the start. Sellers then take over later and drive the price sharply lower. This shift from buying to selling shows that a price reversal to the downside could occur.
How to identify the Dark Cloud Cover pattern?
Pattern criteria
The criteria for identifying the pattern are:
- A current bullish uptrend.
- Signals that show that momentum is reversing (an up candle in the uptrend).
- The security (stock, forex, …) will experience a gap up on the next day; the red candle will open over the green candle of the previous day. This is rare in forex as the candles will likely open at the same level as the close of the previous candle.
- The gap up becomes into a down (bearish) candle
- The red candle closes below the middle of the previous green candle.
- Look for the confirmation of a new downward trend.
Price context
Further, the pattern is characterized by black and white candlesticks that have long real bodies and short or absent shadows. These qualities mean that the lower move was both significant and highly decisive in terms of the movement of price. Also look for a confirmation in the form of a bearish candle in the pattern. The price is expected to decrease after the dark cloud cover. If it doesn’t that means the pattern may have failed.
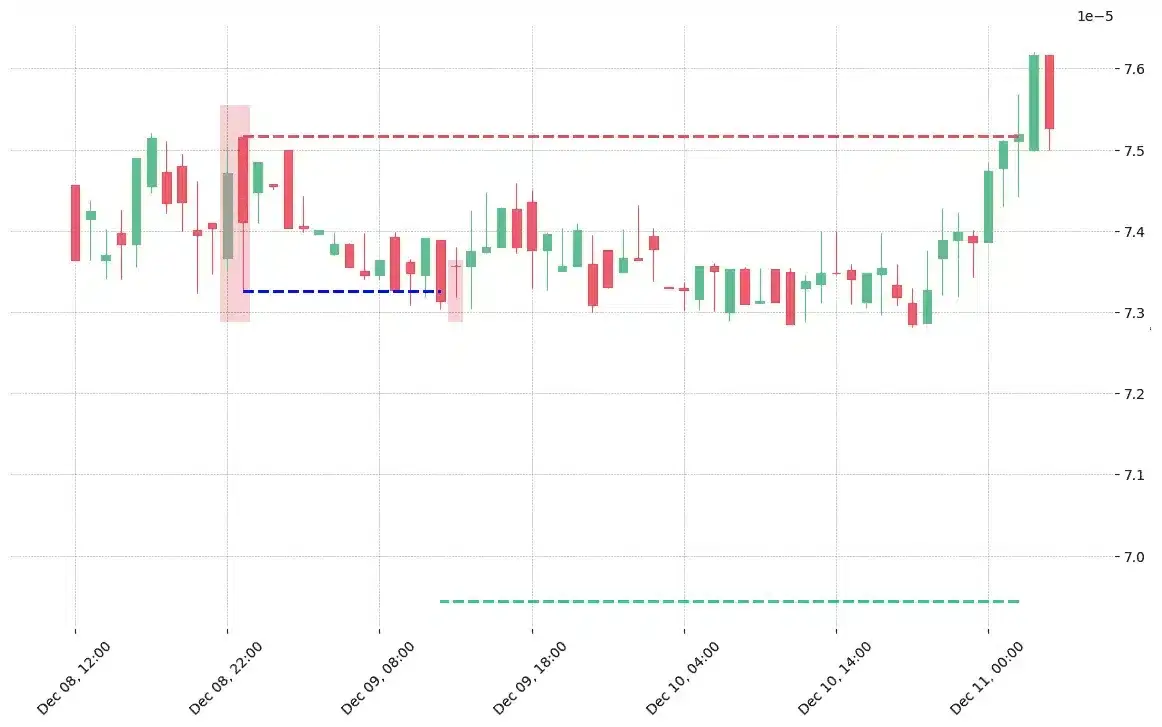
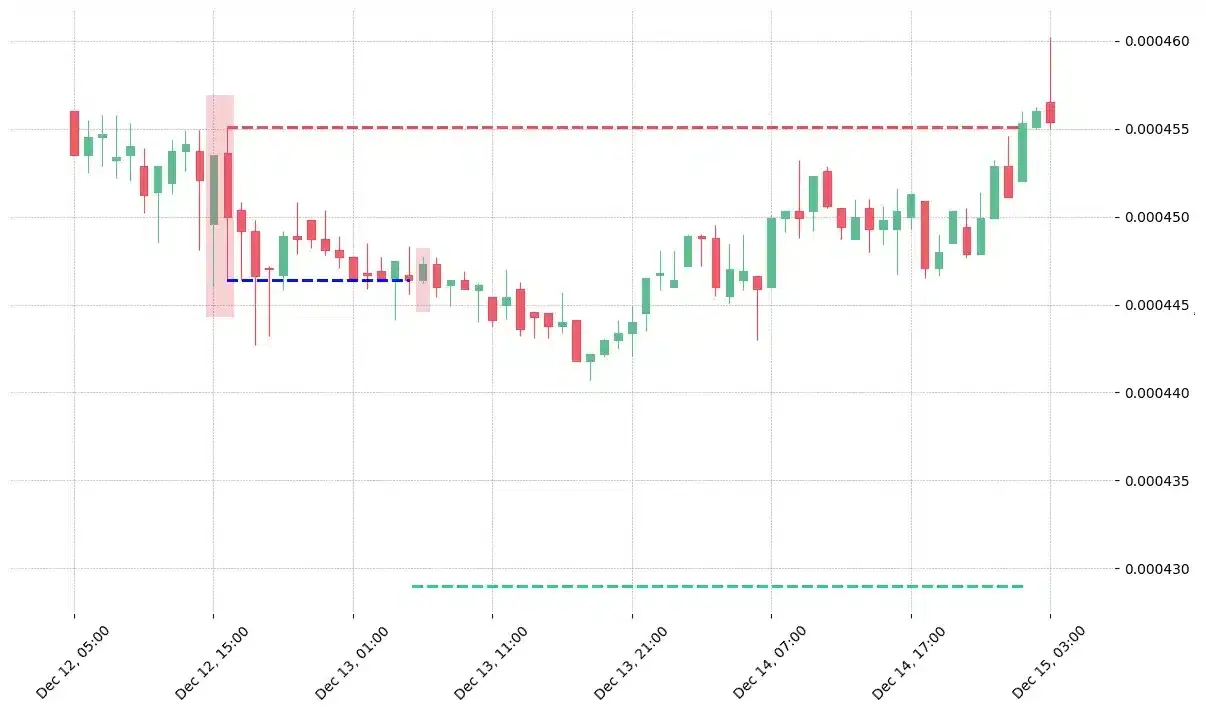
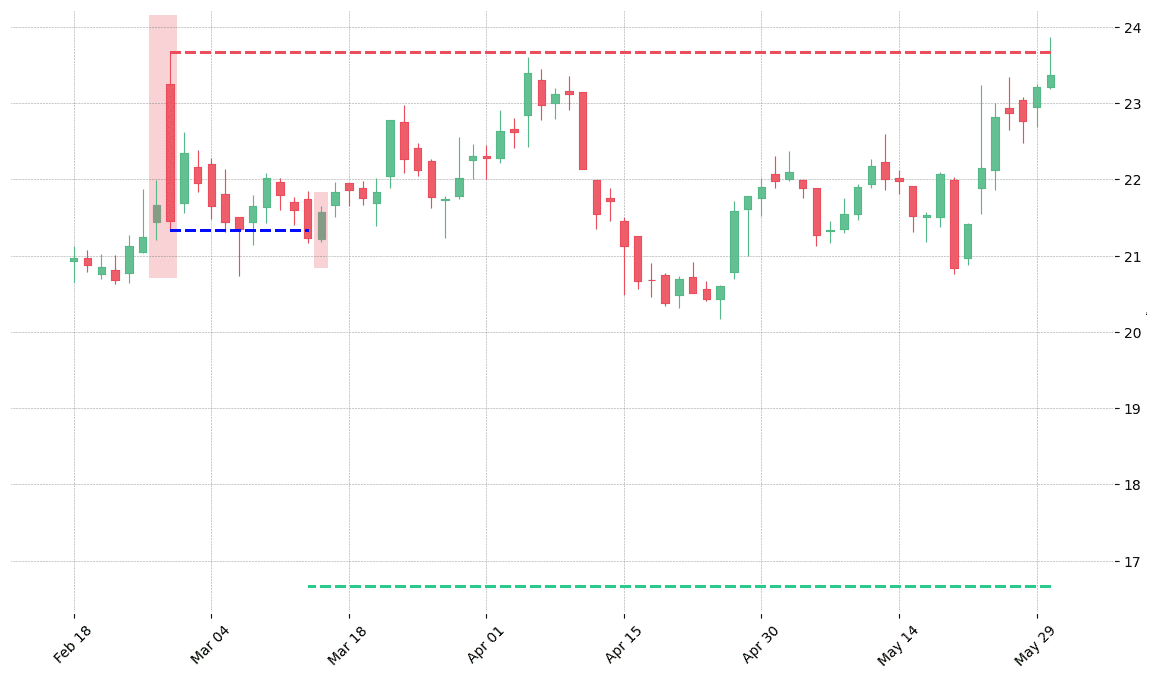
The close of the bearish candle may be used to go out of the long positions. On the other hand, traders may leave the trade the next day if the price continues to go down (confirmation of the pattern). If entering short on the end of the bearish candle, or the next period, place a stop-loss above the high of the bearish candle. There is no profit target for a dark cloud cover candlestick pattern. Traders make use of other methods or patterns for determining when to leave a short trade based on dark cloud cover. They can also choose to aim for a given risk/reward ratio (eg. 2:1).
Traders can make use of this pattern together with other types of technical analysis. For instance, traders might look for a strength index higher than 70. It gives confirmation that the commodity is overbought. A trader may also look for a breakdown from an important level of support after a dark cloud cover pattern as an indication that a downtrend may be on the way.
What does the Dark Cloud Cover pattern tell traders?
The pattern is important because it indicates a shift in momentum, from the upside to the downside. It is created by an up candle followed by a down candle. When the price continues lower on the next candle it is called confirmation.
A lot of traders consider the pattern necessary, only if it appears following an uptrend or a general rise in price. As prices increase, the pattern becomes more beneficial for marking a potential move to the downside. If the price action is choppy the pattern is less important since the price will probably remain choppy after the pattern.
How to trade when you see the Dark Cloud Cover pattern?
It is advisable for traders to trade trending markets that are more traditional like the EUR/USD or GBP/USD, but can also apply the dark cloud cover technical analysis in varying markets.
Consider this scenario:
- You get a gap in price upwards which is a bullish move giving the bulls hope that price will continue up.
- Price slams back down and eats up over 50 percent of the form candlestick which indicates a change in sentiment.
- Some traders that were holding long positions, thinking the gap implies bigger prices, get discouraged when the closing price is less than the previous two opens.
Below is a trading strategy for using a dark cloud cover candlestick pattern:
Entry point
Traders can place a pending order too short below the dark cloud cover or below the low of the first candlestick of the pattern for confirmation.
Stop-loss location
Place stop-loss over the pivot area by making use of “object in motion tend to stay in motion”. This is wise because if this reversal fails, it will fail when price breaks the highs of the pattern. The stop-loss should be just a few locations over the entry candle.
Price targets
There are several ways of taking profits, such as a risk multiple or pattern measures.
The take-profit
This will be a fixed at a ratio of 2:1. Meaning that for each pip risked on the stop-loss, the take profit target should be 2 pips. Therefore, if we are placing 15 pips on the stop-loss then our target take-profit should be 30 pips.
This makes it possible for traders to have a positive risk-reward ratio, which then gives them an edge even if the win rate is over 50 percent. But note that dark cloud cover pattern is very reliable and usually indicates a reversal.
Benefits of Dark Cloud Cover pattern in trading
Most people find this important because it indicates an uptrend reversal to a downtrend. Traders should view the daily charts for this pattern because it is less significant in shorter time frames.
Another reason traders find this beneficial is that the pattern can be found close to the level of resistance. If the volume is high during the candle formation, there are more chances of a reversal to occur.
The dark cloud is effective if used with the appropriate filters. Whether you are a day trader, a swing trader, or a scalper, this pattern works. Apply it with the right risk-reward ratio and you’ll have a trading strategy that offers an edge against the market.
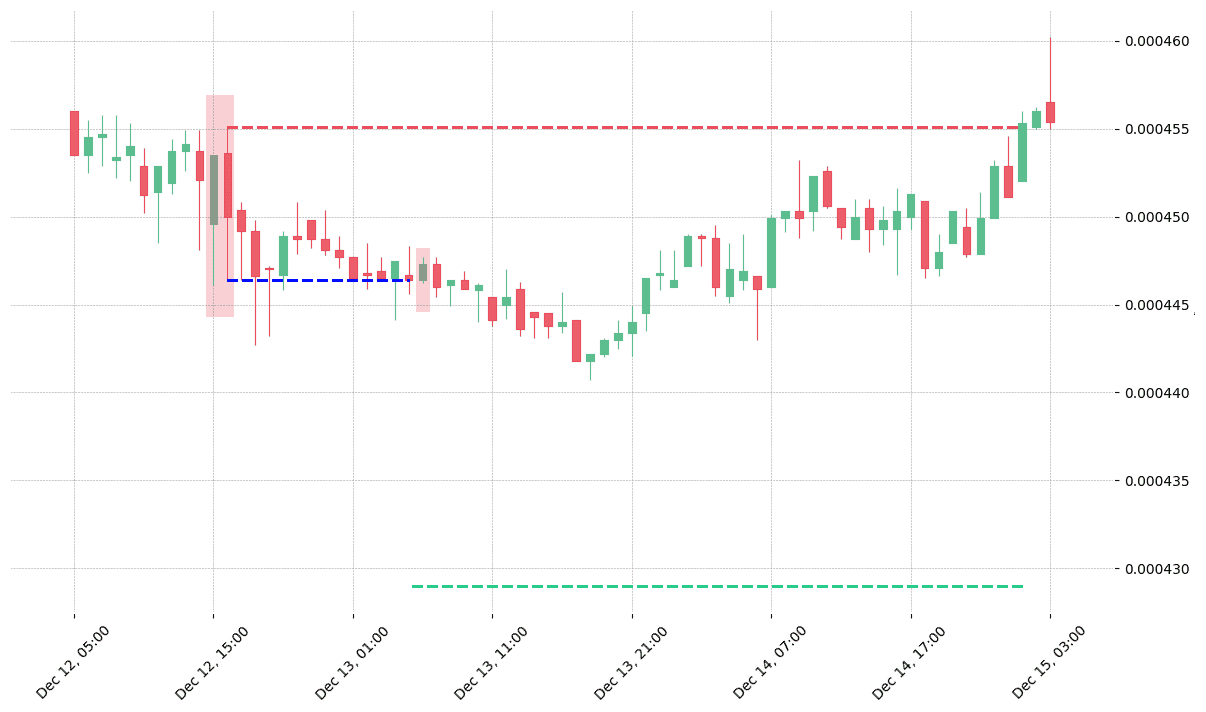
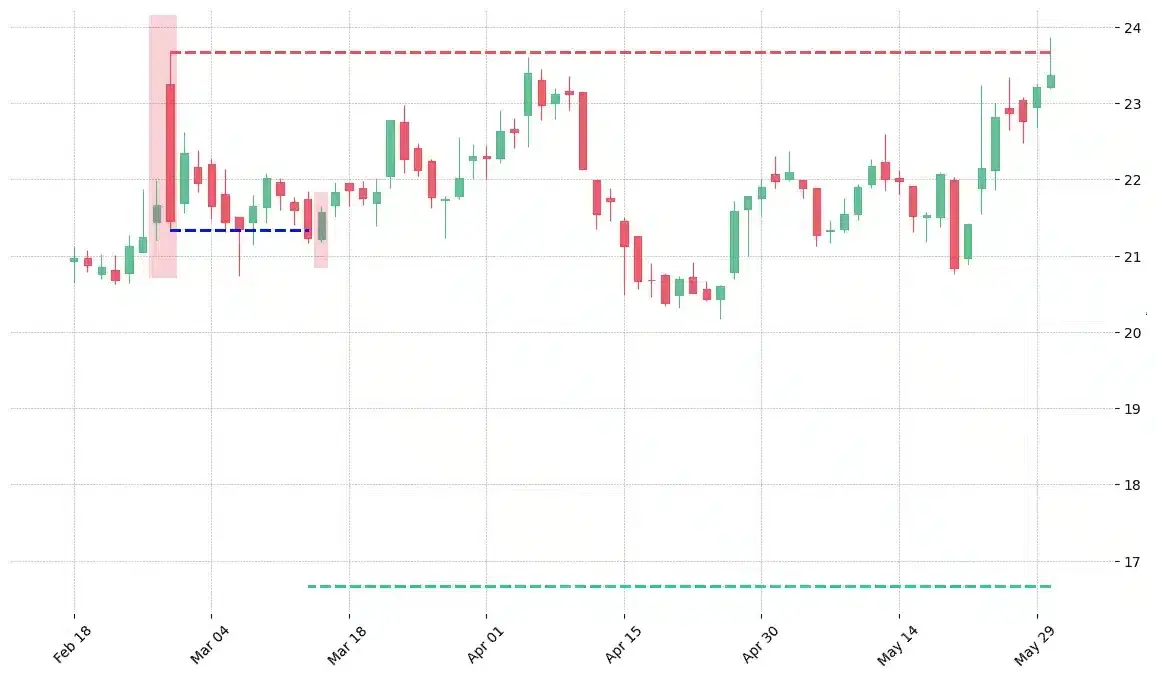
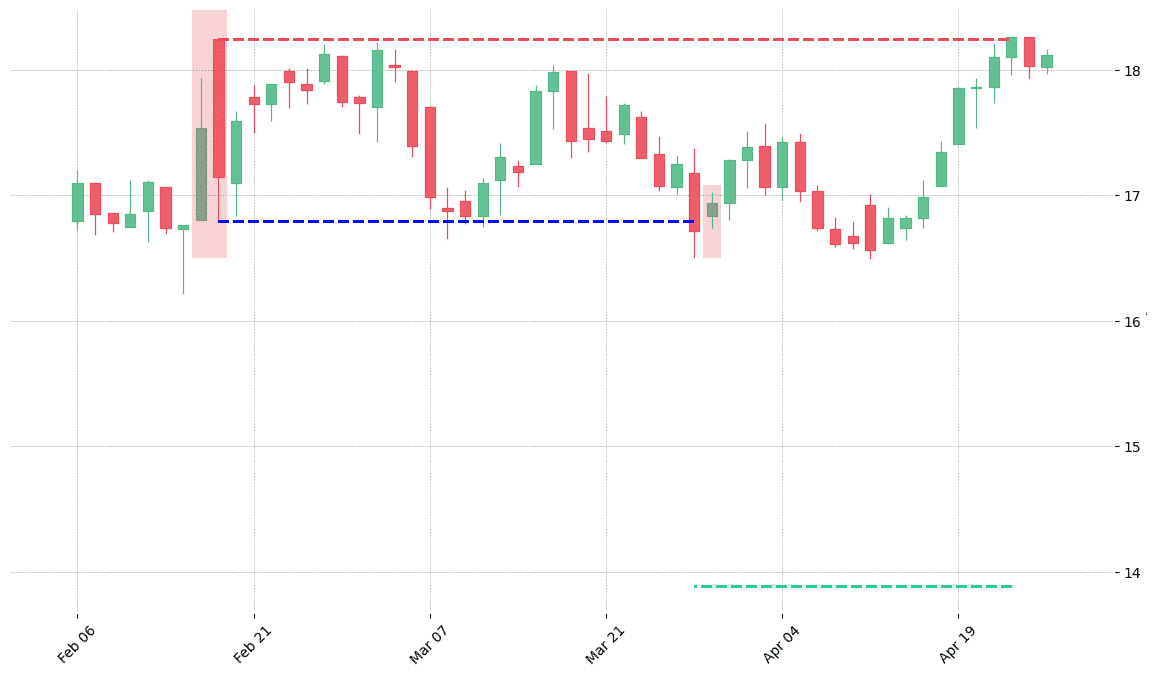
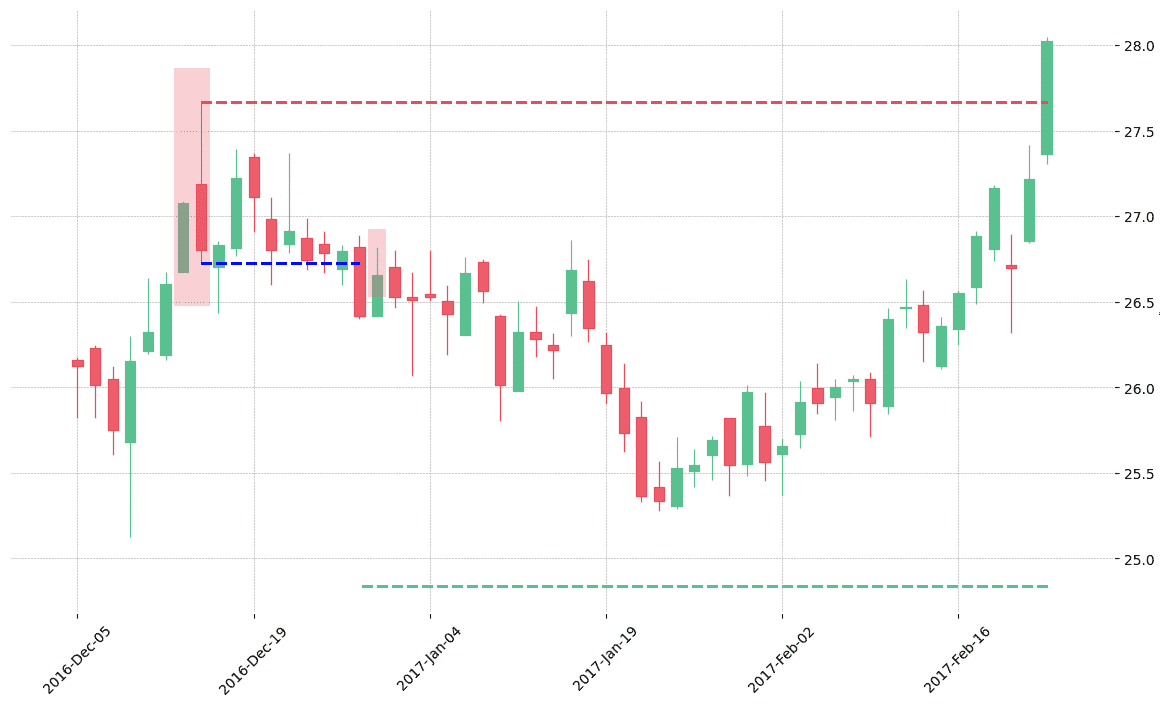
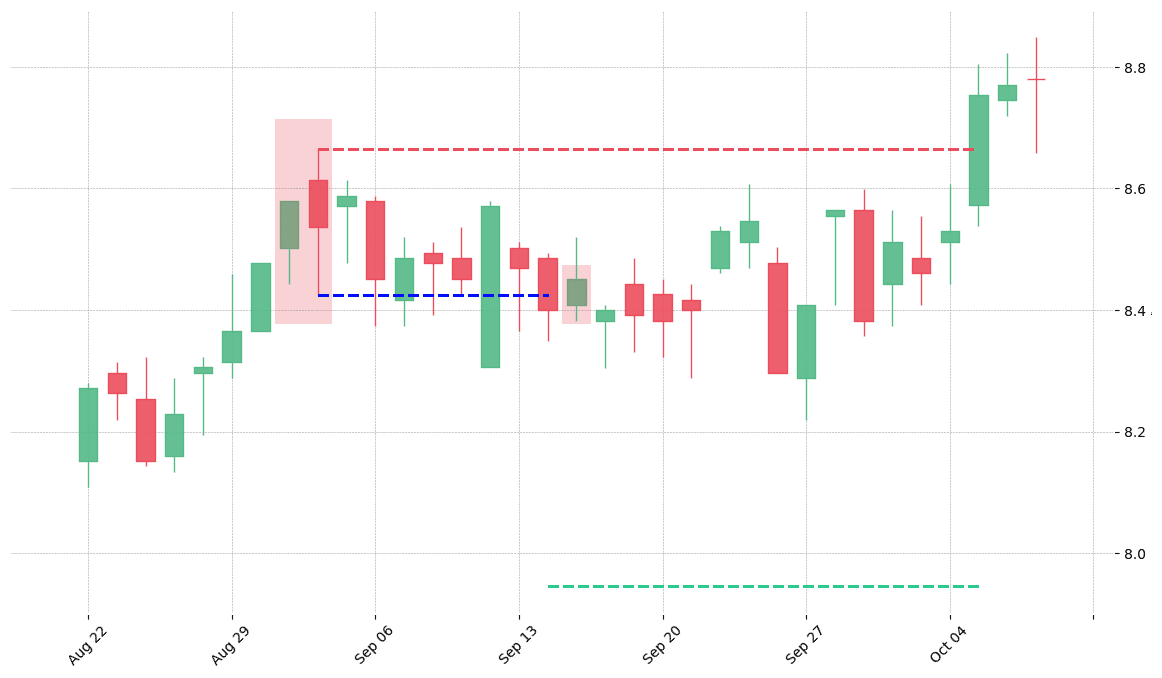
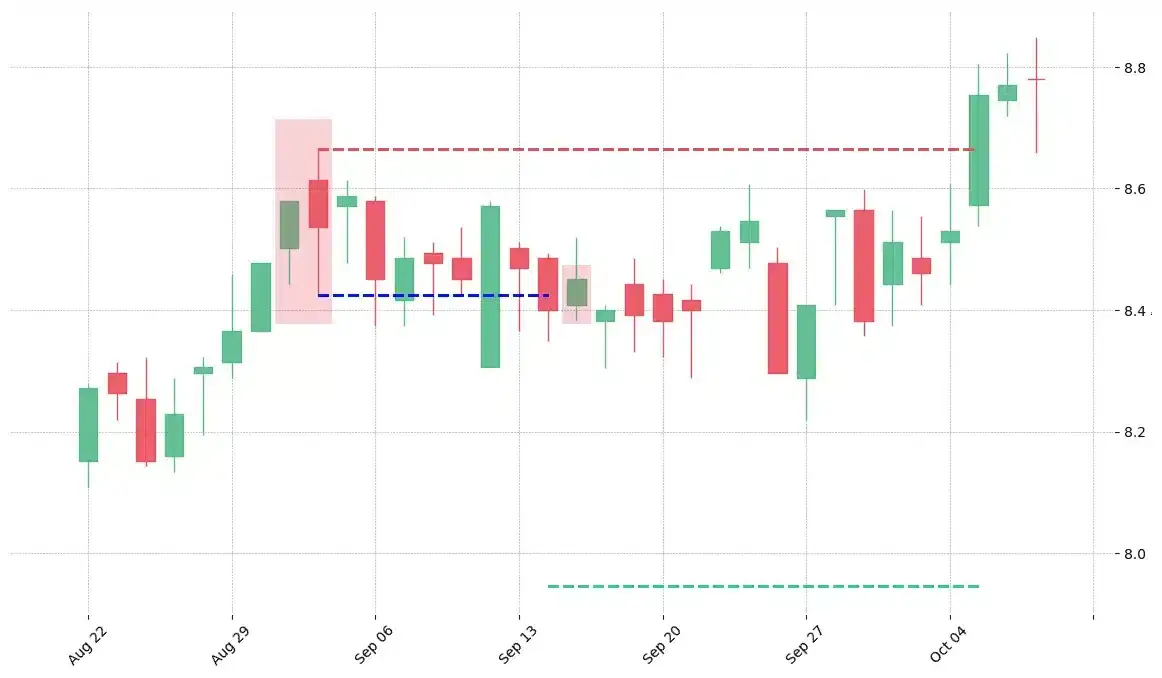
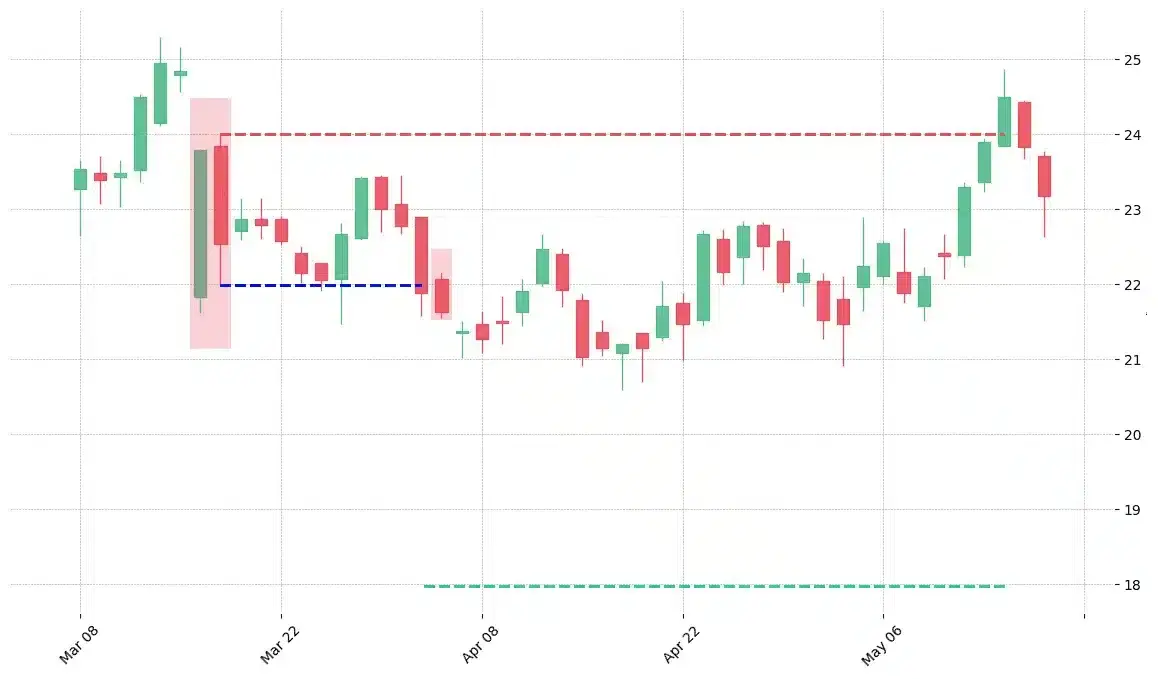
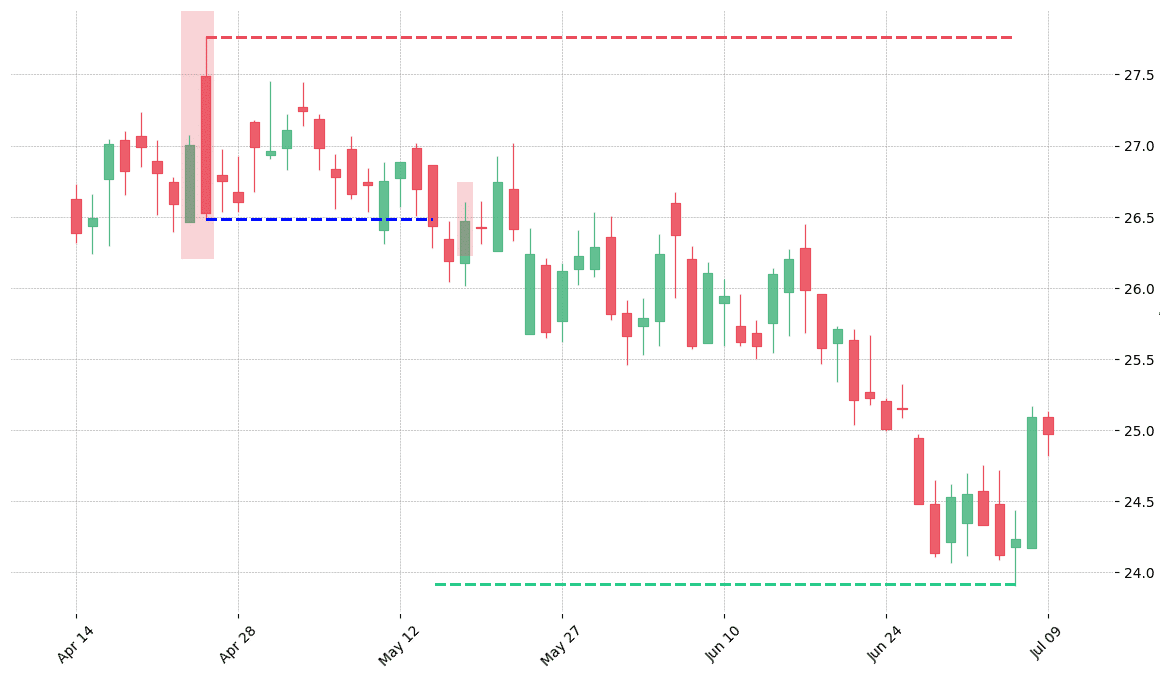
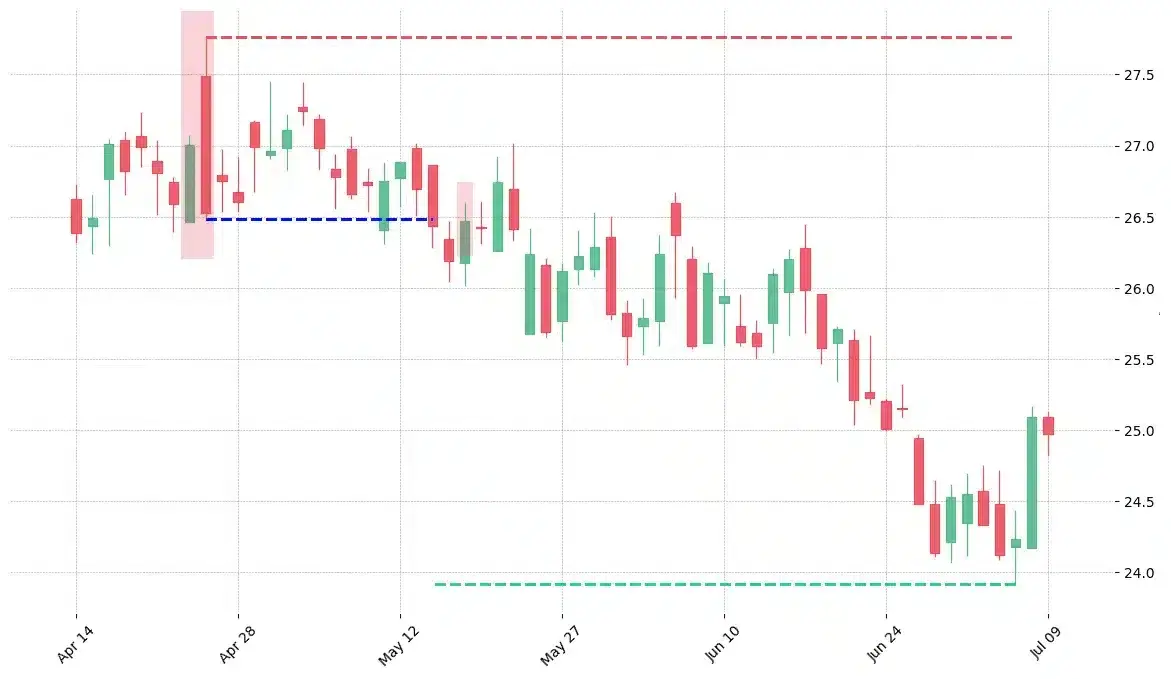
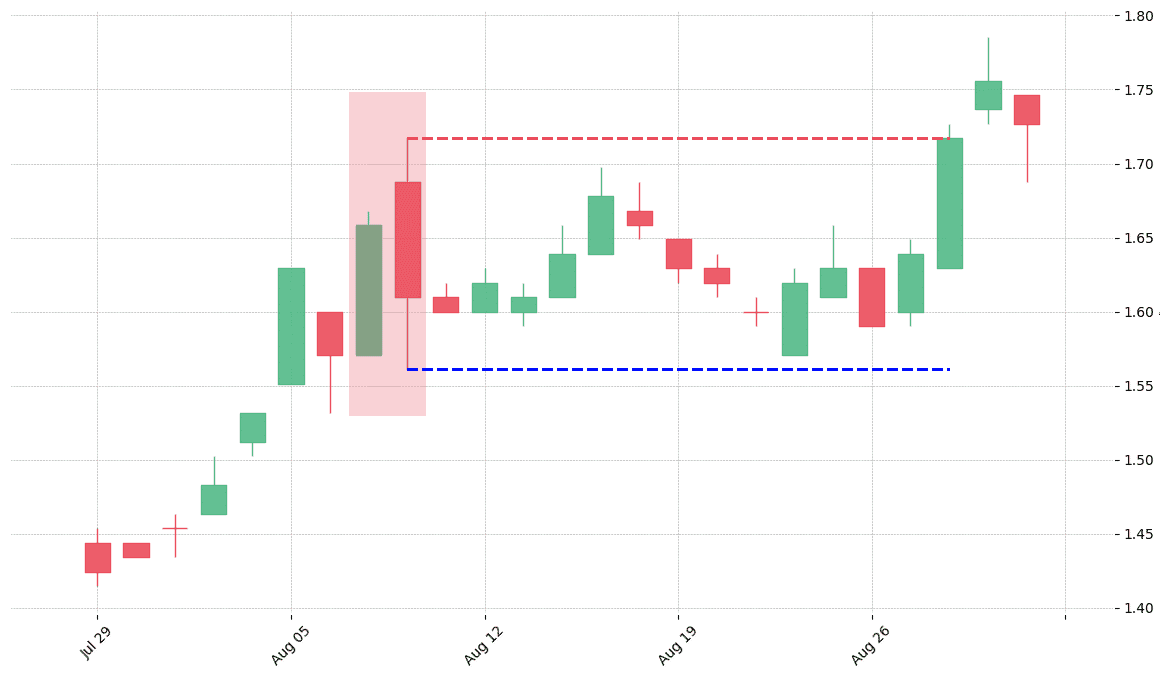
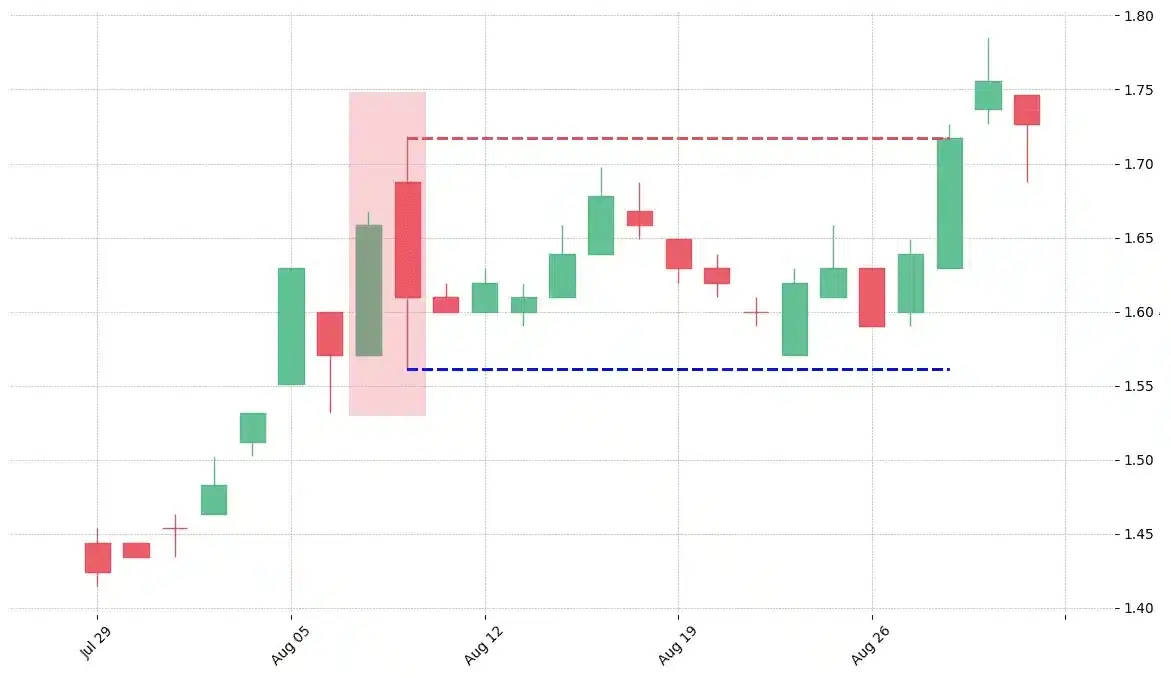
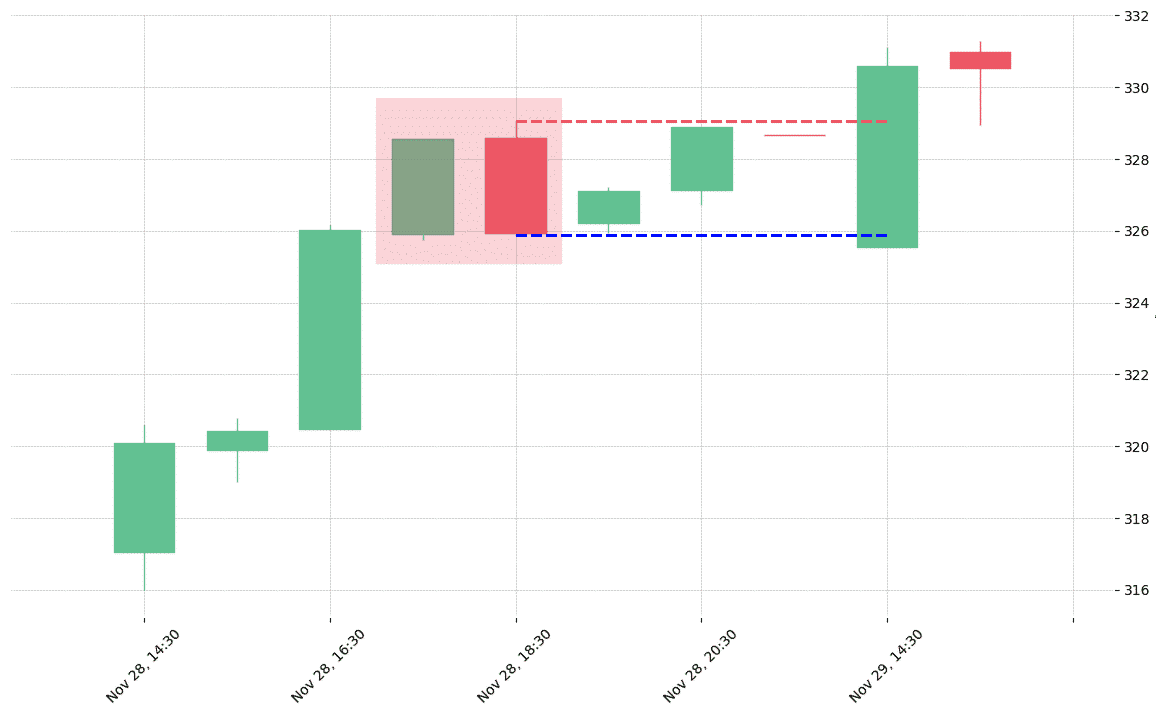
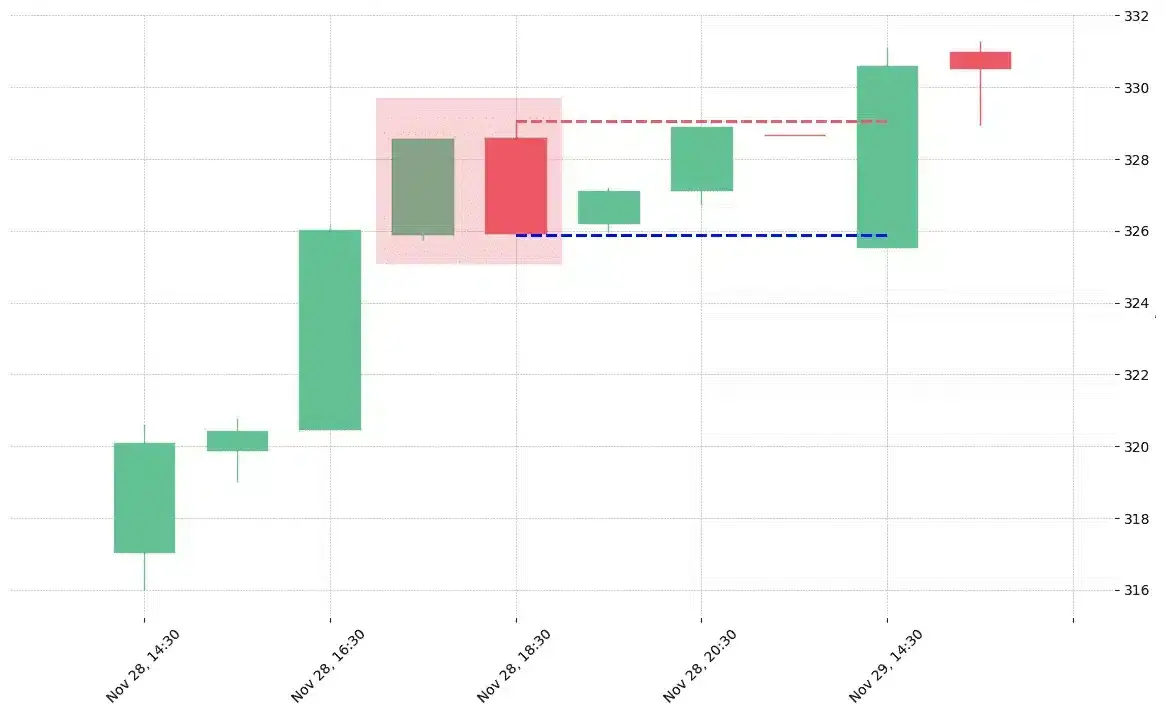
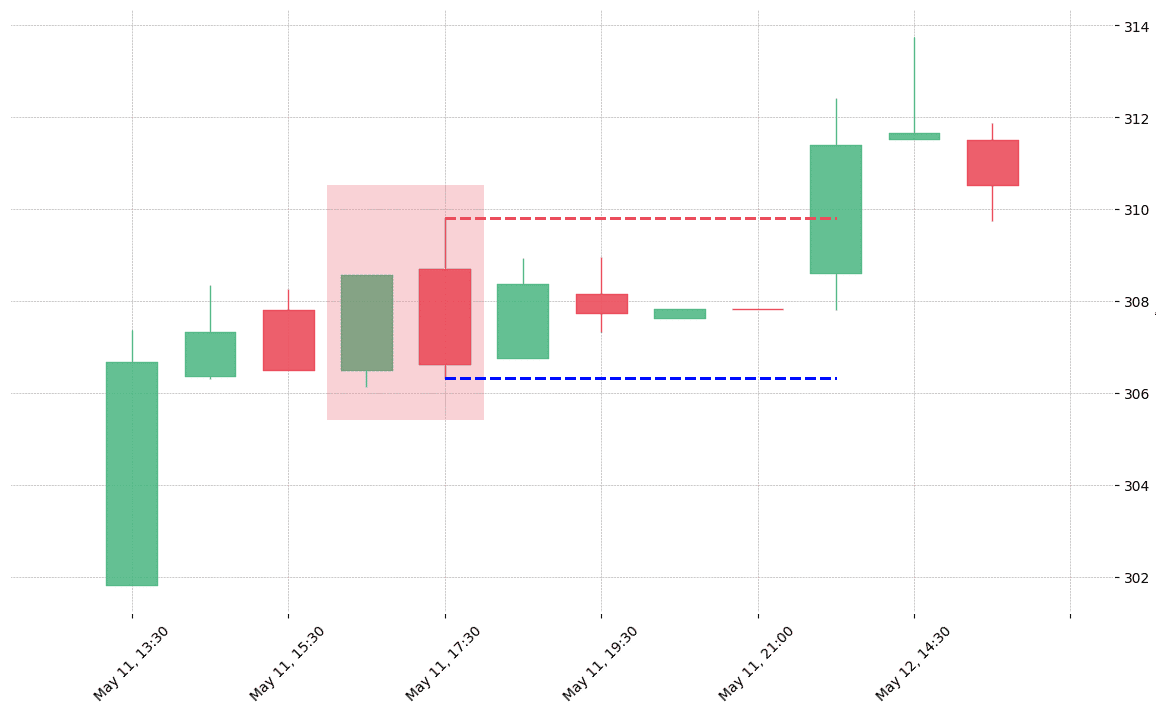
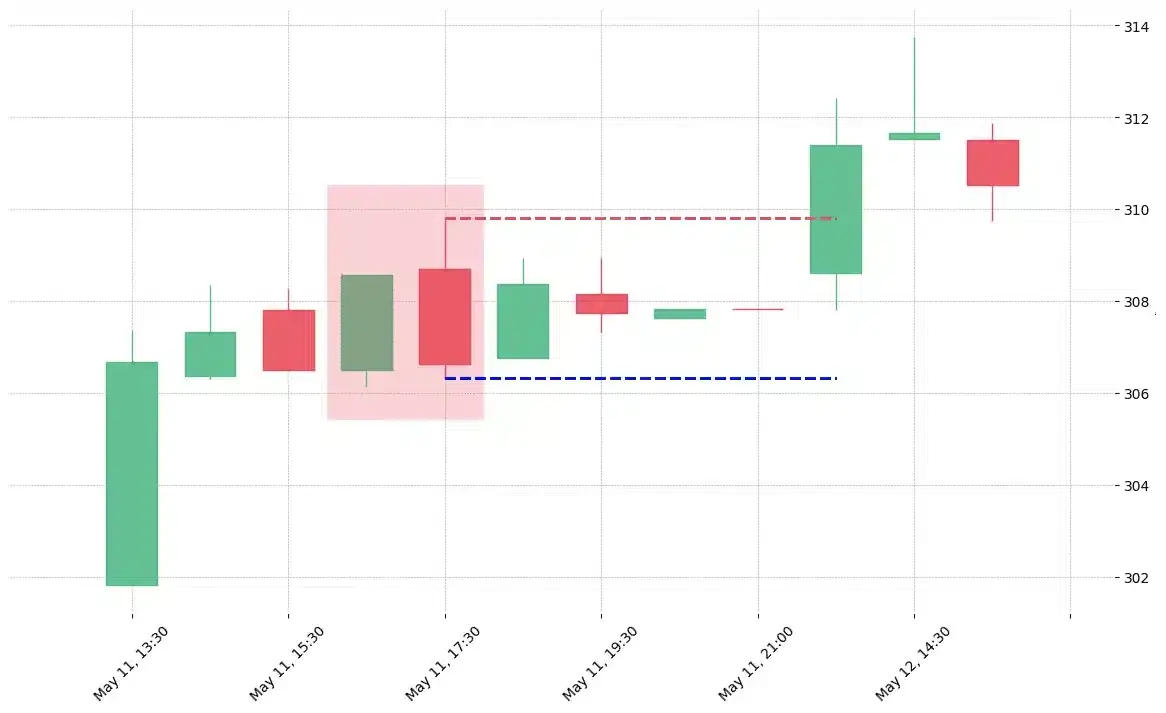
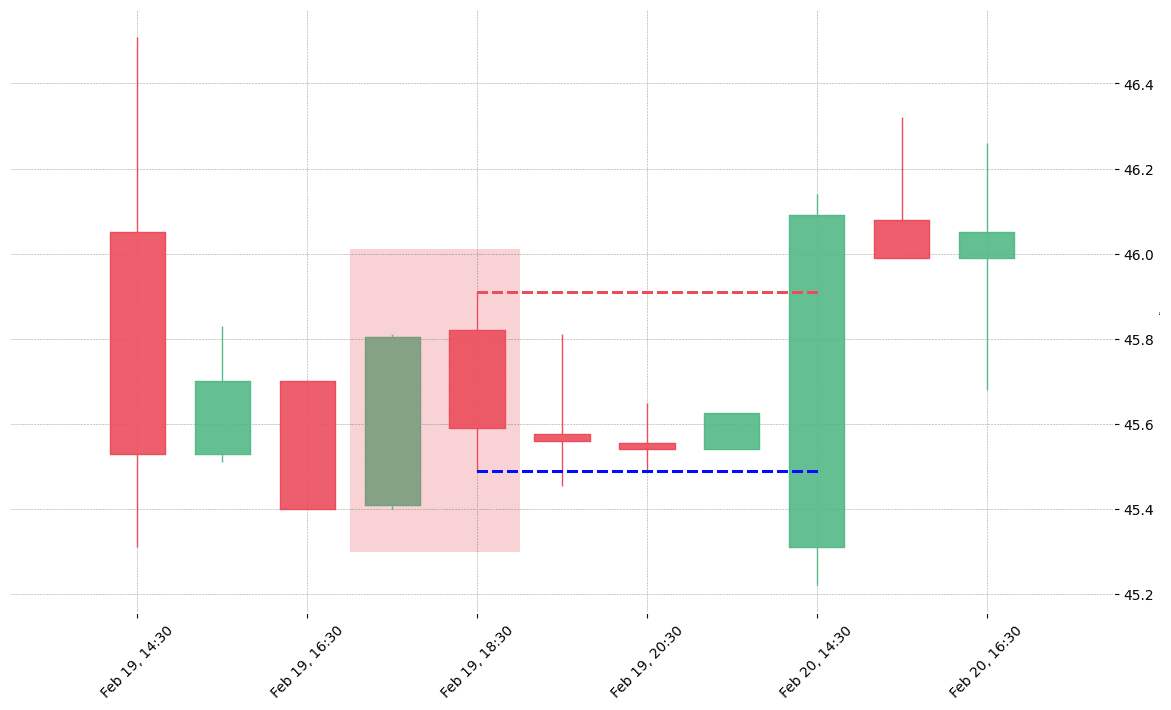
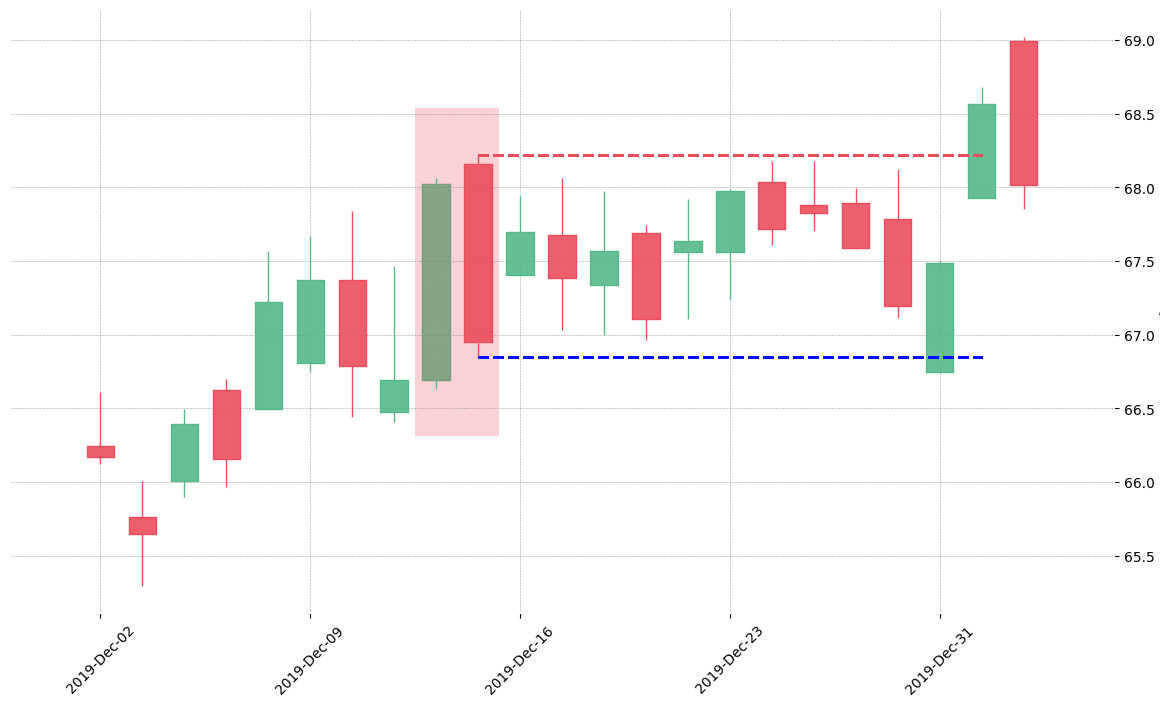
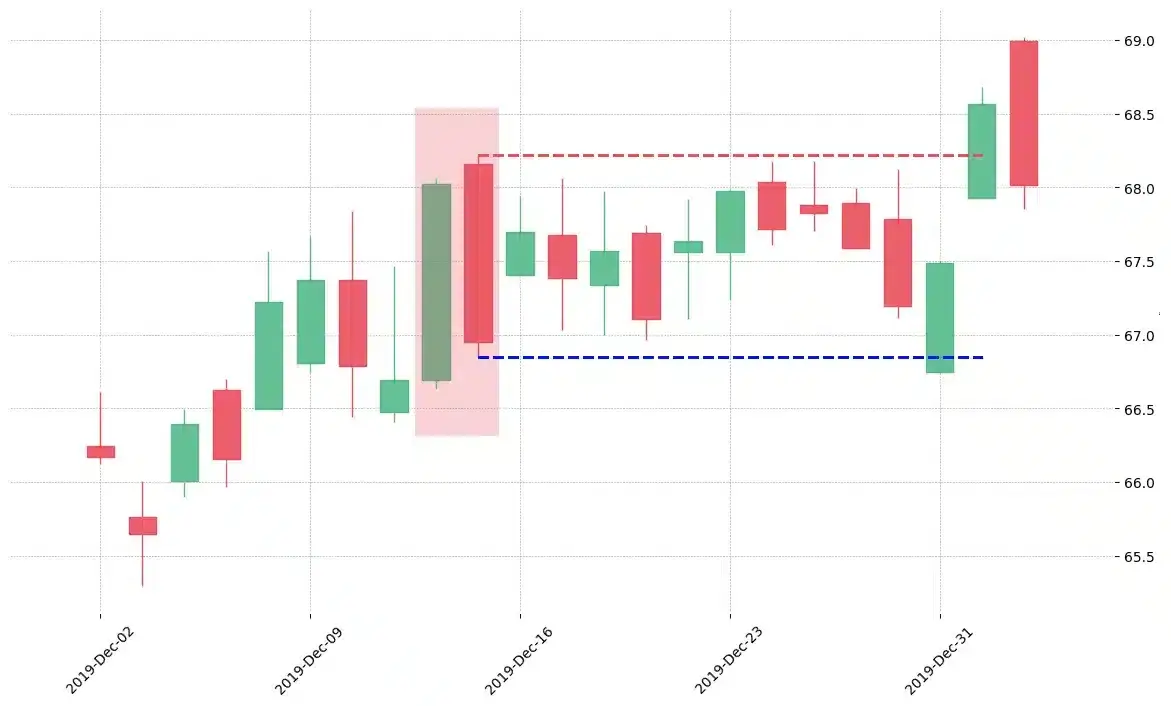
How does the Dark Cloud Cover pattern look in real life?

Looking to learn more about this pattern?
You should take a look at Joe Marwood's online course. In his course, he backtested the 26 main candlestick patterns before to summarize which one is THE best pattern. I really liked his course and you shouldn't miss it!
Click here to signup to his "Candlestick Analysis For Professional Traders" course now!
 Good Trading requires the Best Charting Tool!



 We loved Marwood Research’s course “Candlestick Analysis For Professional Traders“. Do you want to follow a great video course and deep dive into 26 candlestick patterns (and compare their success rates)? Then make sure to check this course!