
 Good Trading requires the Best Charting Tool!
- Both the Bollinger Bands Width and the Bollinger Bands %B are indicators based on the Bollinger Bands.
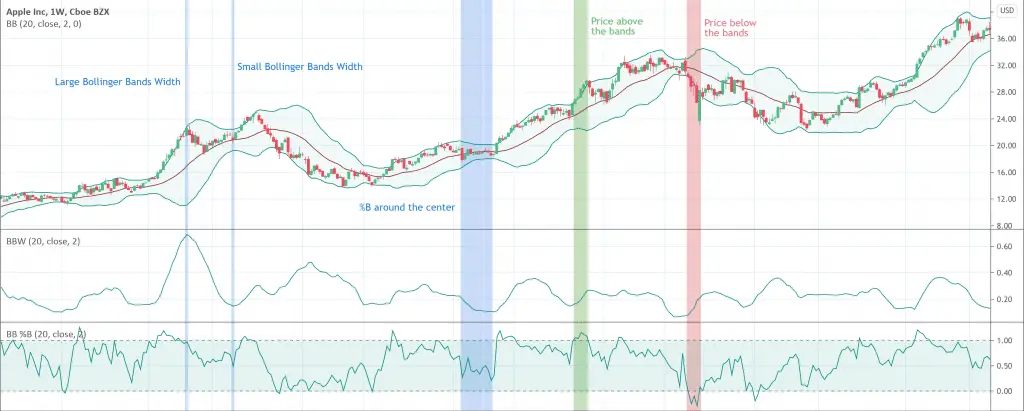
- The Bollinger Bands Width indicator shows the width of the bands (how wide they are at any moment).
- The Bollinger Bands %B indicator shows the relative position of the price within (or outside) the bands.
Bollinger Bands Width (BBW) and Bollinger Bands %B indicators directly relate to Bollinger bands. Before understanding BBW and %B, it is necessary to briefly understand the Bollinger bands.
What is the Bollinger Band?
John Bollinger developed the Bollinger band indicator which is based on the volatility as standard deviation. Bollinger Band calculates deviation as the square root of the variance. Basically, the indicator is stationed around a moving average usually at a 20 day period. The addition of the moving average twice the standard deviation gives the upper Bollinger band. On the other hand, subtraction of the standard deviation twice the moving average gives the lower Bollinger band. Bollinger band indicates lower price volatility when the band is close while it suggests high price volatility when the band is wide. The following are some operational rules of the Bollinger bands.
- The shrinking of the Bollinger bands indicates an upcoming strong explosion of volatility.
- The trend continuation is most likely when the price exceeds a Bollinger band.
- The trend reversal is most likely when the price exceeds a Bollinger band and an inversion figure
Learn more about the Bollinger Bands on our dedicated article : our extensive Bollinger Band article.
What is the Bollinger Band Width indicator?
The Bollinger Band Width (BBW) indicator is a technical analysis tool derived from the Bollinger band. It warns of changes in volatility. BBW is actually the width between the upper and lower Bollinger bands divided by the middle band. Technical analysts can easily employ the Bollinger Band Width indicator to visualize consolidation before price fluctuations or high volatility periods. It depends on the same parameters used by the Bollinger band, however, it combines those separate three lines into one line. In simple words, it calculates the difference between the lower and upper bands.
How does the Bollinger Band Width indicator work?
The BBW indicator works on the following simple rules.
- The distance between the upper and lower band increases during the periods of rising price volatility and hence, the Bollinger Band Width also increases. On the other hand, the distance and the BBW decrease during the period of low volatility. The bands show a tendency of regular contractions and expansions alternatively.
- The wider distance between the bands indicates the upcoming ending of the current trend. Conversely, a relatively narrow distance between the bands suggests that the market may begin a move in either direction.
How to calculate the Bollinger Band Width?
Bollinger BandWidth has the following formula.
BBW = (Upper Bollinger Band – Lower Bollinger Band) / Middle Bollinger Band
How to trade with BBW?
BBW indicator works as an oscillator and depends on the volatility. High market volatility increases the BBW while the flat market decreases the BBW. As we know that volatility is not a trend and by itself, volatility cannot provide trading signals. However, being an important metric, it can provide signals of optimal entry and exit points when it is used in conjunction with trend direction and trading volume.
BBW indicator tells traders that the higher volatility means the higher rewards but at the expense of higher risks. Similarly, lower volatility indicates the lower potential upside and also the lower risk. Traders can easily measure the risk associated with the deal with the help of the BBW indicator. Traders can adjust the risk/reward ratio according to their trading strategy.
Limitations of the Bollinger Band Width indicator
Bollinger Bands Width is also prone to certain limitations as is the case with most of the trading and analysis tools. It has the following limitations.
- BBW helps to measure market volatility but it does not provide an indication about the trend or any other metrics.
- BBW indicator gives BBW as a single line and it is also usually placed in a separate window just below the price chart. Therefore, it is not much use as a dynamic support and resistance level.
- BBW doesn’t provide signals correctly 100% of the time and it gives false signals from time to time.
Bollinger Bands %B indicator
Bollinger Bands %B indicator is derived from the simple Bollinger Band indicator. It indicates volatility in the market with the help of three lines. The lower and upper bands are generally two standard deviations appearing below and above of the middle line ( a 20 days simple moving average). Now, what does the %B indicator do? The %B indicator quantifies or displays the relationship of the price to the bands. %B indicator is extremely helpful in the identification of trends and trading signals. John Bollinger developed %B in 2010, almost thirty years after he introduced Bollinger Bands.
How to calculate the Bollinger Bands %B?
Bollinger Bands %B indicator uses the following formula to calculate %B.
Bollinger Bands %B = {(Current Price – Lower Band) / (Upper Band – Lower Band)} × 100
Basic relationships used in the %B
There are three main factors in the Bollinger Bands %B, price, upper band, and lower band. %B indicator and its calculations are all about the six basic relationships between those three factors.
- %B below 0 = Price is below the lower band
- %B equal to 0 = Price is at the level of the lower band
- If price is below the middle line, %B is below 0.50
- If price is above the middle line, %B is above 0.50
- %B equal to 1 = Price is at the upper band level
- %B above 1 = Price is above the upper band
How the %B indicator works?
The working of the Bollinger Bands %B %B indicator is quite simple. It works on the following simple rules.
- %B will be 100% when the closing price is equal to the upper band.
- %B will be greater than 100% when the closing price is above the upper band.
- When the closing price is equal to the moving average, %B will be 50%.
- %B will be zero when the closing price is equal to the lower band.
- %B will be negative when the closing price is below the lower band.
- When %B reaches oversold levels during uptrends, it indicates potential buying opportunities.
- When %B reaches overbought levels during downtrends, it indicates potential short sale opportunities.
How to trade with the Bollinger Bands %B indicator?
Traders may look for the following trading signals when using the Bollinger Bands %B indicator for trading.
- When a retracement gives a negative number on %B and a second retracement follows but now %B remains positive, traders may go long.
- When a rally gives %B above 100% and a second rally follows but now %B remains below 100%, traders may go short.


 We loved Marwood Research’s course “Candlestick Analysis For Professional Traders“. Do you want to follow a great video course and deep dive into 26 candlestick patterns (and compare their success rates)? Then make sure to check this course!