
 Good Trading requires the Best Charting Tool!
- The advance block candlestick pattern is a 3-bar bearish reversal pattern.
- It has three long green candles with consecutively higher closes than the previous candles.
- Each candle has a shorter body than the previous one.
Statistics to prove if the Advance Block pattern really works
Are the odds of the Advance Block pattern in your favor?
How does the Advance Block behave with a 2:1 target R/R ratio?
From our research the Advance Block pattern confirms 36.7% of the time on average overall all the 4120 markets we analysed. Historically, this patterns confirmed within 4.2 candles or got invalidated within 3.6 candles. If confirmed, it reached the 2:1 R/R target 38.1% of the time and it retested it's entry price level 88.4% of the time.
Not accounting for fees, it has an expected outcome of 0.142 $/$.
It means for every $100 you risk on a trade with the Advance Block pattern you make $14.2 on average.
Want to account for your trading fees? Have the detailled stats for your favorite markets / timeframes? Or get the stats for another R/R than 2:1?
🚀 Join us now and get fine-tuned stats you care about!
How to handle risk with the Advance Block pattern?
We analysed 4120 markets for the last 59 years and we found 42 201 occurrences of the Advance Block pattern.
On average markets printed 1 Advance Block pattern every 370 candles.
For 2:1 R/R trades, the longest winning streak observed was 9 and the longest losing streak was 19. A trading strategy relying solely on this pattern is not advised. Anyway, make sure to use proper risk management.
Keep in mind all these informations are for educational purposes only and are NOT financial advice.
If you want to learn more and deep dive into candlestick patterns performance statistics, I strongly recommend you follow the best available course about it. Joe Marwood (who's a famous trader with more than 45 000 Twitter followers) created an online course called "Candlestick Analysis For Professional Traders" in his Marwood Research University. There he will take you through the extensive backtesting of the 26 main candlestick patterns. He then summarizes which one is THE best pattern. Do you know which one it is?
Remember, don't trade if you don't know your stats. Click here to signup to the course now!
What is the Advance Block candlestick pattern?
The advance block candlestick pattern is a bearish reversal pattern that appears during an uptrend. It is very much similar to a bullish three white soldiers candlestick pattern because it also has three long candles with consecutively higher closes than the previous candles. It illustrates how the bears gradually take control of the market to initiate new falls. The advance block pattern only warns about a slowing uptrend but does not necessarily predict a reversal in trend.
The pattern has three candlesticks with shorter bodies and long upper shadows that signals a significant rise in the supply that stops and pushes down the price. The advance block pattern appears during an uptrend and signals a trend reversal to a new downtrend, therefore, it is one of the most reliable bearish patterns that generate many sell signals.
How to identify the advance block candlestick pattern?
The advance block candlestick pattern is a bearish reversal pattern with three candlesticks. It is not difficult to identify it but surely, it is a bit tricky. The chart pattern must display the following characteristics to be an advanced block candlestick pattern.
- An advance block occurs after a significant increase in prices indicated by several green candlesticks appearing on the chart pattern.
- All three candles must have a shorter body than the previous candle.
- The first candle must be a long bullish candlestick.
- The second candle must have an opening within the real body of the first candle and closing above the close and high of the first day’s candlestick.
- The third candle must also open within the real body of the second day’s candle and must close above the close of the second day.
- The opening of the second and third candles must be within the previous candle’s real body.
- The close of the candles must be far away from their respective highs.
- The wicks of the candles must gradually increase in size.
What does the pattern tell traders?
The advance block candlestick pattern is a bearish reversal pattern that indicates the transition from bullish enthusiasm to a bearish warning. However, the formation of the advance block pattern does not immediately signal a trend reversal, rather it reflects the weakening of the bullish trend. The wicks on the second and third candles help to identify it. Moreover, the advance block pattern is best at forecasting a reversal pattern during upward moves that are of temporary nature and pullbacks during larger-scale downward trends.
The advance block pattern illustrates that the bullish candlesticks are getting shorter even though the market is making new highs. The upper wicks also indicate that the bulls are trying to push the prices high but during the trading session, bears eventually get success to decrease prices down off the highs. All this tussle between the bears and bulls make bulls to settle on the lower gains.
It also opens the door for selling long positions but short positions are not yet traded. However, the trading strategies are only successful after the confirmation. The confirmation is provided by the candle of the fourth day. If the fourth day’s candle is a black candle with a downtrend gap or a lower closing prices.
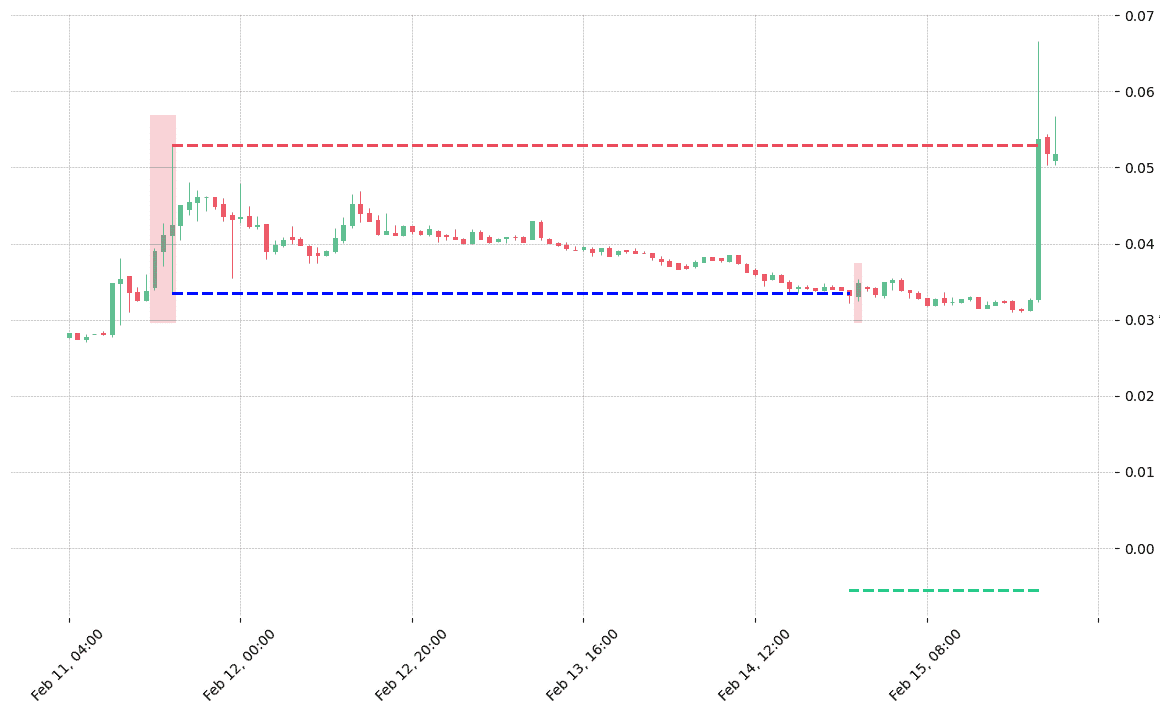
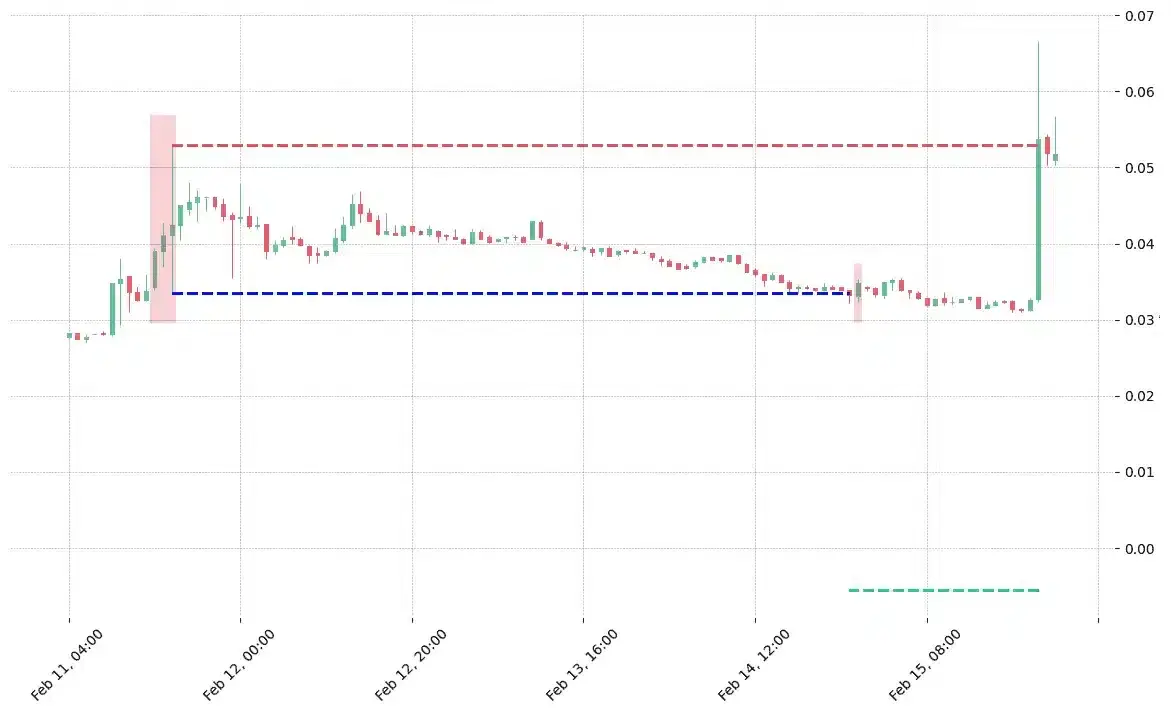
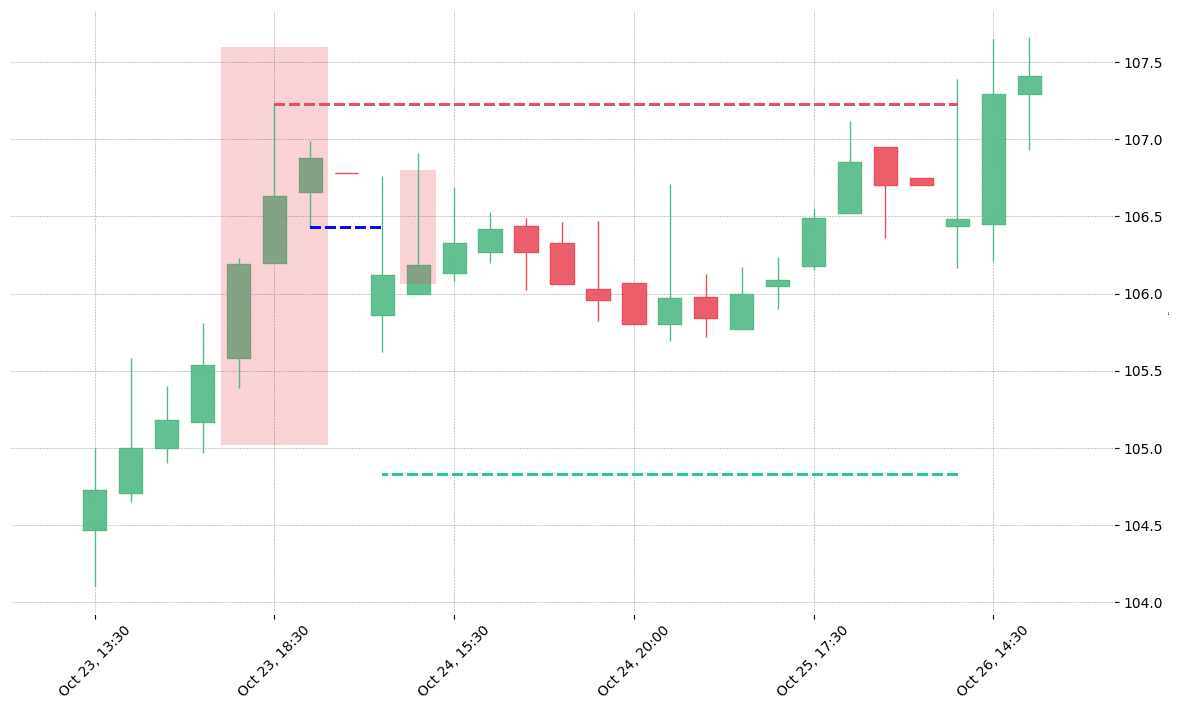
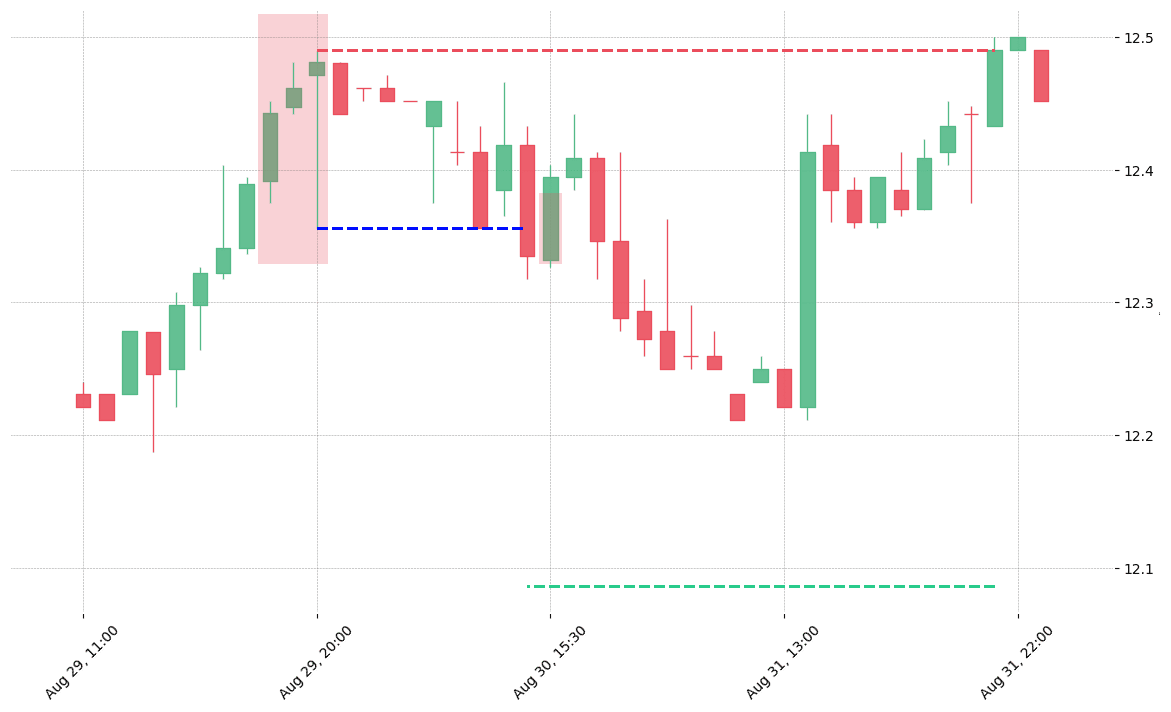
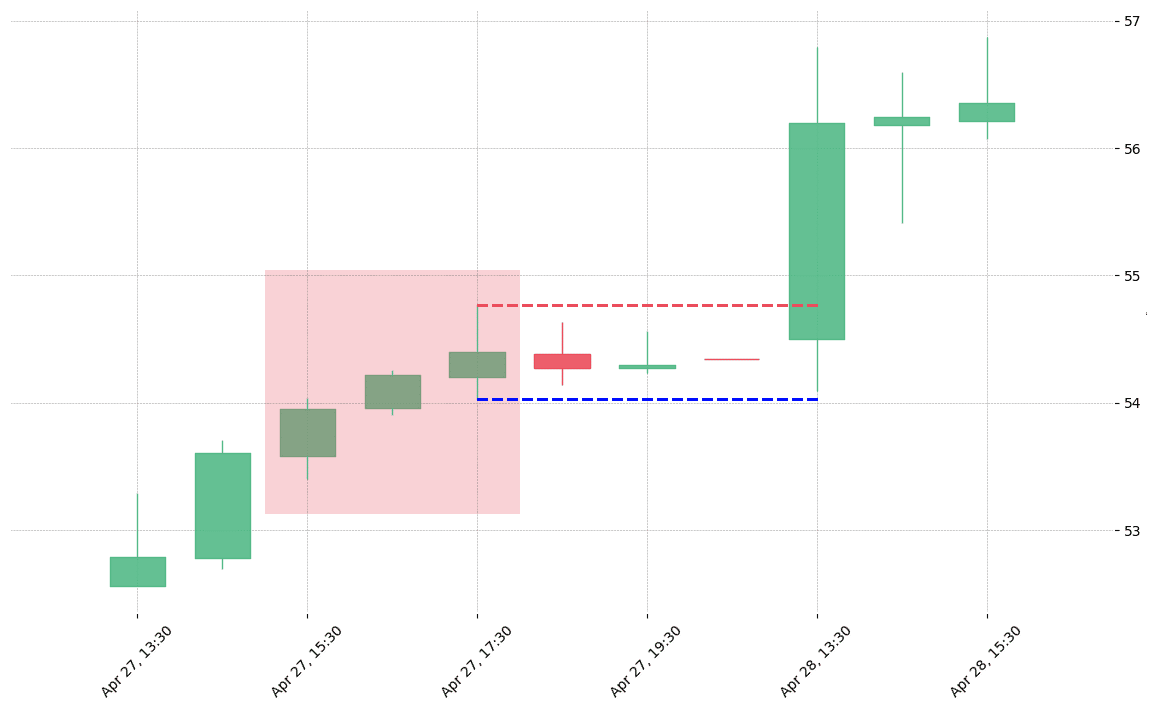
How does the Advance Block pattern look in real life?


Looking to learn more about this pattern?
You should take a look at Joe Marwood's online course. In his course, he backtested the 26 main candlestick patterns before to summarize which one is THE best pattern. I really liked his course and you shouldn't miss it!
Click here to signup to his "Candlestick Analysis For Professional Traders" course now!


 We loved Marwood Research’s course “Candlestick Analysis For Professional Traders“. Do you want to follow a great video course and deep dive into 26 candlestick patterns (and compare their success rates)? Then make sure to check this course!