
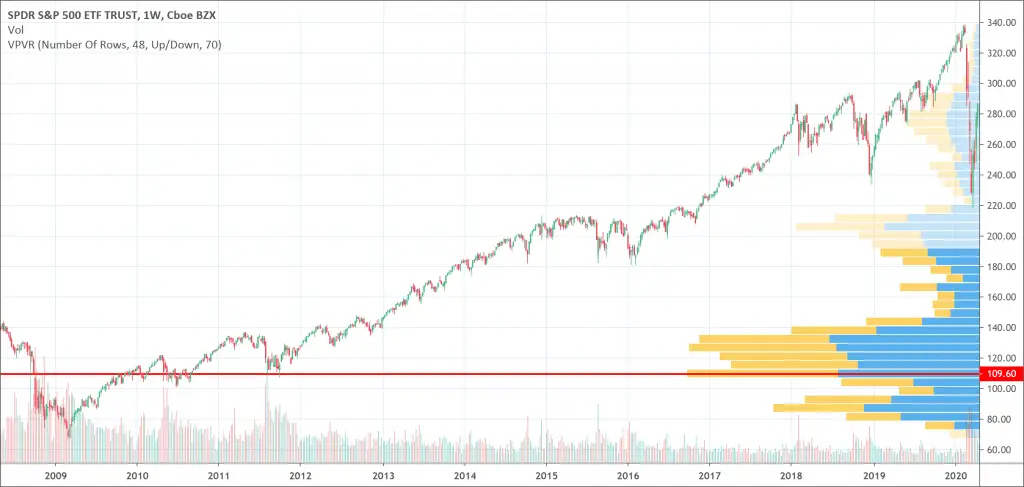
- Volume Profile shows the price where the security was most traded.
- It takes a given range for computation (either visible or fixed).
- The more volume traded at a given price, the bigger the Volume Profile bar will be.
What is the Volume Profile indicator?
Volume Profile is an advanced charting study and indicator. It shows the traded volume amount of an asset over a specified period, at certain price levels. Volume Profile makes use of previous traded volume and all the strategies and plans are brought from historical data.
Traders focus on the regions where a reversal could occur with volume profile. Some people believe that volume profile analysis provides traders with an “unfair” advantage as a result of market context and that institutions and banks use such strategies.
What is Volume?
Volume, also referred to as volume of trade, gives the total number of shares or stocks traded for a specific security. Volume indicates the amount of transactions that carried out. As a result, it can also measure the liquidity of security. A security is active or liquid when volumes are high.
How does indicator work?
The volume profile can come in any shape depending on the distribution of volumes. It draws by using horizontal lines to form a histogram. The more the volume trades at a given level, the bigger the profile becomes.
The volume profile is usually located at the right side of the chart beside the price levels. Bars represent it. The volume profile bars are created by getting total volume traded at a price, in a given time. The total buy is then divided, and volumes sold representing it on a histogram chart. Traders can understand and use the volume profile indicator as one of the important tools among all their technical analysis tools.
Types of Volume Profile
There are three different kinds of volume profile used in trading. There is not so much difference in the way they all operate. The differences that exist amongst them are the way they appear on the chart and the ease of access to volume profile on the precise time period you want to view.
- Volume Profile Visible Range (VPVR): Volume Profile Visible Range (VPVR) is the basic volume profile tool most trader use. It appears next to price levels on histogram. It displays the volume traded in the price level automatically from the candles displayed on the screen. When one go back and forth in the price action’s time period, the volume profile visible range will change.
- Volume Profile Fixed Rage (VPFR): This is almost the same volume profile with the VPVR, only with a little difference. When one wants to view the traded volume in a period of price action, like the uptrend or downtrend, you can determine the initial and final point and view the volume profile only for that time period.
- Volume Profile Session Volume (VPSV): This displays all the volume profile of the session that is appearing on the chart. Each session presenting on the chart has a volume profile grouped with it. Each session is considered daily and that goes for the change of time period of the chart.

TradingView is by far the best charting solution to try and use Volume Profile. The chart below comes from TradingView. It is very user friendly and I use it all the time. You can look here at the dedicated page for their Volume Profile indicator. The only bad part is this feature is only available for paid plans but it’s already available with their cheapest plan (the Pro plan). On the other hand, seeing exactly where big traders were interested to buy and sell is so valuable that is a no brainer.
Click here to get started with your 100% free 30-days trial !
The various shapes of Volume Profile
There are various shapes volume profile histogram can print out. Traders can extract many details and information from them.
- D – Shaped Profile: This corresponds with alphabet “D” and it is the most common shape. It informs us that there is a temporal balance in the market.
- P – Shaped Profile: This corresponds with alphabet “P” and it is an indication of uptrend.
- b – Shaped Profile: This corresponds with alphabet “b” and it is the inverse of P-shaped profile. B-shaped profile mostly appears in a downtrend or at the rear of an uptrend.
- Thin Profile: This corresponds with the alphabet “I”. Thin profile indicates a strong trend. There is little to no time for building-up trading positions in a fierce price movement. Just minute volume clusters are made in this type of profile.
Terminologies associated with Volume Profile
It is very important that one understands has some basic knowledge about the concepts related to volume profile.
- High Volume Node (HVN): This is a point in volume profile where is a really higher volume than average. The most crucial component of the volume profile is to be able to display the most traded prices for a particular time period.
- Low Volume Node (LVN): This is a point in volume profile where there is a really lower volume than average. LVN and HVN are inversely proportional to each other.
- Value Area (VA): 70% of the volume locates here. The volume profile gets a bit complex in this area. This means that 70% of total volume used on the chart had occurred cumulatively at these price levels, hence, called Value Area.
- Point of Control (POC): This is the highest volume node that exists on the volume profile. Lots of transacted volume is at the price level. Traders make use of POC for as a vital retest point and for support.
- Clearance: This is an area in the volume profile that constitute of only LVNs, as there are no HVNs in this region.
- Developing Point of Control (Developing POC): This is a change in POC over time. As POC changes over time, you can notice the change by observing the Developing POC line to what it was in time past.
- Value Area High (VAH): This is the highest point in the value region section
- Value Area Low (VAL): This is the lowest point in the value region section
Volume Profile rules
Traders can identify the state at which the market is by using the volume profile. When you have been able to determine the state at which a market is, then these rules tells us what to search for in volume profile in those different market conditions.
- If the price is consolidating (ranging price): Here, the price would be jumping between HVNs and LVNs. Value area will be situated at the center of the volume profile.
- If the price is trending upward (uptrend): Price here will likely retrace to the value area high. Value area would be situated on beneath the volume profile.
- If the price is trending downward (downtrend): Price would most probably retrace to the value area low. Value area would exist above the volume profile.
If you want to go deeper into price action and volume profile, you should check the course Trading with Price Action and Volume Profile on Udemy.
It’ll help you build a solid daytrading/swing trading strategy around Price Action and Volume Profile. In addition, it’s a 13 hours video course and goes into advanced price action trading, volume profile. It also tackles risk management, psychology and finally helps you build your strategy.
Click here to signup to the volume profile course now!
Conclusion
Volume profile is a very valuable analysis tool. Lots of traders use it everywhere they can. Volume profile has been continually relevant as a result of its versatility. It is a charting tool that has a wide usage capability.
The volume Profile provides trader with accurate data. It is more of a reactive tool for discovering traditional and resistance areas and so traders are still developing indicators which would be more proactive and predictive in nature.
With every other indicator, only two variable let traders do the calculations. They are: Price and Time but with volume profile indicator, there are three variables available. These variables are: Price, Time, and Volume.
Most standard trading indicators only show how the price is moving in the past. The main notable difference between those numerous indicators is how they visualize it. That made them less efficient and makes traders to keeping moving from one indicator to the other.
But with volume profile, it directs you to regions which where and will be crucial for large trading institutions. To put it mildly, volume profile is capable of predicting what will happen in the future.


 We loved Marwood Research’s course “Candlestick Analysis For Professional Traders“. Do you want to follow a great video course and deep dive into 26 candlestick patterns (and compare their success rates)? Then make sure to check this course!