On-neck candlestick pattern: What is it?

Candlestick patterns

On Neck candlestick pattern
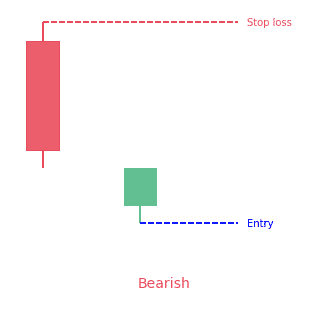
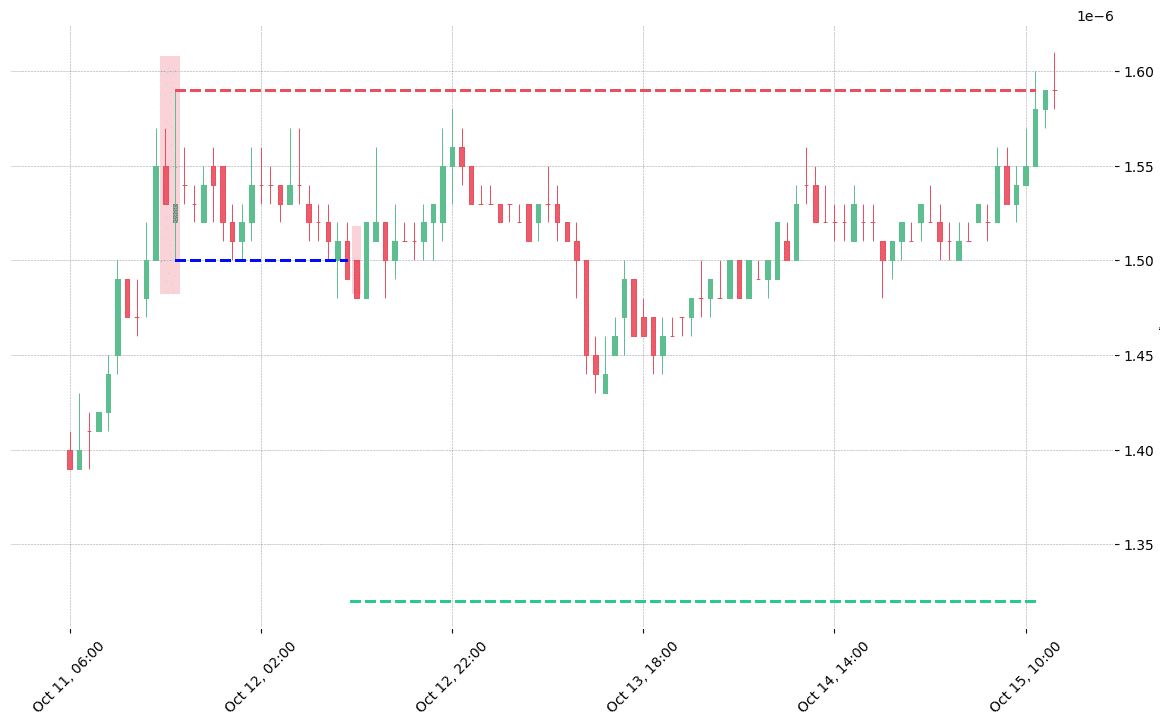
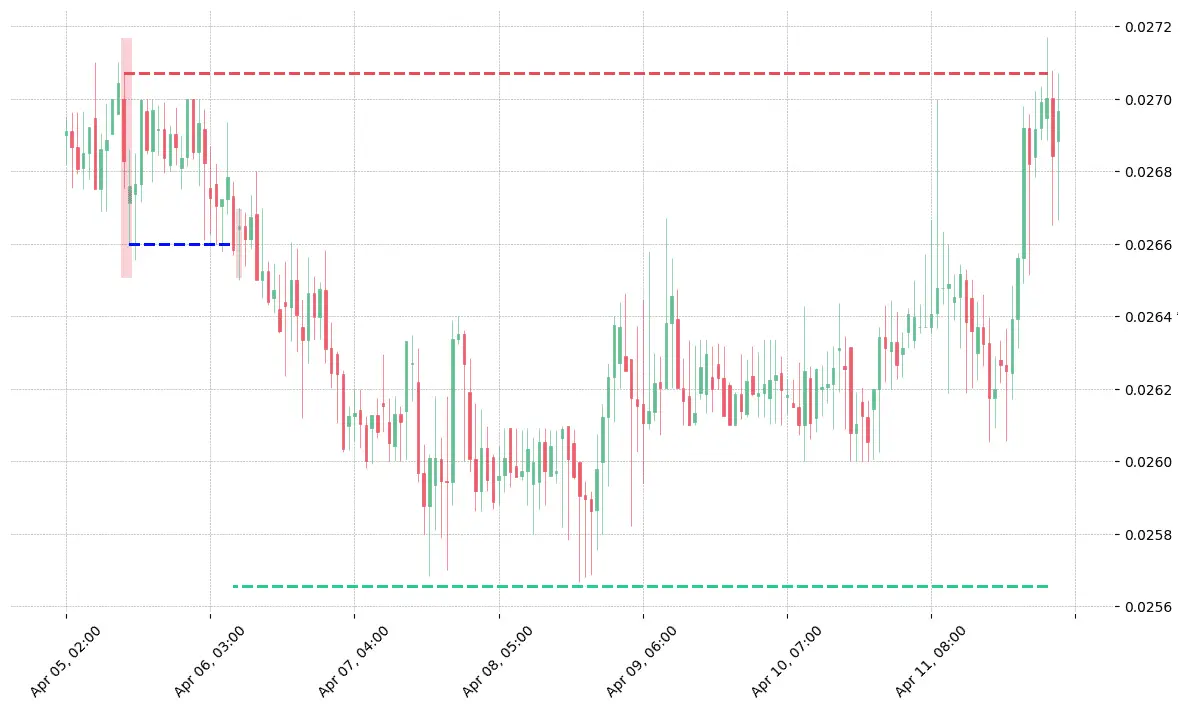
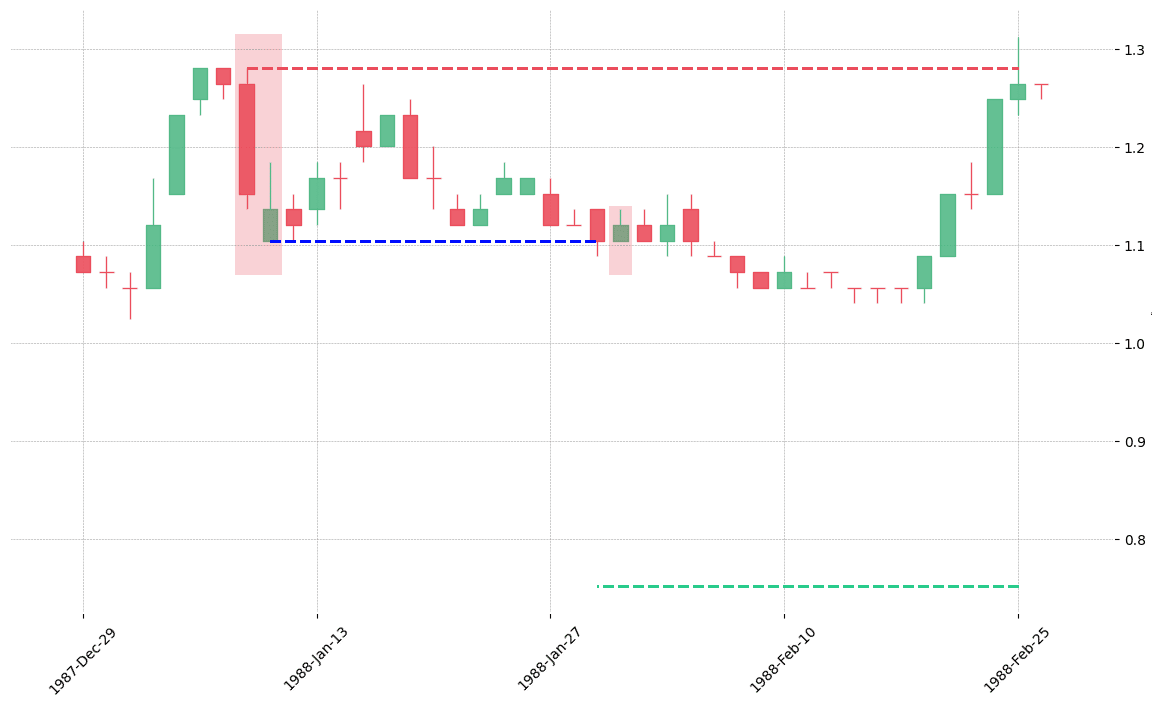
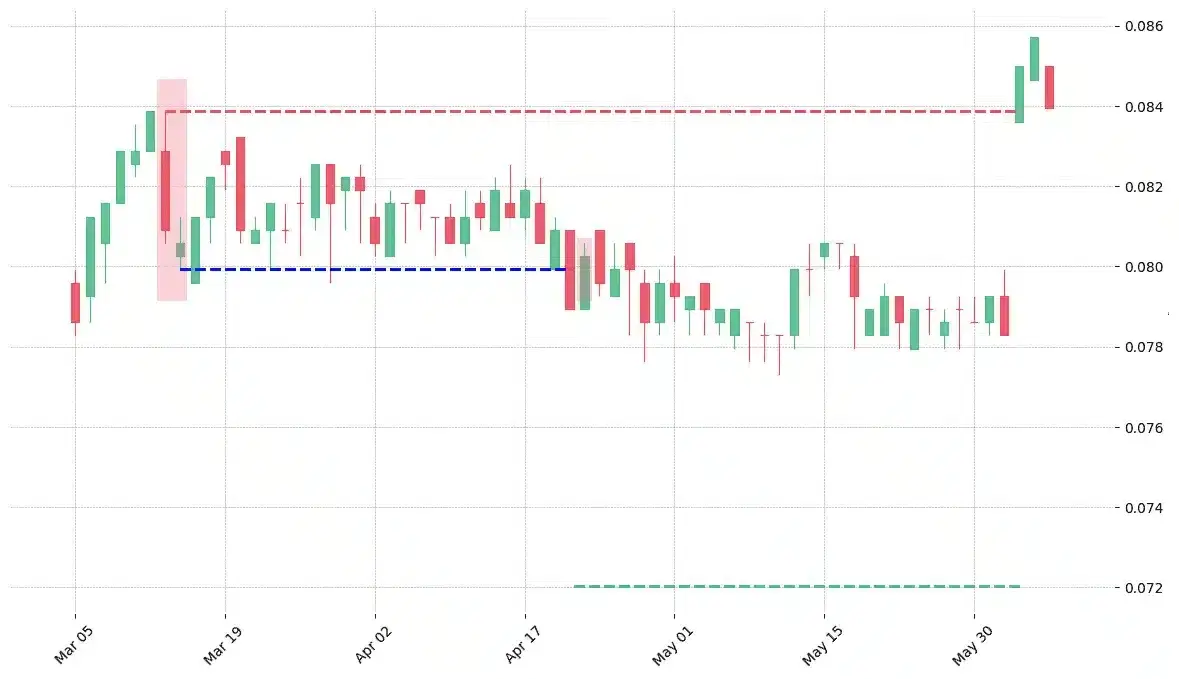
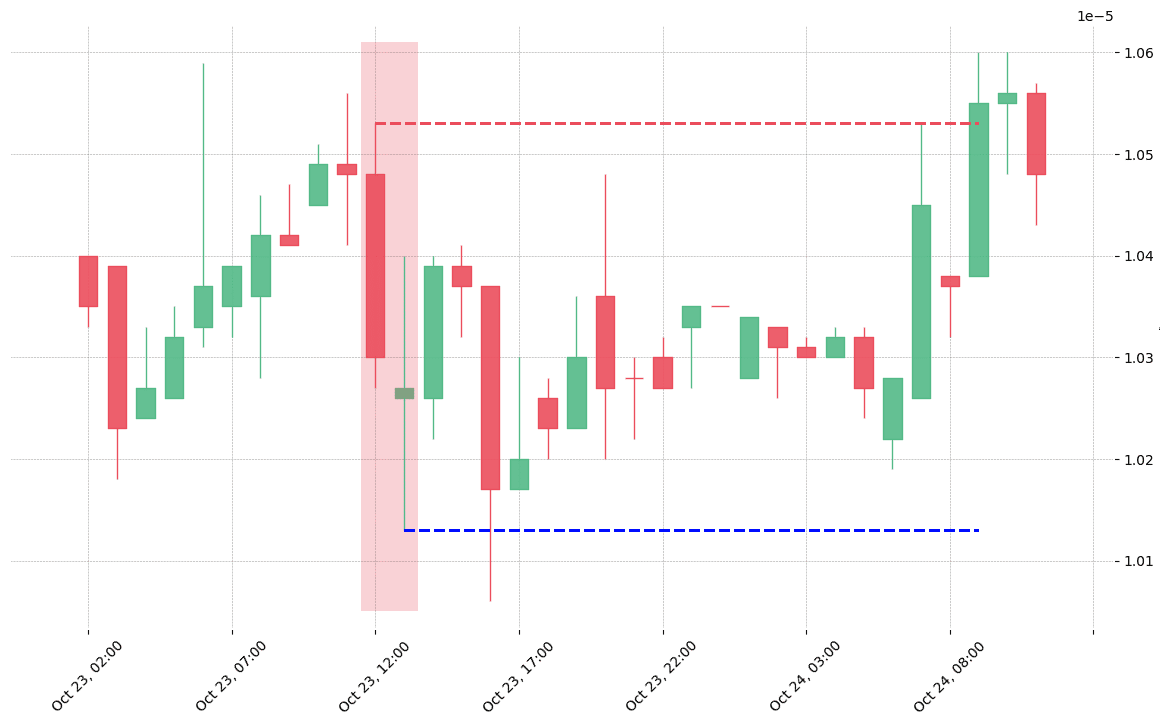
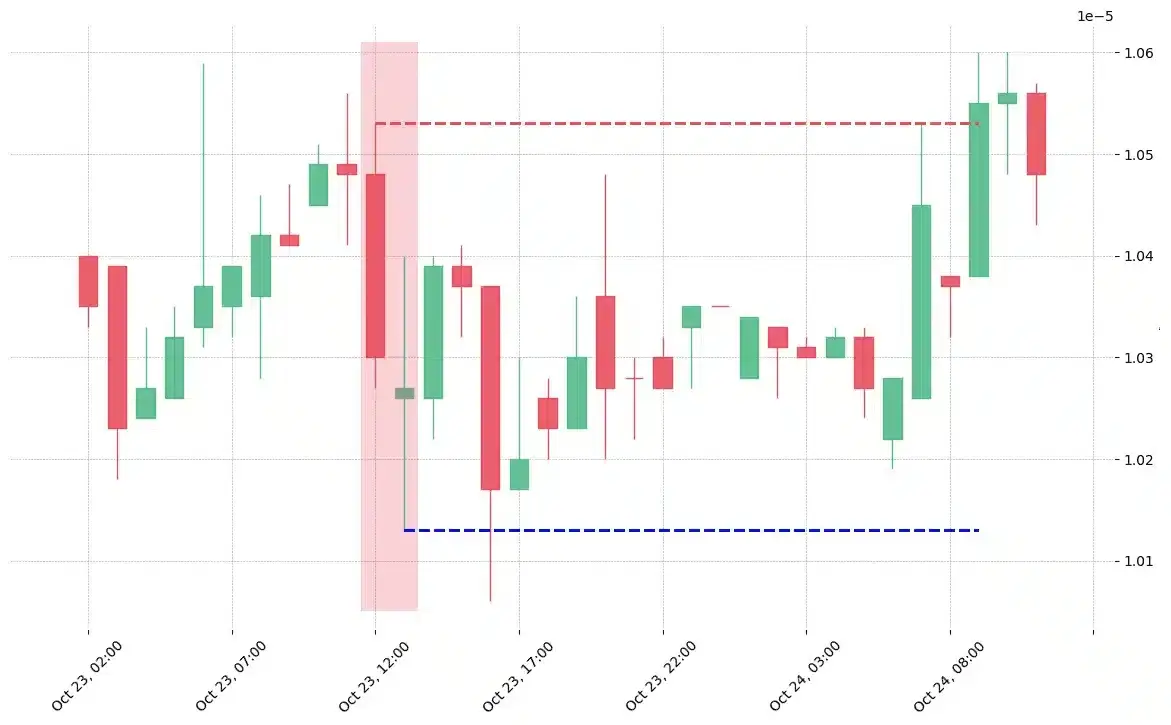
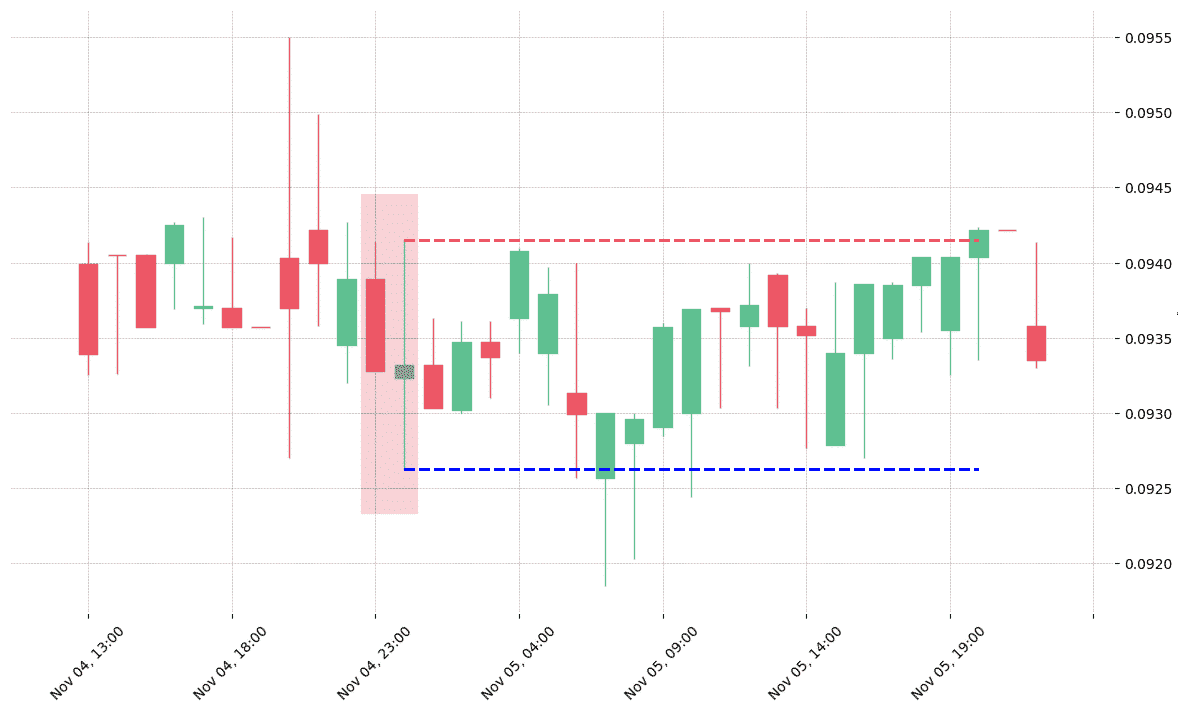
  • The on-neck candlestick pattern is a 2-bar continuation pattern.
  • Closing prices of the second candle is nearly the same than first candle high/low forming a horizontal neckline.

Statistics to prove if the On-neck pattern really works

Are the odds of the On Neck pattern in your favor?


How does the On Neck behave with a 2:1 target R/R ratio?

Success rate

From our research the On Neck pattern confirms 58.4% of the time on average overall all the 4120 markets we analysed. Historically, this patterns confirmed within 4.2 candles or got invalidated within 6.2 candles. If confirmed, it reached the 2:1 R/R target 33.8% of the time and it retested it's entry price level 97.7% of the time.
Not accounting for fees, it has an expected outcome of 0.015 $/$. It means for every $100 you risk on a trade with the On Neck pattern you make $1.5 on average.
Want to account for your trading fees? Have the detailled stats for your favorite markets / timeframes? Or get the stats for another R/R than 2:1?
🚀 Join us now and get fine-tuned stats you care about!

How to handle risk with the On Neck pattern?


We analysed 4120 markets for the last 59 years and we found 8 819 occurrences of the On Neck pattern.
On average markets printed 1 On Neck pattern every 1 769 candles.

For 2:1 R/R trades, the longest winning streak observed was 6 and the longest losing streak was 19. A trading strategy relying solely on this pattern is not advised. Anyway, make sure to use proper risk management.

Stack the odds in my favor NOW!

Keep in mind all these informations are for educational purposes only and are NOT financial advice.

If you want to learn more and deep dive into candlestick patterns performance statistics, I strongly recommend you follow the best available course about it. Joe Marwood (who's a famous trader with more than 45 000 Twitter followers) created an online course called "Candlestick Analysis For Professional Traders" in his Marwood Research University. There he will take you through the extensive backtesting of the 26 main candlestick patterns. He then summarizes which one is THE best pattern. Do you know which one it is?
Remember, don't trade if you don't know your stats. Click here to signup to the course now!

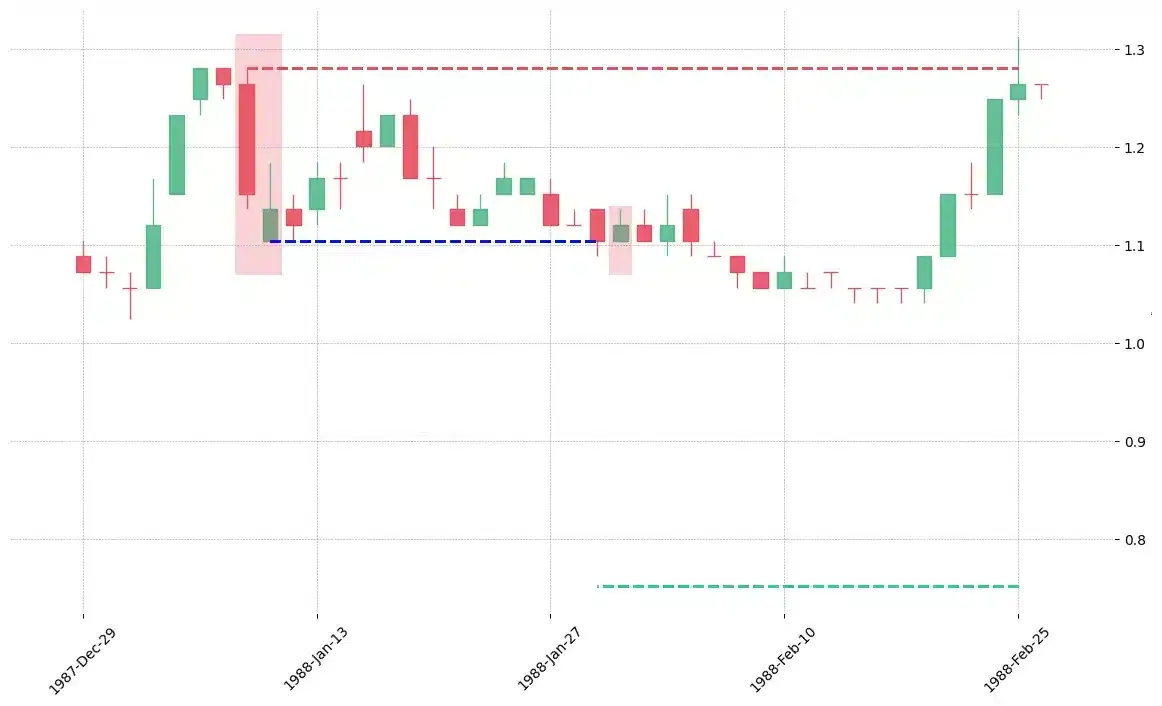
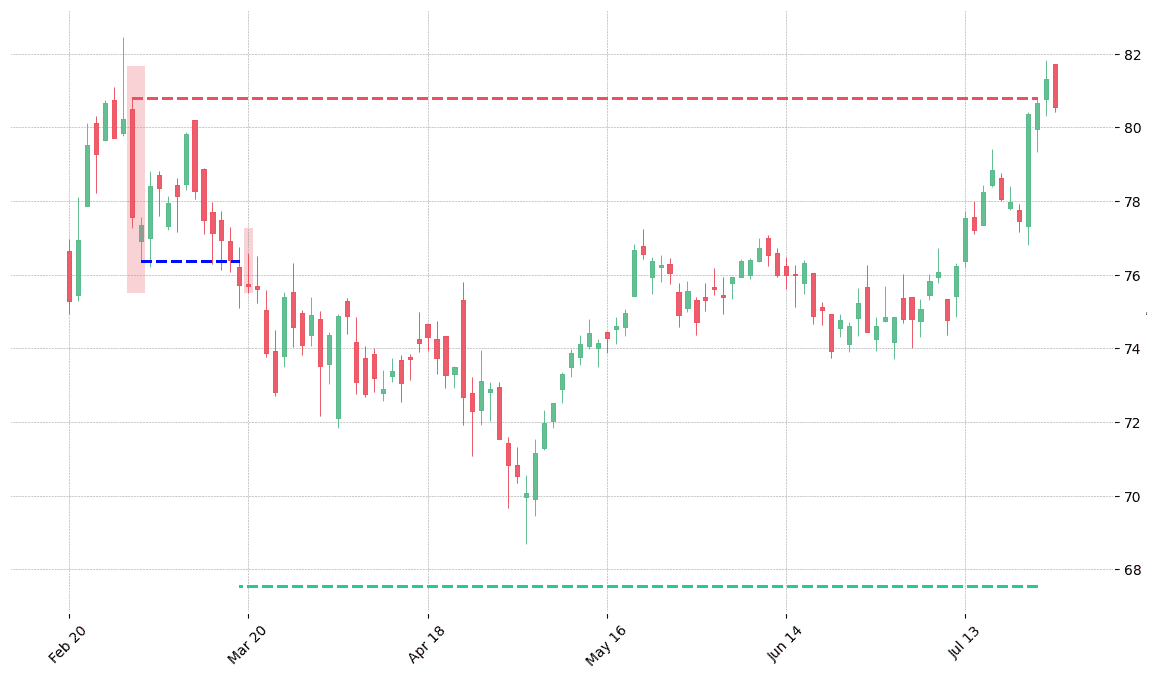
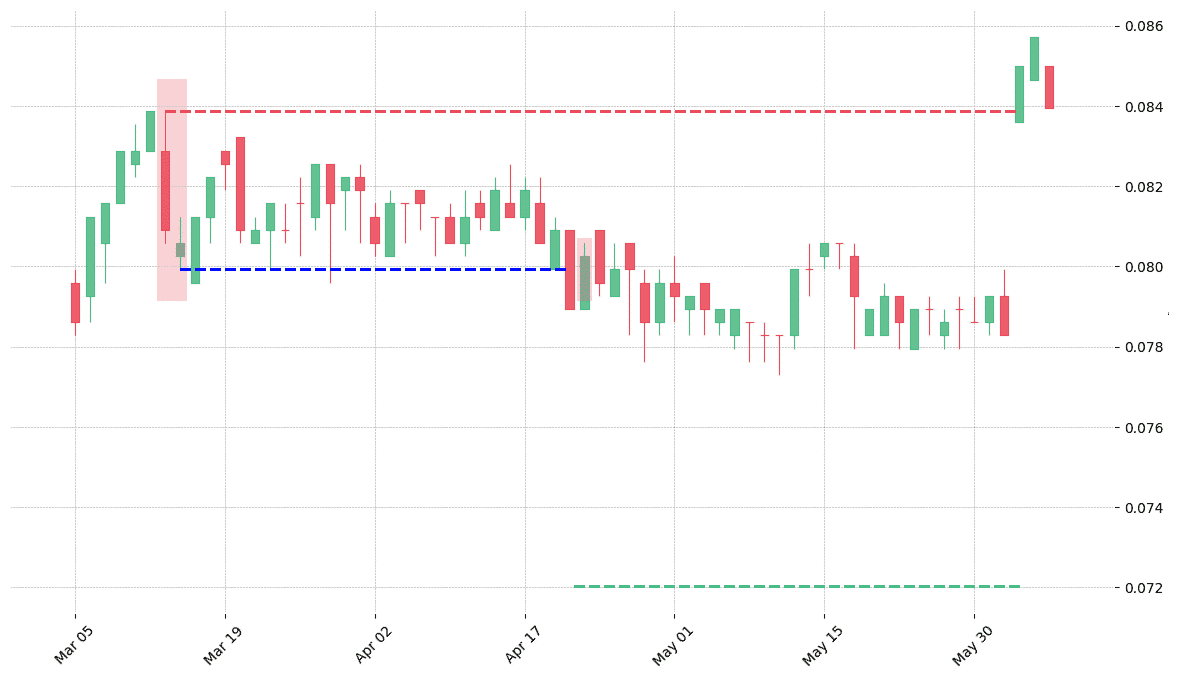
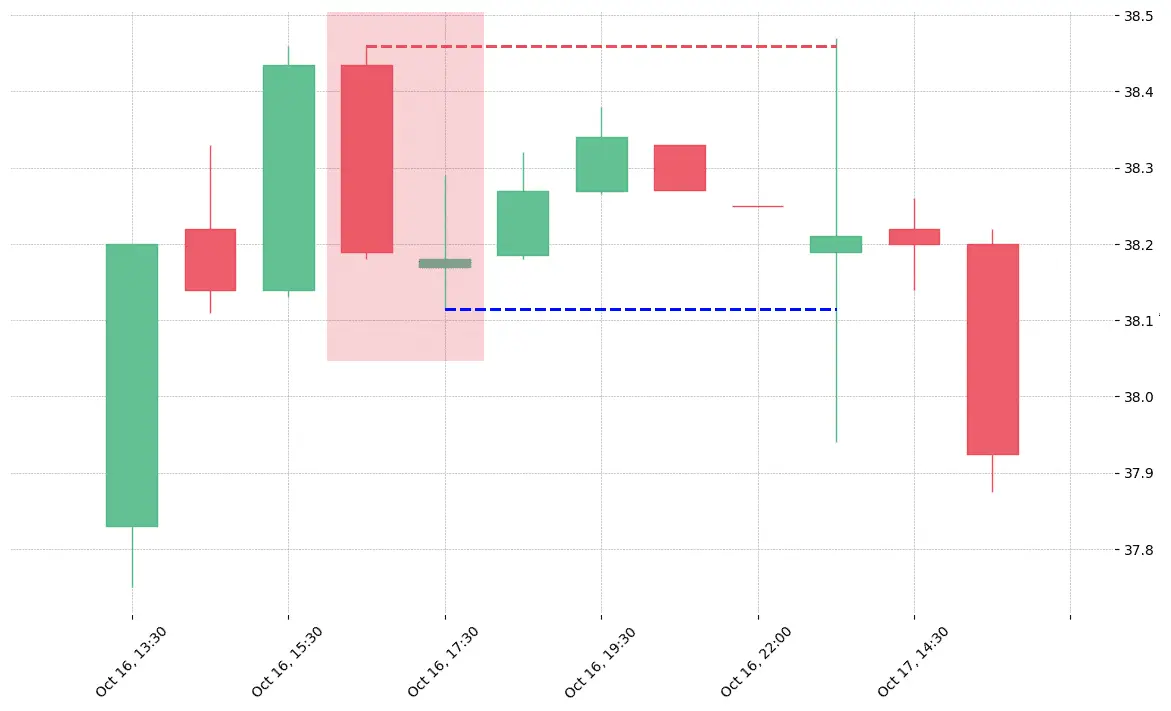
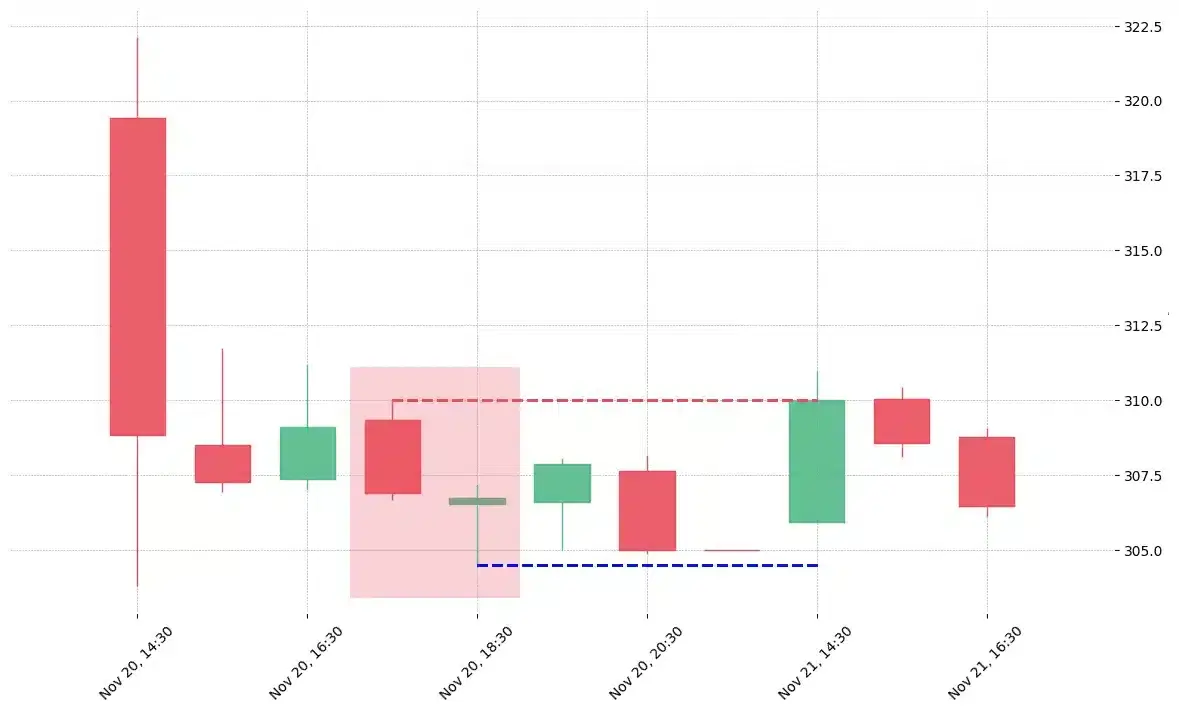
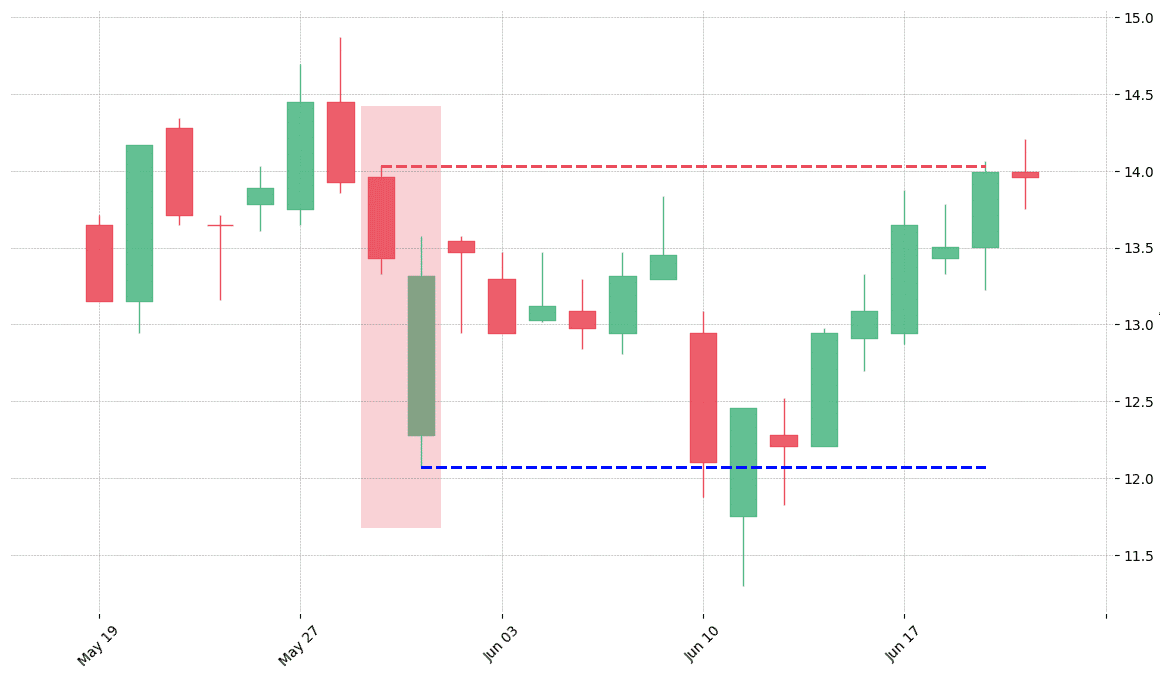
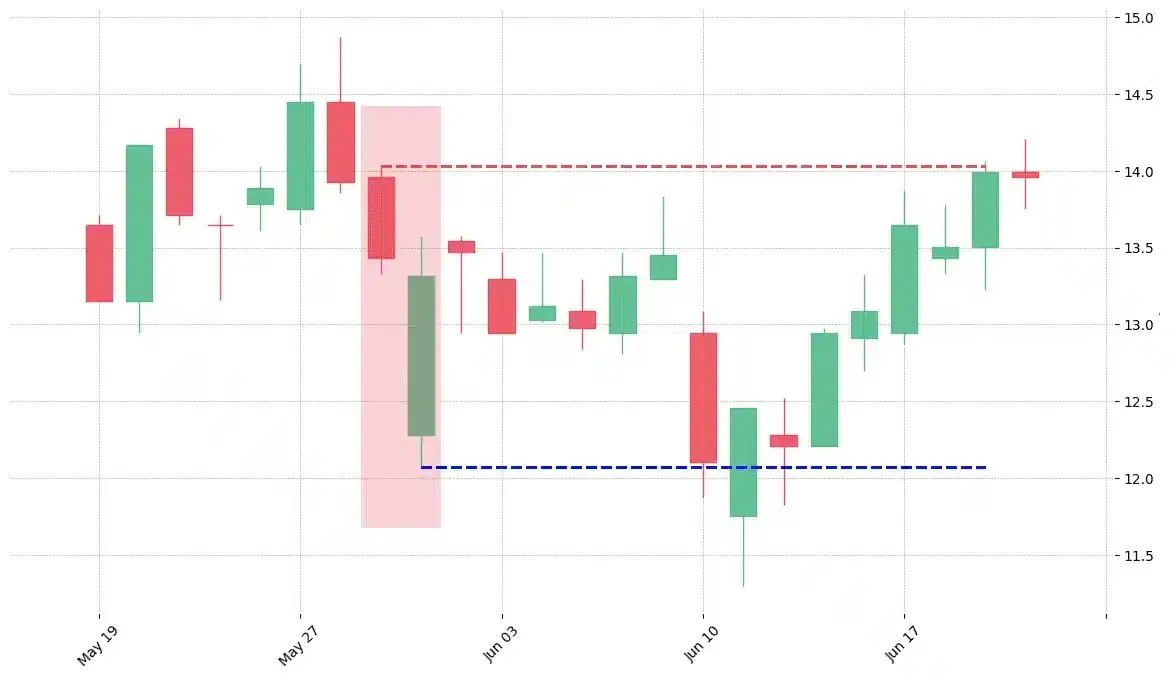
The on-neck candlestick pattern is a bearish continuation pattern that appears during a downtrend in the market. It consists of two candlesticks and closing prices of both candles are the same or nearly the same forming a horizontal neckline. That is the reason that the on-neck pattern is also named as the neckline. 

How to identify the on-neck candlestick pattern?

The on-neck candlestick pattern is a two-bar candlestick pattern. It is a small and easy candlestick pattern to identify. A candlestick pattern needs to meet the following conditions to be an on-neck candlestick pattern.

  • The on-neck pattern is a bearish continuation pattern, therefore, there must be a downtrend in the market.
  • The first candle must be a long black candle.
  • The second candle must be a small white candle.
  • The close of the second candle should match the low of the previous candle. It must not rise beyond the low price of the first candle.

Although the criteria for the on-neck pattern is simple and easy, yet care must be taken to correctly identify the pattern. It is very similar to the in-neck candlestick pattern that also appears during a downtrend and predicts the continuation of the current trend in the market. However, there is a slight difference between the two patterns. The in-neck pattern’s second candle closes slightly higher than the closing of the first candle. Therefore, it is important to take time to correctly identify the pattern whenever looking to identify either of the two candlestick patterns. 

What does the on-neck candlestick pattern tell traders? 

The on-neck candlestick pattern is a bearish continuation pattern that predicts the continuation of the current downtrend in the market. The appearance of the first bearish candle indicates the bearish sentiment in the market. The market is in complete control of the bears. In such circumstances, the bulls try to turn the tables expecting that the market will reverse. During the second day, the bulls try to push prices high with great buying pressure. However, the second day’s bullish candle fails to close above the first bearish candle despite the best efforts of the bulls. It opens and closes below the first candle. All this indicates the continuation of the current downtrend.

Like with other patterns, wait for confirmation

The traders should wait for the confirmation candle before acting on the predictions of the on-neck pattern. The bearish candle appearing on the fourth day provides confirmation. Although the on-neck candlestick pattern is a continuation pattern, the prices may go in either direction. Therefore, traders should use the on-neck pattern with other technical analysis tools for further information to devise better trading strategies to achieve higher profits. 

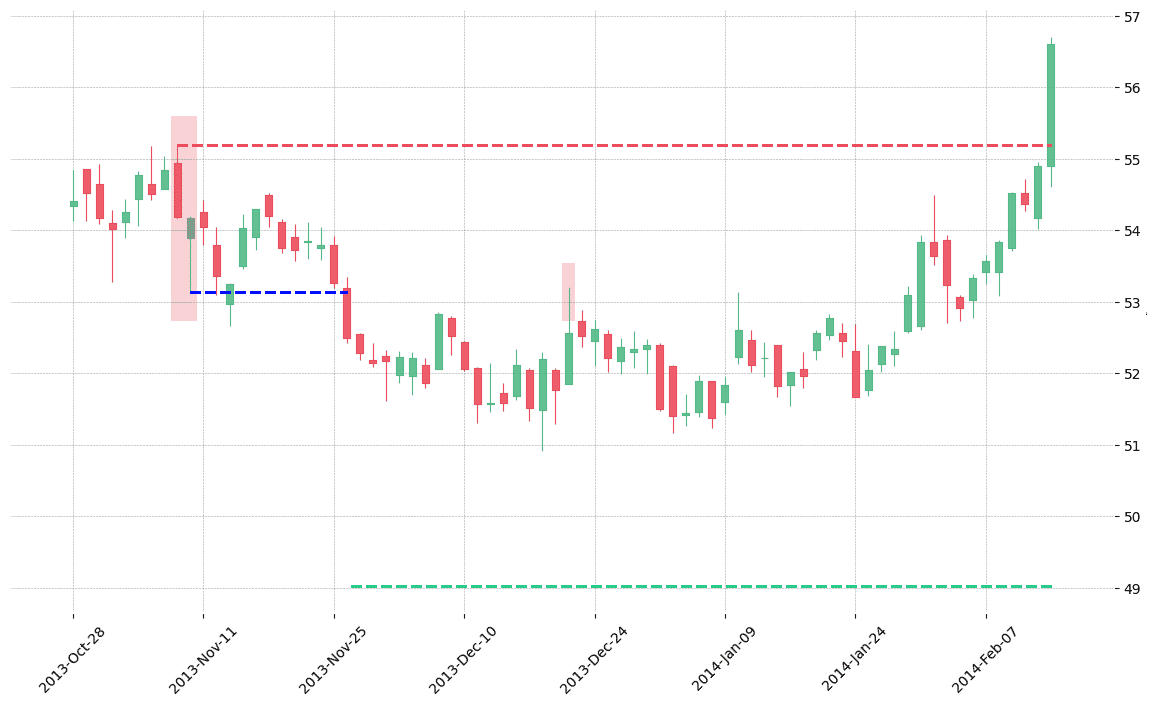
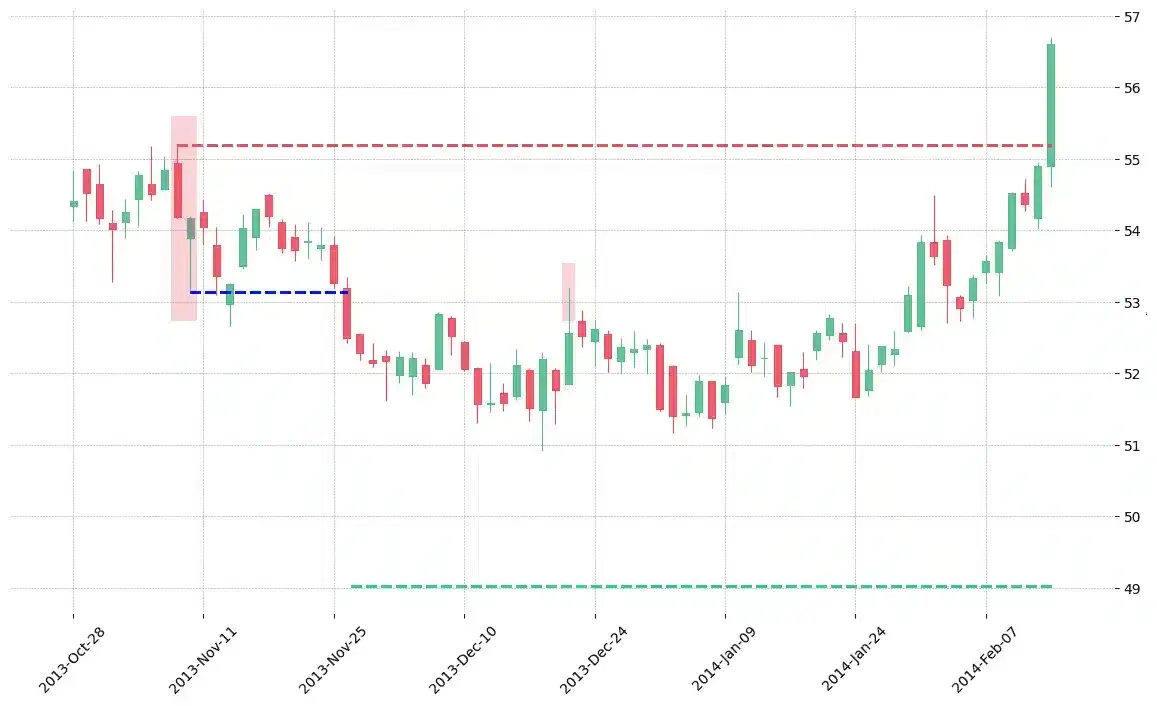
How does the pattern look in real life?

The stock DTE printed a bearish On Neck on 2013-11-07. It confirmed on 2013-11-26 (meaning price closed below entry level). It retested the trade entry level on 2013-12-20. Then it failed to reach the 2:1 R/R target and got stopped on 2014-02-14.
The cryptocurrency pair FTM/BTC printed a bearish On Neck on 2019-10-11 16:00:00. It confirmed on 2019-10-12 11:00:00 (meaning price closed below entry level). It retested the trade entry level on 2019-10-12 12:00:00. Then it failed to reach the 2:1 R/R target and got stopped on 2019-10-15 11:00:00.
The cryptocurrency pair ZEC/BTC printed a bearish On Neck on 2018-04-05 12:00:00. It confirmed on 2018-04-06 07:00:00 (meaning price closed below entry level). It retested the trade entry level on 2018-04-06 08:00:00. Then it failed to reach the 2:1 R/R target and got stopped on 2018-04-12 04:00:00.
The stock MYL printed a bearish On Neck on 1988-01-08. It confirmed on 1988-01-29 (meaning price closed below entry level). It retested the trade entry level on 1988-02-01. Then it failed to reach the 2:1 R/R target and got stopped on 1988-02-25.
The stock RTX printed a bearish On Neck on 2018-03-01. It confirmed on 2018-03-19 (meaning price closed below entry level). It retested the trade entry level on 2018-03-20. Then it failed to reach the 2:1 R/R target and got stopped on 2018-07-25.
The stock VFC printed a bearish On Neck on 1990-03-13. It confirmed on 1990-04-20 (meaning price closed below entry level). It retested the trade entry level on 1990-04-23. Then it failed to reach the 2:1 R/R target and got stopped on 1990-06-04.
The cryptocurrency pair NAV/BTC printed a bearish On Neck on 2019-10-23 12:00:00. Unfortunately it invalidated on 2019-10-24 09:00:00 before the trade could trigger (it triggered the stop before entering).
The cryptocurrency pair THETA/USDT printed a bearish On Neck on 2019-11-04 23:00:00. Unfortunately it invalidated on 2019-11-05 20:00:00 before the trade could trigger (it triggered the stop before entering).
The stock BWA printed a bearish On Neck on 2019-10-16 16:30:00. Unfortunately it invalidated on 2019-10-17 13:30:00 before the trade could trigger (it triggered the stop before entering).
The stock CHTR printed a bearish On Neck on 2018-11-20 17:30:00. Unfortunately it invalidated on 2018-11-21 14:30:00 before the trade could trigger (it triggered the stop before entering).
The stock KLAC printed a bearish On Neck on 1997-05-29. Unfortunately it invalidated on 1997-06-19 before the trade could trigger (it triggered the stop before entering).

Looking to learn more about this pattern?
You should take a look at Joe Marwood's online course. In his course, he backtested the 26 main candlestick patterns before to summarize which one is THE best pattern. I really liked his course and you shouldn't miss it!
Click here to signup to his "Candlestick Analysis For Professional Traders" course now!

Russell Crane

Russell Crane

Russell is an Algorithmic & Technical Analyst Trader @ PatternsWizard.
His passion is to share his knowledge about TA, patterns & more. Why hope for your trading to work when you can precisely know the performance stat of every pattern?

Are Candlestick Patterns Reliable

candlesticksWe loved Marwood Research’s course “Candlestick Analysis For Professional Traders“. Do you want to follow a great video course and deep dive into 26 candlestick patterns (and compare their success rates)? Then make sure to check this course!

Want to know which markets just printed a pattern?

Market Timeframe Printed on

Get “Every Candlestick Patterns Statistics”, The Last Trading Book You’ll Ever Need! 📖

PatternsWizard book - Every Candlestick Patterns Statistics

"Every Candlestick Patterns Statistics", the last trading book you'll ever need!

Pre-register now and receive the candlestick patterns statistics ultimate ebook for free before anyone else!

"All you need is one pattern to make a living."
- Linda Raschke

Awesome move! We are giving the last touch to the "Every Candlestick Patterns Statistics" book. We are very excited to send it to you right when it's ready. In the meantime, we'd like to gift you our trading roadmap and its best 55 resources. You'll shortly receive an email with the link. Don't miss it ;) Stay tuned 📈