
 Good Trading requires the Best Charting Tool!
- The Gartley pattern is a 4-legged harmonic pattern
- It can be bullish or bearish
- It follows clear fibonacci levels (see the Gartley ratios paragraph for detail)
Interested in learning more about harmonics pattern in general?
You’ll love this two courses I shortlisted for you on Udemy:
- Forex Harmonic Pattern Trading – With Multiple Chart Examples: it’ll teach you step-by-step how to identify most harmonic pattern applied to forex markets.
- Harmonic Trading: The Art Of Trading With Low Risk: it’ll guide you to your first harmonic trades, what are potential reversal zones and it’ll give you practical applications so you can truly understand how to use it.
If you prefer to skip the learning part and are just looking for a harmonic patterns scanner, you might want to check this harmonic patterns screener here. You’ll get a 7-days free trial (+ 50% off your 1st month subscription if you decide to continue).
Or you can just continue reading and learn more with our article below about Gartley patterns.
What is the Gartley pattern?
The Gartley pattern is the most commonly used harmonic pattern that is based on Fibonacci numbers and ratios. This pattern offers assistance to traders in identifying reaction highs and lows. H.M. Gartley laid down the foundation for harmonic chart patterns in 1932 in his book ‘Profits in the Stock Market’.
A harmonic pattern operates on the basis that Fibonacci sequences can be applied in building geometric structures, like retracements and breakouts in prices. The Fibonacci ratio is common in nature. It has become a famous area of focus among technical analysts that use tools.
This is one of the most traded patterns. It is a retracement and continuation pattern that is formed when a trend temporarily changes direction before continuing in its original direction. It provides a low-risk opportunity for traders to go into the market where the pattern finishes and the trend comes back.
How to identify the Gartley pattern?
Gartley chart pattern forms in a given context
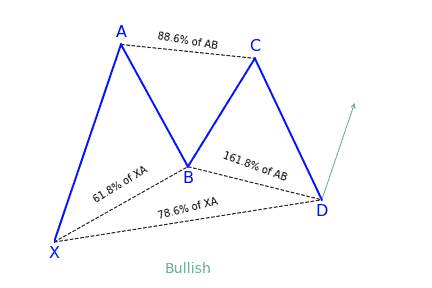
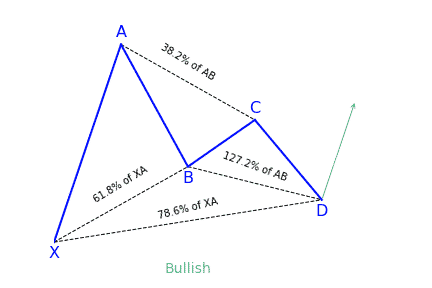
The Gartley pattern depends on various labeled points within a general movement in price. Most Gartley patterns are for overall bullish trends (as the point from X to A is moving upwards) that is currently experiencing a bearish retracement.
Since the pattern is a member of the Harmonic family, every swing has to conform to particular Fibonacci levels. We will now look at each component of the Gartley structure.
The Gartley structure: several important parts
X to A
The movement begins with X to A and there are no specifics for identifying the X to A leg of the Gartley pattern. In its bullish version, this first leg gets formed when the price sharply rises from point X to point A. This is the longest leg of the pattern.
A to B
This is where Fibonacci becomes relevant to the pattern. The distance between A and B should be close the size of the movement from X to A. The A-B leg will not retrace pass point X – if it does, the pattern is considered invalid.
B to C
This movement should be a retracement of 38.2% or 88.6% of the movement of A to B. If the B to C move retraces above point A, the Gartley pattern is void
C to D
This should be an extension of the B to C leg. The difference when trading this pattern is that you will place your trade entry at the point where the C to D leg has achieved a high percentage retracement of the X to A leg.
A to D
After the completion of C-D, traders should measure the overall movement of A to D. It should be a 78.6 percent retracement of the change in price of X to A.
Bullish and bearish variations
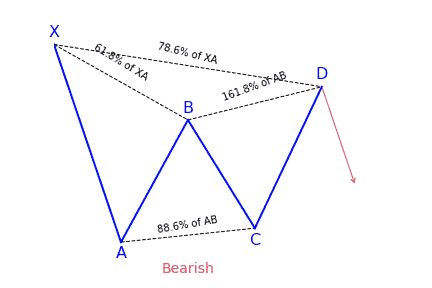
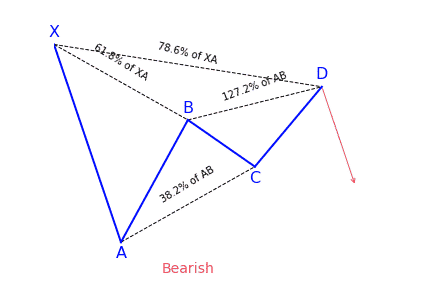
The bearish version of the Gartley pattern is just the opposite of the bullish pattern. It shows a bearish downtrend with several price targets when the pattern reaches completion by the fourth point.
What does the Gartley pattern tell traders?
A lot of technical analysts make use the Gartley harmonic pattern together with other chart patterns or technical indicators. For instance, the pattern can give a big picture overview of where the price is likely to go over the long-term. In the meantime, traders focus on executing short-term trades in the direction of the predicted trend. The breakout and breakdown price targets may also be used as support and resistance levels by traders.
The best part about these types of chart patterns is that they give particular knowledge about both the timing and magnitude of price movements rather than just look at one or the other.
Just as it is with other chart patterns, there is a bullish and a bearish version. The Gartley harmonic pattern includes the AB=CD pattern, this means that it is necessary for traders to study it before making any decision. The pattern is often known to as Gartley222 because Gartley first described it on page 222 of his book.
How to Trade when you see the Gartley Pattern?
What to consider to enter the trade?
To enter a Gartley trade you should first take note of the pattern and then confirm if it is valid or not. Outline the four price swings on the chart and check to make sure they respond to their respective Fibonacci levels to draw the Gartley pattern on your chart. Ensure you mark every price action swing with the important letters X, A, B, C, and D. By doing this, you will be able to estimate the overall size of the pattern and get a clear idea about the parameters.
If your chat is a bullish Gartley, open a long trade after noticing these conditions:
- CD gets support at 127.2 percent or 161.8 percent Fibonacci level of the BC move.
- The price action bounces in a bullish direction from the respective Fibonacci level.
If the Gartley pattern is bearish, then you make use of the same two rules to open a trade. But in this case, your trade will to the short side.
Where to set your stop-loss for a Gartley trade?
It is always recommended that you use a stop loss order regardless of your preferred entry signal. By doing this, you will be protecting yourself from any rapid or unexpected price moves. The stop loss order of a bullish Gartley trade should be found below the D point of the chart pattern. But for a bearish Gartley trade, your stop loss order should be found above the pattern’s D point.
What to aim for your take profit for a Gartley trade?
When you open your Gartley trade and you place your stop loss order, you expect the price to move in your favor, right? And if and when it does, you should know how long you expect to stay in the trade.
It is advisable to enter a full position after the D bounce and then scale out at different levels when trading a Gartley harmonic pattern. If the price momentum continues to show signs of strength, you can opt to keep a small portion of the trade open so as you can catch a large move. Use price action clues such as trend lines, support and resistant techniques, candle patterns and trend lines to find the right final exit point. But generally, if the price action shows no signs of interrupting the new trend, just stay in it for as long as you can.
Looking for a way to automatically find harmonic patterns in your favorite markets?
You definitely need a screener for that! Check out this harmonic patterns scanner here!
If you come from us (simply click the link below), you’ll get a 7-days free trial and 50% off your first month’s subscription fee. Don’t think more, go test it out for free now!
Click here to signup and claim your 7-days free trial to the best harmonic pattern scanner.


 We loved Marwood Research’s course “Candlestick Analysis For Professional Traders“. Do you want to follow a great video course and deep dive into 26 candlestick patterns (and compare their success rates)? Then make sure to check this course!