
 Good Trading requires the Best Charting Tool!
- Cycles are are patterns which repeat (in the market, business or in other contexts).
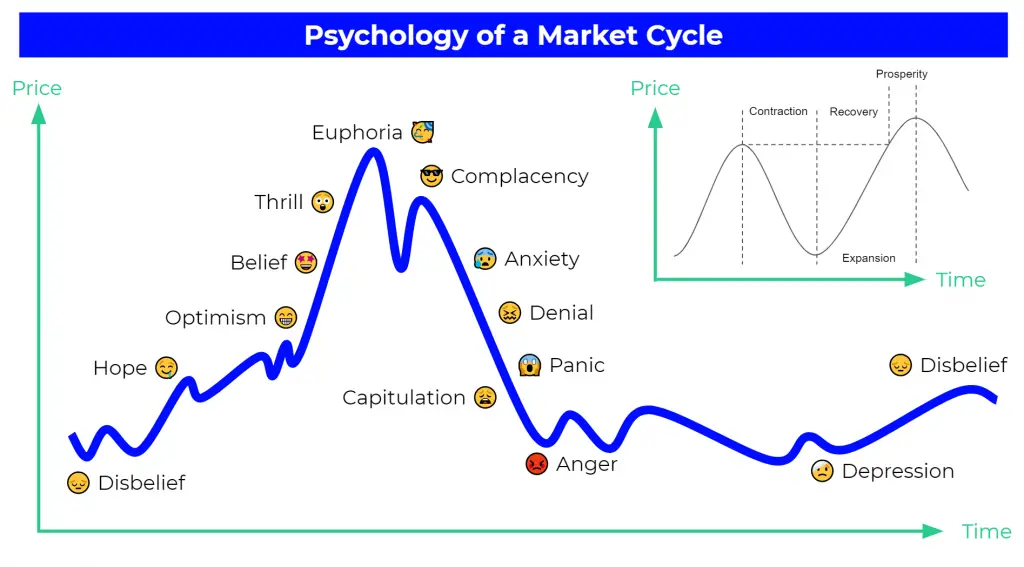
- Market cycles often have 4 phases.
- Identifying the current phase of the cycle can be close to impossible.
- Assets behave differently at the different phases of the market cycle.
Even though there are a lot of lessons from past bubbles, mistakes still happen. One of the several market phases is a bubble. To avoid being off-guard, you need to know what these phases (forming cycles) are.
Just like the seasons, financial markets experience cycles. When you apply basic economic principles and portfolio strategies, you can take advantage of these major market movements. You can choose to either ride the wave or weather the storm.
Generally, every market cycle lasts about four to five years. Within every cycle, there are usually six stages. During every stage, some assets outperform others. This is why traders need to buy the right asset class at the right time.
Understanding how markets work and a good grasp of technical analysis can help you recognize market cycles.
What are Market Cycles?
Market cycles are also referred to as stock market cycles. It is a broad term that means trends or patterns that come up during various markets or business environments.
When a cycle happens, some securities or asset classes outperform others because their business models are set for growth. Market cycles are the time between the two latest lows or highs of a common benchmark. It highlights the performance of a fund through both an up and a down market.
A cycle is an event which regularly repeats itself. Cycles exist in nature, the economy, and in financial markets. The basic business cycle comprises an economic bottom, downturn, economic upturn, and top.
In nature, cycles include the four seasons and solar activity. They are also part of technical analysis of the financial markets. Cycle theory states that cyclical forces, both short and long, drive price movements in the financial markets.
How Market Cycles work?
New market cycles form when trends within a specific sector develop in response to vital innovation, new products, or regulatory environment. These cycles are mostly referred to as secular. During these times, net profits and revenue may show similar growth patterns among many organizations within a particular industry.
Market cycles are mostly difficult to detect. They rarely have a specific, clearly identifiable start or end point. This often causes confusion and controversy on assessing of policies and strategies. But most experts believe they exist. A lot of investors pursue investment strategies that aim to profit from them.
Drivers of Market Cycles
There are a lot of reasons for the natural cycles in financial markets. Top among them are macroeconomic factors, such as interest rates, inflation, economic growth rates, and levels of unemployment.
A drop in interest rates commonly sends markets higher because they show economic growth. But a rise in inflation shows an impending rise in interest rates. This causes contraction of the market and slowdown of economic growth.
Market sentiment can play a vital role in determining the movement of market cycles. Because of many factors, there may be a boom period where investors try to purchase particular assets. There may be periods where panic takes over the market, which causes investors to sell in large quantities.
Examples of Market Cycle
Throughout history, there are examples of financial market cycles. An example is the huge boom in spending and productivity. It is caused by the rise of the baby boomer generation. This caused markets to rise during the 1990s. Also, new technologies, like the internet, played their part.
When interest rates greatly rose at the beginning of the century, the dot-com bubble burst, this caused a mini-recession and a bear market.
The market rise was quickly followed by the housing bubble in 2007 and its subsequent market crash. This then caused a brief rally, the asset bubble and high-interest rates, which are currently prevailing in today’s market.
Phases of a Market Cycle
Cycles occur in every parts of life. They range from short-term, such as the life cycle of a June bug, to the life cycle of a planet. No matter the market you’re referring to, they all go through the same phases, and are cyclical. They go up, reach a peak, dip, and then bottom out.
When one market cycle completes, the next one starts. The issue is that most investors fail to recognize that markets and are cyclical. Another reason is that they forget to expect the end of the current market phase.
A major challenge is that even when you accept the existence of cycles, it is almost impossible to choose the top or bottom of one. However, having an understanding of cycles is vital if you want to maximize investment or trading returns. Below are the four major components of a market cycle and how you can recognize them.
1. Accumulation Phase
This phase happens after the market has bottomed and the innovators and early adopters start buying. At this phase, valuations are attractive, and general market sentiment is still bearish.
2. Mark-Up Phase
Here, the market has been stable for a while and is starting to move higher. The early majority are getting on. Media stories start discussing the possibility that the worst is over. But unemployment continues to rise, and reports of layoffs in most sectors.
3. Distribution Phase
In this phase, sellers start dominating. This part of the cycle is obvious during a time in which the bullish sentiment of the previous phase turns into a mixed sentiment. Prices can mostly remain locked in a trading range that can last a few weeks or months.
4. Mark-Down Phase
The final phase in the cycle is the most painful for traders who still hold positions. Most of them hang on because their investment has fallen below what they paid for. Unfortunately, this is a buy signal for early innovators and a signal that a bottom will surely occur.
Characteristics of Cycle
Cycle Length
Lows are mostly used to define the length of a cycle and drive it into the future. You can expect a cycle high can somewhere between the cycle lows.
Translation
Cycles rarely peak at the same midpoint or trough at the expected cycle low. Most times, peaks happen before or after the midpoint of the cycle. The right translation is the chance of prices to peak in the latter part of the cycle during bull markets.
On the other hand, left translation is the chance of prices to peak in the front half of the cycle during bear markets.
Harmonics
Bigger cycles can break down into smaller and equal cycles. Sometimes a bigger cycle can divide into three or more parts. The inverse also happens. Small cycles can multiply into bigger ones.
Nesting
The low of a cycle reinforces when a lot of cycles indicate a trough at the same time. The 10-week, 20-week, and 40-week cycles are nesting when they all trough at the same period.
Inversions
At times, a cycle high happens when there should be a cycle low and vice versa. This occurs when a cycle high or low skips or is minimal. A cycle low may be short or almost non-existent in a good uptrend. At the same time, markets can fall quickly and skip a cycle high during sharp declines.
Conclusion
As an investor, you need to recognize these signals and never lose sight of the bigger picture. It is like Warren Buffett once mentioned. Be scared when others are greedy and greedy when others are afraid. Therefore, keep an eye on the fundamental and behavioral factors that influence the market and always remain ahead of the game. Make sure you include this in your trading plan before to take action on it.


 We loved Marwood Research’s course “Candlestick Analysis For Professional Traders“. Do you want to follow a great video course and deep dive into 26 candlestick patterns (and compare their success rates)? Then make sure to check this course!