Chart patterns provide so many smart ways of applying harmonic patterns in your chart. Some of them are fully automated approaches and some of them are semi-automated approaches. One of them is using the XABCD harmonic chart pattern.
- The XABCD harmonic is a group of reversal patterns.
- It’s a 4-legged pattern and has several variants (Gartley, Butterfly, Crab, Bat).
- Each variant has its specific fibonacci ratios
Before you keep reading this extensive article, you should check this two courses I shortlisted for you on Udemy:
- Forex Harmonic Pattern Trading – With Multiple Chart Examples: it’ll teach you step-by-step how to identify most harmonic pattern applied to forex markets.
- Harmonic Trading: The Art Of Trading With Low Risk: it’ll guide you to your first harmonic trades, what are potential reversal zones and it’ll give you practical applications so you can truly understand how to use it.
If you prefer to skip the learning part and are just looking for a harmonic patterns scanner, you might want to check this harmonic patterns screener here. You’ll get a 7-days free trial (+ 50% off your 1st month subscription if you decide to continue).
Or you can just continue reading and learn more with our article below about XABCD patterns.
What is the XABCD pattern?
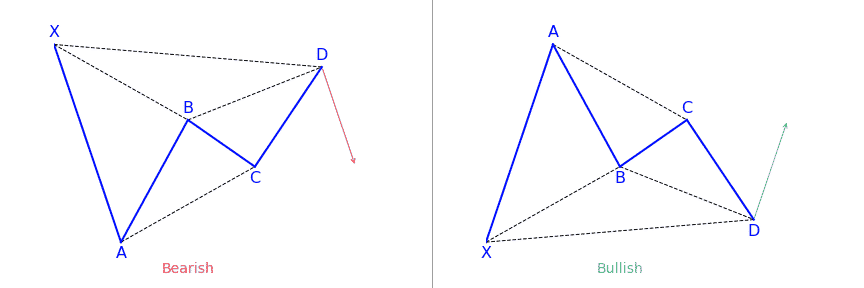
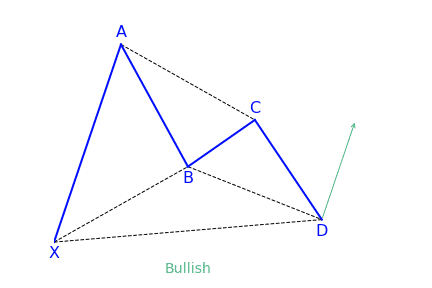
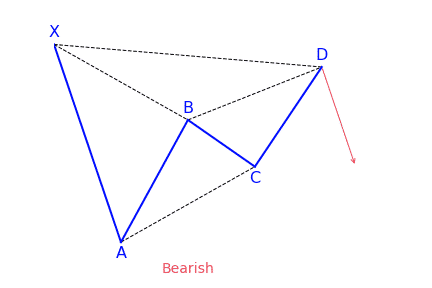
Created by Harold McKinley Gartley, XABCD harmonic pattern drawing tool makes it possible for analysts to highlight various five point chart patterns. Users can draw and maneuver the five separate points (XABCD) manually. The XABCD points make four distinct legs that come together to form chart patterns. The four legs are known as XA, AB, BC, and CD.
Each of the five points (XABCD) show an important low or high in terms of price on the chart. Thus, the four previously mentioned legs (XA, AB, BC, CD) represent different trends or price movements which move in opposite directions.
Due to this, there are four major XABCD chart patterns that are most popular. They can be either bearish or bullish. The four main patterns include Gartley, Butterfly, Crab and Bat.
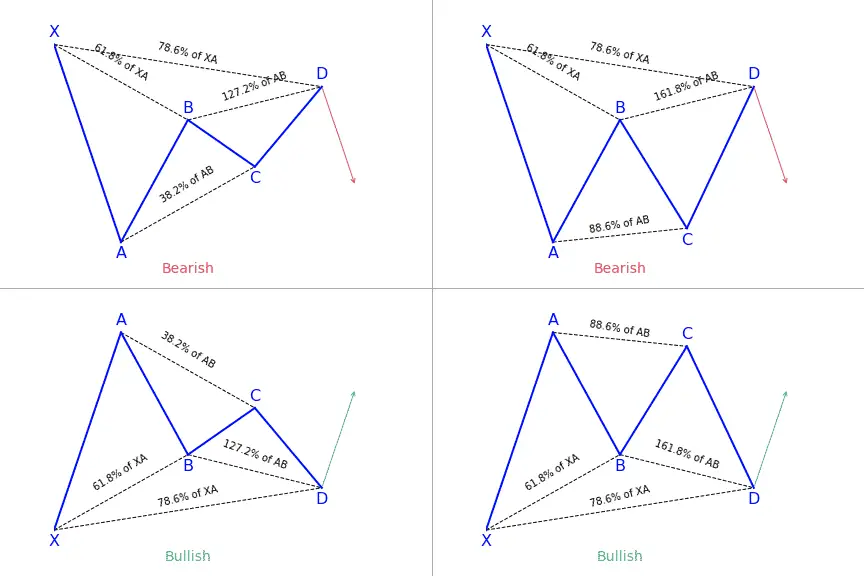
The Gartley pattern
Gartley forms when the action of price has been happening for an uptrend or downtrend, but has started showing indications of correction. The pattern is made up of ABCD pattern bearish or bullish, but preceded by a point (X) which are above the point D. Gartley pattern has the these qualities:
- AB movement should be 61.8 percent retracement of XA
- BC movement has to be 38.2 percent or 88.6 percent retracement of AB
- If BC 38.2 percent retracement occurs, CD has to move 127.2 percent of BC. Thus, if BC is 88.6 percent, the CD should be expanded 161.8 percent of BC
- CD movement has to be 78.6 percent retracement of XA
The Butterfly pattern
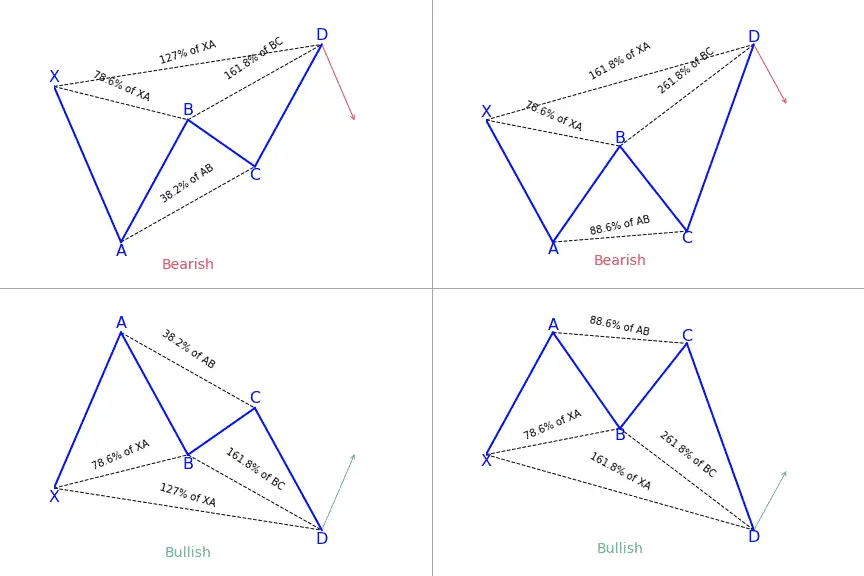
Made by Bryce Gilmore, the butterfly pattern is perfect is defined as the 78.6 percent Fibonacci retracement AB of XA . This pattern contains special qualities such as:
- The length of AB has to be 78.6 percent retracement of XA
- The length of BC might be 38.2 percent or 88.6 percent retracement move from AB
- If BC moves 38.2 percent retracement of AB, then CD should be 161.8 percent of BC. Thus, if BC is 88.6 percent going from AB, then CD has to be expanded 261.8 percent of BC
- CD has to either be 127 percent or 161.8 percent of XA
The Crab pattern
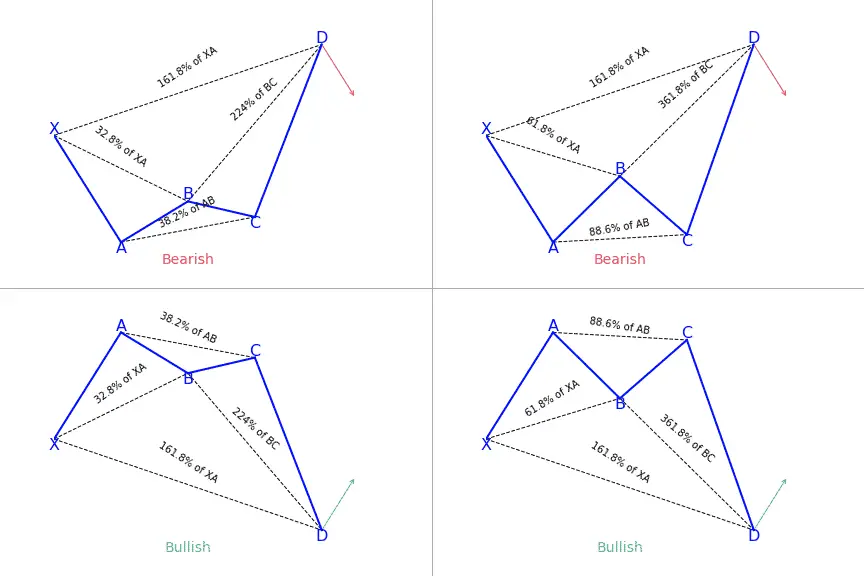
Scott Carney in 2000 strongly believed in the harmonic pattern, and created the crab. He stated that this is the most accurate patterns among all harmonic patterns as potential reversal zone extreme way of movement XA.
The crab pattern has a high risk/reward ratio, because you can put a very tight stop-loss position. The pattern should have the following characteristics:
- The length of AB has to either be 38.2 percent or 61.8 percent retracement of the XA
- The length of BC might be 38.2 percent or 88.6 percent retracement of the length AB
- If the length of BC is 38.2 percent retracement of AB, CD has to be 224 percent of BC. Therefore, if the length of BC is 88.6 percent of the length of AB, then the length of the CD will be 361.8 percent of BC
- CD has to be 161.8 percent of the length of XA
The Bat pattern
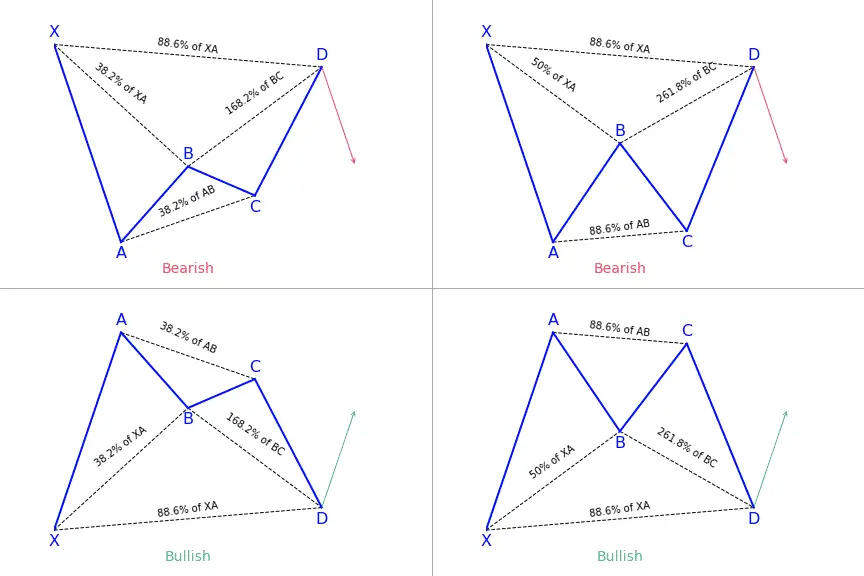
Scott Carney found another harmonic pattern in 2001 called bat. The bat is characterized from the 88.6 percent Fibonacci retracement of the movement XA as potential reversal zone. Bat pattern has these qualities:
- The length of AB has to be 38.2 percent or 50.0 percent retracement of XA
- BC can either be 38.2 percent or 88.6 percent retracement of the AB
- If retracement BC 38.2 percent of AB, then CD has to be 161.8 percent of BC. Therefore, if the BC 88.6 percent moving from AB, then CD has to be 261.8 percent of BC
- CD must be 88.6 percent retracement of XA
What does the XABCD pattern tell traders?
The XABCD harmonic pattern can be grouped into retracement, extensions and x-point patterns. Locating them can be tricky if doing it on your own and it can take a long time because there are approximately 11 ratios in every pattern to be measured. Rather, some traders do it automatically with some tools available. The pattern also work with audio alerts and other alerting systems so you don’t have to waste your time trying to locate them, but rather, just carrying out your analysis.
How to use the XABCD Pattern?
XABCD harmonic pattern falls into the category of the retracement patterns, all having a D point that does not go beyond the X point of a pattern. They will have a D point (where a price reversal is preferred) close to the B point. Different retracement XABCD harmonic patterns can be used in ranges or channels, so, you have to be sure to know which one to apply in which situation.
Biggest mistakes to avoid with the XABCD pattern
These patterns operate based on human emotions and there isn’t one time frame that performs better than another. That is likely because we are mapping out patterns of human emotions and the traders that are reacting to particular events react the same way if it is a shorter term move, or a longer term move.
There are a few factors that come into play with the decision making process based off larger vs. smaller time frames, but this can be easily adaptable once you decide what to look for.
Since XABCD patterns act based on human emotions, it would only make sense to take time into account to get a more consistent harmonic pattern structure.
Have it in mind that if you want to make adjustments you need to ensure all the most consistent patterns possible. By doing this, you can see more clearly the impacts that your changes have on the results pushing forward.
Pros & Cons of using these patterns
One advantage of using this pattern is that it offers more consistency with price and time. Traders often look for is consistency within the patterns and how you identify that consistency is necessary. Fibonacci time measurements play a crucial role in XABCD harmonic patterns.
Drawing any harmonic patterns needs the identification of the impulse leg, it’s the foundation of all harmonic patterns. But if you were to pull up any chart, you can see that the market is made up of several impulse legs.
To select the right one, the decision is entirely up to you. A possible solution would be to choose the impulse leg that coincides with a structure resistance or support. Usually, the more confluence you have, the higher the probability of your trade.
Conclusion
If you think about trading as a business and not a hobby, then you should have a plan for everything. You do not want to make decisions which are subjective as it will influence your thought process.
Just as it is with any other trading strategies, whether harmonic trading, price action trading, or trend following, there are pros and cons to it. As a trader, you have to know the pitfalls of your trading approach and apply proper risk management. It is best to use most of these patterns in combination with other trade reading strategies to guarantee the best results.
Looking for a way to automatically find harmonic patterns in your favorite markets?
You definitely need a screener for that! Check out this harmonic patterns scanner here!
If you come from us (simply click the link below), you’ll get a 7-days free trial and 50% off your first month’s subscription fee. Don’t think more, go test it out for free now!
Click here to signup and claim your 7-days free trial to the best harmonic pattern scanner.
 Good Trading requires the Best Charting Tool!


 We loved Marwood Research’s course “Candlestick Analysis For Professional Traders“. Do you want to follow a great video course and deep dive into 26 candlestick patterns (and compare their success rates)? Then make sure to check this course!